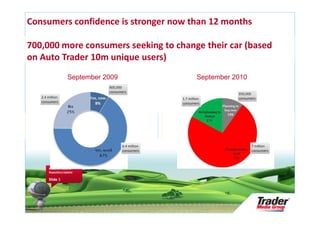
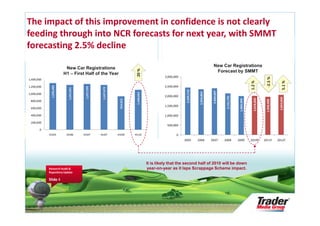
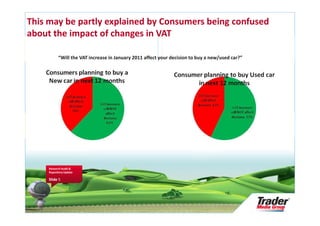
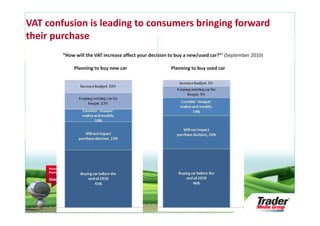
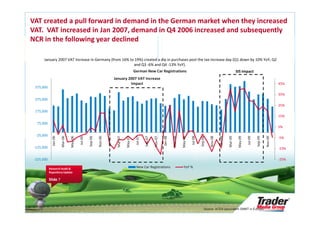
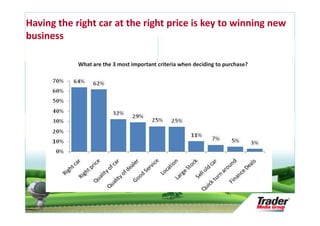
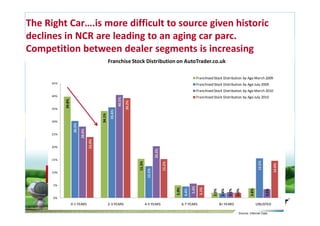
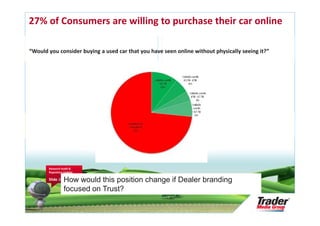
SlideShare a Scribd company logo
Consumer Feedback on Key Questions
        Facing the Industry


                         Tim Peake
                      Commercial Director
29th September 2010
Summary


 •   Auto Trader collected key questions / concerns from dealers at the beginning of September 2010

 •   These questions were analysed and the top 15 were incorporated into a survey

 •   The survey was placed on the Auto Trader Website

 •   5,000 consumers responded to the survey between 15th September to 25th September 2010

 •   The following slides summarise the answers from these consumers

 •   The report is intended to help dealers understand how the market may change based on current consumer
     sentiment. It will hopefully drive some useful debates within your dealership.

 •   If you have any further questions or would like further detail / discussions on some of the possible implications
     this report outlines, please contact Tim Peake:

      Research Audit &
      •
      Repository Update tim.peake@tradermedia.co.uk
             Email;
      • 2
      Slide Phone: 01189 239 103
Consumers confidence is stronger now than 12 months

700,000 more consumers seeking to change their car (based
on Auto Trader 10m unique users)
                    September 2009                          September 2010
                               800,000
                               consumers
                                                                       950,000
   2.4 million                                     1.7 million         consumers
   consumers                                       consumers


                                     6.4 million                             7 million
                                     consumers                               consumers


       Research Audit &
       Repository Update

       Slide 3
The impact of this improvement in confidence is not clearly
feeding through into NCR forecasts for next year, with SMMT
forecasting 2.5% decline
                                                                                                                                           New Car Registrations
                           New Car Registrations


                                                                              20 %
                                                                                                                                            Forecast by SMMT
                          H1 – First Half of the Year
                                                                                                    3,000,000


                                                                                                                                                                                                 -2.5 %
1,400,000


                                                                                                                                                                                 1.2 %


                                                                                                                                                                                                                  5.1 %
                                                                                                    2,500,000
              1,296,486


1,200,000                                1,267,299


                                                      1,247,479
                            1,241,921


                                                                                                                 2,439,718


                                                                                                                                           2,404,007
                                                                                                                              2,344,864
                                                                              1,108,662
1,000,000
                                                                                                    2,000,000


                                                                                                                                                        2,131,795


                                                                                                                                                                                                              2,069,000
                                                                                                                                                                                    2,018,000
                                                                                                                                                                     1,994,999
                                                                   924,955


                                                                                                                                                                                                 1,968,000
 800,000
                                                                                                    1,500,000
 600,000

 400,000                                                                                            1,000,000

 200,000
                                                                                                     500,000
       0
            H105           H106         H107         H107         H109       H110                          0
                                                                                                                2005         2006         2007         2008         2009         2010f          2011f        2012f


                                                                                          It is likely that the second half of 2010 will be down
            Research Audit &                                                              year-on-year as it laps Scrappage Scheme impact.
            Repository Update

            Slide 4
This may be partly explained by Consumers being confused
about the impact of changes in VAT

           “Will the VAT increase in January 2011 affect your decision to buy a new/used car?”


     Research Audit &
     Repository Update

     Slide 5
VAT confusion is leading to consumers bringing forward
their purchase
               “How will the VAT increase affect your decision to buy a new/used car?”¹ (September 2010)

                         Planning to buy new car               Planning to buy used car


     Research Audit &
     Repository Update

     Slide 6
VAT created a pull forward in demand in the German market when they increased
VAT. VAT increased in Jan 2007, demand in Q4 2006 increased and subsequently
NCR in the following year declined

      January 2007 VAT Increase in Germany (from 16% to 19%) created a dip in purchases post the tax increase day (Q1 down by 10% YoY, Q2
                                                       and Q3 -6% and Q4 -13% YoY).
                                                                                                German New Car Registrations                                                                        SIS Impact
                                                                             January 2007 VAT Increase
                                                                                      Impact                                                                                                                                             45%
 375,000
                                                                                                                                                                                                                                         35%
 275,000
                                                                                                                                                                                                                                         25%
 175,000
                                                                                                                                                                                                                                         15%
  75,000
                                                                                                                                                                                                                                         5%

  -25,000
              Jan-06

                       Mar-06

                                May-06


                                                           Nov-06

                                                                    Jan-07

                                                                              Mar-07

                                                                                       May-07


                                                                                                                   Nov-07

                                                                                                                            Jan-08

                                                                                                                                     Mar-08

                                                                                                                                              May-08


                                                                                                                                                                         Nov-08

                                                                                                                                                                                  Jan-09

                                                                                                                                                                                           Mar-09

                                                                                                                                                                                                     May-09


                                                                                                                                                                                                                                Nov-09
                                         Jul-06

                                                  Sep-06


                                                                                                 Jul-07

                                                                                                          Sep-07


                                                                                                                                                       Jul-08

                                                                                                                                                                Sep-08


                                                                                                                                                                                                              Jul-09

                                                                                                                                                                                                                       Sep-09
                                                                                                                                                                                                                                         -5%

 -125,000                                                                                                                                                                                                                                -15%

 -225,000                                                                                                                                                                                                                                -25%

            Research Audit &                                                                     New Car Registrations                          YoY %
            Repository Update

            Slide 7


                                                                                                                                                                    Source: ACEA (equivalent SMMT in Europe)
Having the right car at the right price is key to winning new
business

                         What are the 3 most important criteria when deciding to purchase?


     Research Audit &
     Repository Update

     Slide 8
The Right Car….is more difficult to source given historic
declines in NCR are leading to an aging car parc.
Competition between dealer segments is increasing
                                                          Franchise Stock Distribution on AutoTrader.co.uk

                                                                                                                                          Franchised Stock Distribution by Age March 2009
       45%                                                                                                                                Franchised Stock Distribution by Age July 2009
                                                                                                                                          Franchised Stock Distribution by Age March 2010
       40%                                                                                                                                Franchised Stock Distribution by Age July 2010


                                                                   40.5%
                 39.8%


                                                                           39.2%
       35%
                                                           35.6%
                                                  34.1%


       30%
                          30.2%
                                  28.0%


       25%
                                          23.9%


       20%


                                                                                                    20.3%
       15%


                                                                                                                                                                                             15.5%
                                                                                   15.3%


                                                                                                            15.2%


                                                                                                                                                                                                            14.6%
     Research Audit &
                                                                                            12.5%


     Repository Update
       10%

     Slide 9
        5%

                                                                                                                                   5.6%
                                                                                                                                           5.1%
                                                                                                                    5.0%
                                                                                                                            4.4%


                                                                                                                                                     2.0%
                                                                                                                                                             1.8%
                                                                                                                                                                    2.2%
                                                                                                                                                                           2.0%


                                                                                                                                                                                     3.8%


                                                                                                                                                                                                     3.5%
        0%
                         0-1 YEARS                        2-3 YEARS                        4-5 YEARS                       6-7 YEARS                        8+ YEARS                        UNLISTED

                                                                                                                                                                             Source: Internal Data
The Right Price…..majority of consumers are not prepared
to pay a premium for buying from a franchise dealer
                         Are you prepared to pay a premium from buying
                                    from a franchise dealer?


                                               39%                       Yes

                                     61%                                 No


     Research Audit &
     Repository Update

     Slide 10
The Right Price….there are regional differences in terms of
what Consumers are prepared to pay as a premium from a
franchise dealer


     Research Audit &
     Repository Update

     Slide 11
The Right Price…..of the 39% that are prepared to pay a
premium 75% are prepared to pay up to £299 and 25% are
prepared to pay more than £299
                        More than £500
                            extra
                             10%


                                 An
                              additional       An additional
                             £300 - £500         £0 - £99
                                16%                29%


                              An additional
                              £200 - £299     An additional
                                  21%         £100 - £199
                                                  25%


    Research Audit &
    Repository Update

    Slide 12
However Franchise dealers price is £500+ more than Independents.
As Franchise move into older age stock the price differential has been
decreasing (last yr vs, this yr)
                                                    Average Price of Car by Stock Band
                 £16,000                                        July 2009
                 £14,000


                               £14,808
                               £14,556
                 £12,000


                                                                                  £12,467
                 £10,000                                                                                    Franchised - Average Car Price July 2009


                                          £10,787
                                         £10,127
                   £8,000                                                                       £5,963      Independent - Average Car Price July 2009


                                                      £7,726
                   £6,000


                                                     £7,098


                                                                                              £6,504
                                                                £5,429
                   £4,000                                                                                   Jul 2009 Fr-Ind Price Difference


                                                               £4,763


                                                                         £4,326
                                                                         £3,348
                   £2,000
                       £0
                             -£252      £660      £628      £666      £977
                  -£2,000   0-1 YEARS 2-3 YEARS 4-5 YEARS 6-7 YEARS 8+ YEARS


                                                    Average Price of Car by Stock Band
                 £20,000                                        July 2010
                 £15,000
                               £16,111
                              £15,450


      Research Audit &                                                              £12,787                 Franchised - Average Car Price July 2010
                  £10,000
                                          £11,598


      Repository Update
                                         £10,806


                                                                                                   £5,770
                                                      £9,060


                                                                                                            Independent - Average Car Price July 2010
                                                     £8,291


      Slide 13
                                                                                                £7,017


                  £5,000
                                                                £6,329
                                                               £5,630


                                                                         £4,734
                                                                         £3,681


                                                                                                            July 2010 Fr-Ind Price Difference
                      £0
                            -£661       £792      £769      £699     £1,053
                            0-1 YEARS 2-3 YEARS 4-5 YEARS 6-7 YEARS 8+ YEARS
                 -£5,000
Furthermore the majority of consumers are searching on a national basis and hence
are exposed to “national prices”. Hence understanding price specifically is key.

Furthermore communicating points of differentiation are even more important
given price transparency (e.g. Trust, Reputation, other products / services).

   Search radius AT.co.uk                 Consumers who selected a radius when searching
                                          on AT.co.uk (i.e. did not default search to
                                          National)


       Research Audit &
       Repository Update

       Slide 14
Pricing tools are going to become even more important. Market
Tracker provides visibility of AT advertised price, CAP retail and CAP
Trade prices and is updated daily (with AT prices)
             Price distribution for Ford Focus 1.6 Zetec 5 dr (climate pack) 07 Plate


      Research Audit &
      Repository Update

      Slide 15
An example of innovation in products and services to build trust is Guaranteed
Buy Back. Of the 17% of consumers who were not planning to buy a car in the
next 12 months, 58% could change their mind if a dealer guaranteed to buy back
their car. Hence using products to build Trust can pull in more consumers


  “If a dealer guaranteed to buy back your car for an agreed price in the future, would this influence your decision
                                                    to purchase?”

                                                                 287,000
                                                                 consumers


                                721,000
                                consumers
                                                                         691,000
                                                                         consumers


        Research Audit &
        Repository Update

        Slide 16
The majority of Consumers visit between 2-3 dealerships when making a
purchase decision


       9% of consumers will not visit a dealership, suggesting they buy from Friends,
       family or get someone else to conclude the transaction (could also be online
                                        opportunity)


      Research Audit &
      Repository Update

      Slide 17
Consumers, when choosing a dealership value reputation, trust and knowledgeable
sales staff (enhances trust)

Pushing manufacturer brands would allow Franchise to win in their segment (1-3 yr
old cars), whilst Independents can price competitively in older age vehicles

                           “What is the most important quality you look for in a dealership?”


       Research Audit &
       Repository Update

       Slide 18
Consumers are agnostic to dealer brands - 65% outlined the dealer brand is
unimportant


                              Does dealer branding influence which dealership you buy from?


       Research Audit &
       Repository Update

       Slide 19


       Source:    1. Top 10 Dealer Concerns Survey launched on autotrader.co.uk September 2010
Franchise and Independent need to focus on what differentiates
them to win different types of consumers in the next 12 months

  Franchise
  •   Price premium achievement is more likely if messaging is based on:
        •    Trust – manufacturer brand vs. dealer brand vs group – be clear on the value of these
        •    Reputation – consumer user reviews
        •    Additional Products – buy back for guaranteed price, increases consumer demand and demand that can
             be fulfilled via franchise dealers
        •    Knowledgeable sales staff
               •    What justifies the premium (warranty, checks, approved used schemes)
               •    After sales service
        •    Consistent brand messages
        •    Pricing tools critical

  •   Independent
        •      Priced competitively, acknowledging national price transparency
        •      Pricing tools critical
        •      Trust, knowledgeable sales staff just as important (£425 spent on used cars after purchase to rectify
        Research Audit &
               problems)
        Repository Update

        Slide 20

  •   Ageing car parc, similarities in stock profile make the importance of these points of differentiation critical in
      the next 12 months
Creating trust through your website


  Research Audit &
  Repository Update

  Slide 21
Communicating trust via online stock
advertising


  Research Audit &
  Repository Update

  Slide 22
Doing the basics well


  Research Audit &
  Repository Update

  Slide 23
33% of consumers are already prepared to order their new car
(used and new) online….that’s potentially 3.3m transactions


                         “Would you like to be able to order your new car online?”


                                                                 3.3 million
                                                                 consumers


                             6.3 million
                             consumers


     Research Audit &
     Repository Update

     Slide 24   Do sales staff seek to close the transaction on the phone
                or do they try and encourage the consumer into the show
                room?
There are regional differences, with 38% of consumers in
London and the South East most likely to order a vehicle
online
                       “Would you like to be able to order your new car online?”


   Research Audit &
   Repository Update

   Slide 25
27% of Consumers are willing to purchase their car online

“Would you consider buying a used car that you have seen online without physically seeing it?”


       Research Audit &
       Repository Update

       Slide 26   How would this position change if Dealer branding
                  focused on Trust?
Maximising the opportunity in the next 12
months
There is potentially a large appetite to begin transacting online

The assets required to unlock the opportunity are:
     Right car, right price (or justification of the right price)

     Reputation, Trust , knowledgeable sales staff

 These are the same attributes that consumers value when choosing a
dealership offline

 However consumers do not associate these assets with specific dealer brands
 Hence the majority are not prepared (or do not necessarily see the benefit) to
pay a premium from a franchise dealer (or pay more from one franchise dealer
    Research Audit &

thanRepository Update
     another)
    Slide 27
Maximising the opportunity in the next 12
months
However

 Trust is built through clear brand messaging (manufacturer brands, groups, dealers - what role
should each play?)

Investment in optimising online advertising is key
      Doing the basics well (photos, clear messaging, brand values)
      Communicate trust on everything you do - all your advertising
      Don’t be afraid of user reviews, consumers are more generous than you think
      Re-align your thinking on brand
      Focus on evolution of products – e.g. guarantee buy-back, builds trust

 Fundamentally the market has already changed

 The key is to unlock the opportunity by changing the business model to benefit from
the new landscape
     Research Audit &
     Repository Update

     Slide 28

More Related Content

What's hot

fiserv annual reports 2003
fiserv annual reports 2003fiserv annual reports 2003
fiserv annual reports 2003finance47
 
Microfinance Opportunities Amidst The New Regulatory Environment 2010
Microfinance Opportunities Amidst The New Regulatory Environment 2010Microfinance Opportunities Amidst The New Regulatory Environment 2010
Microfinance Opportunities Amidst The New Regulatory Environment 2010
guest665a59
 
Ethanol america s conference
Ethanol america s conferenceEthanol america s conference
Ethanol america s conferencePetrobras
 
parker hannifin 2008 Annual
parker hannifin 2008 Annualparker hannifin 2008 Annual
parker hannifin 2008 Annualfinance25
 
MMX 2011 result webcast
MMX 2011 result webcastMMX 2011 result webcast
MMX 2011 result webcastmmxriweb
 
Fundamental Equity Analysis - STOXX Europe Mid 200 Index Components
Fundamental Equity Analysis - STOXX Europe Mid 200 Index ComponentsFundamental Equity Analysis - STOXX Europe Mid 200 Index Components
Fundamental Equity Analysis - STOXX Europe Mid 200 Index ComponentsBCV
 
Dividend Idea Altria (NYSE:mo By http://long-term-investments.blogspot.com
Dividend Idea Altria (NYSE:mo By http://long-term-investments.blogspot.comDividend Idea Altria (NYSE:mo By http://long-term-investments.blogspot.com
Dividend Idea Altria (NYSE:mo By http://long-term-investments.blogspot.com
Dividend Yield
 
Tres Vista Weekly Me 27 08 09
Tres Vista Weekly Me 27 08 09Tres Vista Weekly Me 27 08 09
Tres Vista Weekly Me 27 08 09
guest6046f91
 
Tim meeting with investors - sep 2012
Tim   meeting with investors - sep 2012Tim   meeting with investors - sep 2012
Tim meeting with investors - sep 2012TIM RI
 
120511 iasi danuabe survey - Mr Orhan Ibram
120511 iasi   danuabe survey - Mr Orhan Ibram120511 iasi   danuabe survey - Mr Orhan Ibram
120511 iasi danuabe survey - Mr Orhan Ibram
RESTORE
 
Quepasa Corporation (NYSE Amex: QPSA) Q1 2012 Financial Results
Quepasa Corporation (NYSE Amex: QPSA) Q1 2012 Financial ResultsQuepasa Corporation (NYSE Amex: QPSA) Q1 2012 Financial Results
Quepasa Corporation (NYSE Amex: QPSA) Q1 2012 Financial ResultsMeetMe, Inc
 
CDON Group presentation Copenhagen, January 2013
CDON Group presentation Copenhagen, January 2013CDON Group presentation Copenhagen, January 2013
CDON Group presentation Copenhagen, January 2013Qliro Group AB
 
San Francisco Residential Data Q2 2009 - Q2 2011
San Francisco Residential Data Q2 2009 - Q2 2011San Francisco Residential Data Q2 2009 - Q2 2011
San Francisco Residential Data Q2 2009 - Q2 2011
Ronny Budiutama
 

What's hot (16)

fiserv annual reports 2003
fiserv annual reports 2003fiserv annual reports 2003
fiserv annual reports 2003
 
Microfinance Opportunities Amidst The New Regulatory Environment 2010
Microfinance Opportunities Amidst The New Regulatory Environment 2010Microfinance Opportunities Amidst The New Regulatory Environment 2010
Microfinance Opportunities Amidst The New Regulatory Environment 2010
 
ball ar00
ball ar00ball ar00
ball ar00
 
Ethanol america s conference
Ethanol america s conferenceEthanol america s conference
Ethanol america s conference
 
parker hannifin 2008 Annual
parker hannifin 2008 Annualparker hannifin 2008 Annual
parker hannifin 2008 Annual
 
MMX 2011 result webcast
MMX 2011 result webcastMMX 2011 result webcast
MMX 2011 result webcast
 
Fundamental Equity Analysis - STOXX Europe Mid 200 Index Components
Fundamental Equity Analysis - STOXX Europe Mid 200 Index ComponentsFundamental Equity Analysis - STOXX Europe Mid 200 Index Components
Fundamental Equity Analysis - STOXX Europe Mid 200 Index Components
 
Dividend Idea Altria (NYSE:mo By http://long-term-investments.blogspot.com
Dividend Idea Altria (NYSE:mo By http://long-term-investments.blogspot.comDividend Idea Altria (NYSE:mo By http://long-term-investments.blogspot.com
Dividend Idea Altria (NYSE:mo By http://long-term-investments.blogspot.com
 
Tres Vista Weekly Me 27 08 09
Tres Vista Weekly Me 27 08 09Tres Vista Weekly Me 27 08 09
Tres Vista Weekly Me 27 08 09
 
4Q07 presentation
4Q07 presentation4Q07 presentation
4Q07 presentation
 
Tim meeting with investors - sep 2012
Tim   meeting with investors - sep 2012Tim   meeting with investors - sep 2012
Tim meeting with investors - sep 2012
 
120511 iasi danuabe survey - Mr Orhan Ibram
120511 iasi   danuabe survey - Mr Orhan Ibram120511 iasi   danuabe survey - Mr Orhan Ibram
120511 iasi danuabe survey - Mr Orhan Ibram
 
Quepasa Corporation (NYSE Amex: QPSA) Q1 2012 Financial Results
Quepasa Corporation (NYSE Amex: QPSA) Q1 2012 Financial ResultsQuepasa Corporation (NYSE Amex: QPSA) Q1 2012 Financial Results
Quepasa Corporation (NYSE Amex: QPSA) Q1 2012 Financial Results
 
AMD_AR2001
AMD_AR2001AMD_AR2001
AMD_AR2001
 
CDON Group presentation Copenhagen, January 2013
CDON Group presentation Copenhagen, January 2013CDON Group presentation Copenhagen, January 2013
CDON Group presentation Copenhagen, January 2013
 
San Francisco Residential Data Q2 2009 - Q2 2011
San Francisco Residential Data Q2 2009 - Q2 2011San Francisco Residential Data Q2 2009 - Q2 2011
San Francisco Residential Data Q2 2009 - Q2 2011
 

Viewers also liked

Audit Report Model and Sample
Audit Report Model and SampleAudit Report Model and Sample
Audit Report Model and Sample
Flevy.com Best Practices
 
Type of auditing
Type of auditingType of auditing
Type of auditingDharmik
 
Audit Process, Audit Procedures, Audit Planning, Auditing
Audit Process, Audit Procedures, Audit Planning, AuditingAudit Process, Audit Procedures, Audit Planning, Auditing
Audit Process, Audit Procedures, Audit Planning, Auditing
Advance Business Consulting
 

Viewers also liked (6)

Audit Report Model and Sample
Audit Report Model and SampleAudit Report Model and Sample
Audit Report Model and Sample
 
Audit plan and program
Audit plan and programAudit plan and program
Audit plan and program
 
my fox
my fox my fox
my fox
 
Type of auditing
Type of auditingType of auditing
Type of auditing
 
Audit Process, Audit Procedures, Audit Planning, Auditing
Audit Process, Audit Procedures, Audit Planning, AuditingAudit Process, Audit Procedures, Audit Planning, Auditing
Audit Process, Audit Procedures, Audit Planning, Auditing
 
Auditing notes
Auditing notesAuditing notes
Auditing notes
 

Similar to Auto trader consumer survey report 2010

Media landscape updater 2011
Media landscape updater 2011Media landscape updater 2011
Media landscape updater 2011MediaDirectionOMD
 
Metso Interim Review January-September 2012 presentation
Metso Interim Review January-September 2012 presentationMetso Interim Review January-September 2012 presentation
Metso Interim Review January-September 2012 presentation
Metso Group
 
Scania Q3 2008
Scania Q3 2008Scania Q3 2008
Scania Q3 2008
earningsreport
 
KTK-AR2011-ENG
KTK-AR2011-ENGKTK-AR2011-ENG
KTK-AR2011-ENGKTK
 
CMC Analystmeet 2003 Q2
CMC Analystmeet 2003 Q2CMC Analystmeet 2003 Q2
CMC Analystmeet 2003 Q2finance21
 
scana Presentation%20Q3%202008_tcm10-219195
scana  Presentation%20Q3%202008_tcm10-219195scana  Presentation%20Q3%202008_tcm10-219195
scana Presentation%20Q3%202008_tcm10-219195finance50
 
Scania Presentation%20Q3%202008_tcm10-219195
Scania Presentation%20Q3%202008_tcm10-219195Scania Presentation%20Q3%202008_tcm10-219195
Scania Presentation%20Q3%202008_tcm10-219195finance50
 
Wermuth asset management investor trip, 20 октября 2010
Wermuth asset management investor trip, 20 октября 2010Wermuth asset management investor trip, 20 октября 2010
Wermuth asset management investor trip, 20 октября 2010evraz_company
 
Earnings release 3 q09 presentation
Earnings release 3 q09 presentationEarnings release 3 q09 presentation
Earnings release 3 q09 presentationBrasilEcodiesel
 
Q3 Presentation
Q3 PresentationQ3 Presentation
Q3 Presentation
Kjell Brataas
 
презентация для инвесторов, ноябрь 2010
презентация для инвесторов, ноябрь 2010презентация для инвесторов, ноябрь 2010
презентация для инвесторов, ноябрь 2010evraz_company
 
Dolores Torres, What is the Low-Bar and What is the High-Bar on Client Protec...
Dolores Torres, What is the Low-Bar and What is the High-Bar on Client Protec...Dolores Torres, What is the Low-Bar and What is the High-Bar on Client Protec...
Dolores Torres, What is the Low-Bar and What is the High-Bar on Client Protec...Microcredit Summit Campaign
 
Jmart : Opp day Dec 12, 2012
Jmart : Opp day  Dec 12, 2012Jmart : Opp day  Dec 12, 2012
Jmart : Opp day Dec 12, 2012TonHor Hor
 
Jmart JMT Oppday Q355
Jmart JMT Oppday Q355 Jmart JMT Oppday Q355
Jmart JMT Oppday Q355
Shaen PD
 
Challenges & Opportunities in Microfinance for Rural Banks in 2010
Challenges & Opportunities in Microfinance for Rural Banks in 2010Challenges & Opportunities in Microfinance for Rural Banks in 2010
Challenges & Opportunities in Microfinance for Rural Banks in 2010
John Owens
 
parker hannifin 2008 Annual
parker hannifin 2008 Annualparker hannifin 2008 Annual
parker hannifin 2008 Annualfinance25
 
Eduventures
EduventuresEduventures

Similar to Auto trader consumer survey report 2010 (20)

Media landscape updater 2011
Media landscape updater 2011Media landscape updater 2011
Media landscape updater 2011
 
Metso Interim Review January-September 2012 presentation
Metso Interim Review January-September 2012 presentationMetso Interim Review January-September 2012 presentation
Metso Interim Review January-September 2012 presentation
 
Scania Q3 2008
Scania Q3 2008Scania Q3 2008
Scania Q3 2008
 
KTK-AR2011-ENG
KTK-AR2011-ENGKTK-AR2011-ENG
KTK-AR2011-ENG
 
CMC Analystmeet 2003 Q2
CMC Analystmeet 2003 Q2CMC Analystmeet 2003 Q2
CMC Analystmeet 2003 Q2
 
scana Presentation%20Q3%202008_tcm10-219195
scana  Presentation%20Q3%202008_tcm10-219195scana  Presentation%20Q3%202008_tcm10-219195
scana Presentation%20Q3%202008_tcm10-219195
 
Scania Presentation%20Q3%202008_tcm10-219195
Scania Presentation%20Q3%202008_tcm10-219195Scania Presentation%20Q3%202008_tcm10-219195
Scania Presentation%20Q3%202008_tcm10-219195
 
2 q11
2 q112 q11
2 q11
 
Wermuth asset management investor trip, 20 октября 2010
Wermuth asset management investor trip, 20 октября 2010Wermuth asset management investor trip, 20 октября 2010
Wermuth asset management investor trip, 20 октября 2010
 
Earnings release 3 q09 presentation
Earnings release 3 q09 presentationEarnings release 3 q09 presentation
Earnings release 3 q09 presentation
 
Q3 Presentation
Q3 PresentationQ3 Presentation
Q3 Presentation
 
презентация для инвесторов, ноябрь 2010
презентация для инвесторов, ноябрь 2010презентация для инвесторов, ноябрь 2010
презентация для инвесторов, ноябрь 2010
 
Dolores Torres, What is the Low-Bar and What is the High-Bar on Client Protec...
Dolores Torres, What is the Low-Bar and What is the High-Bar on Client Protec...Dolores Torres, What is the Low-Bar and What is the High-Bar on Client Protec...
Dolores Torres, What is the Low-Bar and What is the High-Bar on Client Protec...
 
2Q11 Results Presentation
2Q11 Results Presentation2Q11 Results Presentation
2Q11 Results Presentation
 
Jmart : Opp day Dec 12, 2012
Jmart : Opp day  Dec 12, 2012Jmart : Opp day  Dec 12, 2012
Jmart : Opp day Dec 12, 2012
 
Jmart JMT Oppday Q355
Jmart JMT Oppday Q355 Jmart JMT Oppday Q355
Jmart JMT Oppday Q355
 
Apre 2 t09
Apre 2 t09Apre 2 t09
Apre 2 t09
 
Challenges & Opportunities in Microfinance for Rural Banks in 2010
Challenges & Opportunities in Microfinance for Rural Banks in 2010Challenges & Opportunities in Microfinance for Rural Banks in 2010
Challenges & Opportunities in Microfinance for Rural Banks in 2010
 
parker hannifin 2008 Annual
parker hannifin 2008 Annualparker hannifin 2008 Annual
parker hannifin 2008 Annual
 
Eduventures
EduventuresEduventures
Eduventures
 

Auto trader consumer survey report 2010

  • 1. Consumer Feedback on Key Questions Facing the Industry Tim Peake Commercial Director 29th September 2010
  • 2. Summary • Auto Trader collected key questions / concerns from dealers at the beginning of September 2010 • These questions were analysed and the top 15 were incorporated into a survey • The survey was placed on the Auto Trader Website • 5,000 consumers responded to the survey between 15th September to 25th September 2010 • The following slides summarise the answers from these consumers • The report is intended to help dealers understand how the market may change based on current consumer sentiment. It will hopefully drive some useful debates within your dealership. • If you have any further questions or would like further detail / discussions on some of the possible implications this report outlines, please contact Tim Peake: Research Audit & • Repository Update tim.peake@tradermedia.co.uk Email; • 2 Slide Phone: 01189 239 103
  • 3. Consumers confidence is stronger now than 12 months 700,000 more consumers seeking to change their car (based on Auto Trader 10m unique users) September 2009 September 2010 800,000 consumers 950,000 2.4 million 1.7 million consumers consumers consumers 6.4 million 7 million consumers consumers Research Audit & Repository Update Slide 3
  • 4. The impact of this improvement in confidence is not clearly feeding through into NCR forecasts for next year, with SMMT forecasting 2.5% decline New Car Registrations New Car Registrations 20 % Forecast by SMMT H1 – First Half of the Year 3,000,000 -2.5 % 1,400,000 1.2 % 5.1 % 2,500,000 1,296,486 1,200,000 1,267,299 1,247,479 1,241,921 2,439,718 2,404,007 2,344,864 1,108,662 1,000,000 2,000,000 2,131,795 2,069,000 2,018,000 1,994,999 924,955 1,968,000 800,000 1,500,000 600,000 400,000 1,000,000 200,000 500,000 0 H105 H106 H107 H107 H109 H110 0 2005 2006 2007 2008 2009 2010f 2011f 2012f It is likely that the second half of 2010 will be down Research Audit & year-on-year as it laps Scrappage Scheme impact. Repository Update Slide 4
  • 5. This may be partly explained by Consumers being confused about the impact of changes in VAT “Will the VAT increase in January 2011 affect your decision to buy a new/used car?” Research Audit & Repository Update Slide 5
  • 6. VAT confusion is leading to consumers bringing forward their purchase “How will the VAT increase affect your decision to buy a new/used car?”¹ (September 2010) Planning to buy new car Planning to buy used car Research Audit & Repository Update Slide 6
  • 7. VAT created a pull forward in demand in the German market when they increased VAT. VAT increased in Jan 2007, demand in Q4 2006 increased and subsequently NCR in the following year declined January 2007 VAT Increase in Germany (from 16% to 19%) created a dip in purchases post the tax increase day (Q1 down by 10% YoY, Q2 and Q3 -6% and Q4 -13% YoY). German New Car Registrations SIS Impact January 2007 VAT Increase Impact 45% 375,000 35% 275,000 25% 175,000 15% 75,000 5% -25,000 Jan-06 Mar-06 May-06 Nov-06 Jan-07 Mar-07 May-07 Nov-07 Jan-08 Mar-08 May-08 Nov-08 Jan-09 Mar-09 May-09 Nov-09 Jul-06 Sep-06 Jul-07 Sep-07 Jul-08 Sep-08 Jul-09 Sep-09 -5% -125,000 -15% -225,000 -25% Research Audit & New Car Registrations YoY % Repository Update Slide 7 Source: ACEA (equivalent SMMT in Europe)
  • 8. Having the right car at the right price is key to winning new business What are the 3 most important criteria when deciding to purchase? Research Audit & Repository Update Slide 8
  • 9. The Right Car….is more difficult to source given historic declines in NCR are leading to an aging car parc. Competition between dealer segments is increasing Franchise Stock Distribution on AutoTrader.co.uk Franchised Stock Distribution by Age March 2009 45% Franchised Stock Distribution by Age July 2009 Franchised Stock Distribution by Age March 2010 40% Franchised Stock Distribution by Age July 2010 40.5% 39.8% 39.2% 35% 35.6% 34.1% 30% 30.2% 28.0% 25% 23.9% 20% 20.3% 15% 15.5% 15.3% 15.2% 14.6% Research Audit & 12.5% Repository Update 10% Slide 9 5% 5.6% 5.1% 5.0% 4.4% 2.0% 1.8% 2.2% 2.0% 3.8% 3.5% 0% 0-1 YEARS 2-3 YEARS 4-5 YEARS 6-7 YEARS 8+ YEARS UNLISTED Source: Internal Data
  • 10. The Right Price…..majority of consumers are not prepared to pay a premium for buying from a franchise dealer Are you prepared to pay a premium from buying from a franchise dealer? 39% Yes 61% No Research Audit & Repository Update Slide 10
  • 11. The Right Price….there are regional differences in terms of what Consumers are prepared to pay as a premium from a franchise dealer Research Audit & Repository Update Slide 11
  • 12. The Right Price…..of the 39% that are prepared to pay a premium 75% are prepared to pay up to £299 and 25% are prepared to pay more than £299 More than £500 extra 10% An additional An additional £300 - £500 £0 - £99 16% 29% An additional £200 - £299 An additional 21% £100 - £199 25% Research Audit & Repository Update Slide 12
  • 13. However Franchise dealers price is £500+ more than Independents. As Franchise move into older age stock the price differential has been decreasing (last yr vs, this yr) Average Price of Car by Stock Band £16,000 July 2009 £14,000 £14,808 £14,556 £12,000 £12,467 £10,000 Franchised - Average Car Price July 2009 £10,787 £10,127 £8,000 £5,963 Independent - Average Car Price July 2009 £7,726 £6,000 £7,098 £6,504 £5,429 £4,000 Jul 2009 Fr-Ind Price Difference £4,763 £4,326 £3,348 £2,000 £0 -£252 £660 £628 £666 £977 -£2,000 0-1 YEARS 2-3 YEARS 4-5 YEARS 6-7 YEARS 8+ YEARS Average Price of Car by Stock Band £20,000 July 2010 £15,000 £16,111 £15,450 Research Audit & £12,787 Franchised - Average Car Price July 2010 £10,000 £11,598 Repository Update £10,806 £5,770 £9,060 Independent - Average Car Price July 2010 £8,291 Slide 13 £7,017 £5,000 £6,329 £5,630 £4,734 £3,681 July 2010 Fr-Ind Price Difference £0 -£661 £792 £769 £699 £1,053 0-1 YEARS 2-3 YEARS 4-5 YEARS 6-7 YEARS 8+ YEARS -£5,000
  • 14. Furthermore the majority of consumers are searching on a national basis and hence are exposed to “national prices”. Hence understanding price specifically is key. Furthermore communicating points of differentiation are even more important given price transparency (e.g. Trust, Reputation, other products / services). Search radius AT.co.uk Consumers who selected a radius when searching on AT.co.uk (i.e. did not default search to National) Research Audit & Repository Update Slide 14
  • 15. Pricing tools are going to become even more important. Market Tracker provides visibility of AT advertised price, CAP retail and CAP Trade prices and is updated daily (with AT prices) Price distribution for Ford Focus 1.6 Zetec 5 dr (climate pack) 07 Plate Research Audit & Repository Update Slide 15
  • 16. An example of innovation in products and services to build trust is Guaranteed Buy Back. Of the 17% of consumers who were not planning to buy a car in the next 12 months, 58% could change their mind if a dealer guaranteed to buy back their car. Hence using products to build Trust can pull in more consumers “If a dealer guaranteed to buy back your car for an agreed price in the future, would this influence your decision to purchase?” 287,000 consumers 721,000 consumers 691,000 consumers Research Audit & Repository Update Slide 16
  • 17. The majority of Consumers visit between 2-3 dealerships when making a purchase decision 9% of consumers will not visit a dealership, suggesting they buy from Friends, family or get someone else to conclude the transaction (could also be online opportunity) Research Audit & Repository Update Slide 17
  • 18. Consumers, when choosing a dealership value reputation, trust and knowledgeable sales staff (enhances trust) Pushing manufacturer brands would allow Franchise to win in their segment (1-3 yr old cars), whilst Independents can price competitively in older age vehicles “What is the most important quality you look for in a dealership?” Research Audit & Repository Update Slide 18
  • 19. Consumers are agnostic to dealer brands - 65% outlined the dealer brand is unimportant Does dealer branding influence which dealership you buy from? Research Audit & Repository Update Slide 19 Source: 1. Top 10 Dealer Concerns Survey launched on autotrader.co.uk September 2010
  • 20. Franchise and Independent need to focus on what differentiates them to win different types of consumers in the next 12 months Franchise • Price premium achievement is more likely if messaging is based on: • Trust – manufacturer brand vs. dealer brand vs group – be clear on the value of these • Reputation – consumer user reviews • Additional Products – buy back for guaranteed price, increases consumer demand and demand that can be fulfilled via franchise dealers • Knowledgeable sales staff • What justifies the premium (warranty, checks, approved used schemes) • After sales service • Consistent brand messages • Pricing tools critical • Independent • Priced competitively, acknowledging national price transparency • Pricing tools critical • Trust, knowledgeable sales staff just as important (£425 spent on used cars after purchase to rectify Research Audit & problems) Repository Update Slide 20 • Ageing car parc, similarities in stock profile make the importance of these points of differentiation critical in the next 12 months
  • 21. Creating trust through your website Research Audit & Repository Update Slide 21
  • 22. Communicating trust via online stock advertising Research Audit & Repository Update Slide 22
  • 23. Doing the basics well Research Audit & Repository Update Slide 23
  • 24. 33% of consumers are already prepared to order their new car (used and new) online….that’s potentially 3.3m transactions “Would you like to be able to order your new car online?” 3.3 million consumers 6.3 million consumers Research Audit & Repository Update Slide 24 Do sales staff seek to close the transaction on the phone or do they try and encourage the consumer into the show room?
  • 25. There are regional differences, with 38% of consumers in London and the South East most likely to order a vehicle online “Would you like to be able to order your new car online?” Research Audit & Repository Update Slide 25
  • 26. 27% of Consumers are willing to purchase their car online “Would you consider buying a used car that you have seen online without physically seeing it?” Research Audit & Repository Update Slide 26 How would this position change if Dealer branding focused on Trust?
  • 27. Maximising the opportunity in the next 12 months There is potentially a large appetite to begin transacting online The assets required to unlock the opportunity are: Right car, right price (or justification of the right price) Reputation, Trust , knowledgeable sales staff These are the same attributes that consumers value when choosing a dealership offline However consumers do not associate these assets with specific dealer brands Hence the majority are not prepared (or do not necessarily see the benefit) to pay a premium from a franchise dealer (or pay more from one franchise dealer Research Audit & thanRepository Update another) Slide 27
  • 28. Maximising the opportunity in the next 12 months However Trust is built through clear brand messaging (manufacturer brands, groups, dealers - what role should each play?) Investment in optimising online advertising is key Doing the basics well (photos, clear messaging, brand values) Communicate trust on everything you do - all your advertising Don’t be afraid of user reviews, consumers are more generous than you think Re-align your thinking on brand Focus on evolution of products – e.g. guarantee buy-back, builds trust Fundamentally the market has already changed The key is to unlock the opportunity by changing the business model to benefit from the new landscape Research Audit & Repository Update Slide 28