Pollution Probe is a non-profit organization focused on environmental issues like air and water pollution. This document discusses a primer produced by Pollution Probe on automobile fuel efficiency and emissions. The primer was produced in partnership with the Canadian Automobile Association and aims to educate the public on how industry, government, and individuals can reduce fuel consumption and vehicle emissions. It provides an overview of technologies and policies that can help address the environmental impacts of the transportation sector.

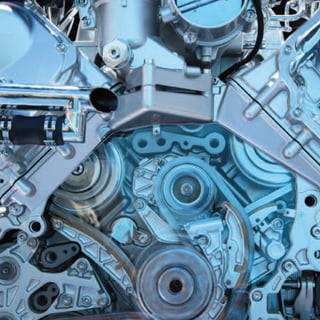
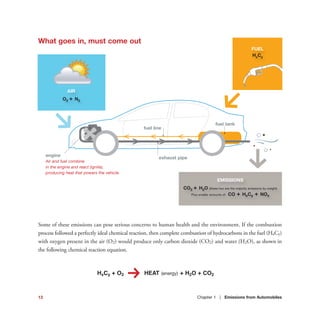
![In the real world, however, combustion is neither a complete nor a perfect process; therefore, the products in the
engine exhaust also contain some unburned fuel. Emissions of unburned fuel are also classified as Volatile Organic
Compounds (VOCs) – “volatile” because they easily and quickly evaporate into the air.1
In addition, there is also a
degree of incomplete or partial combustion of hydrocarbons, which results in emissions of carbon monoxide (CO).
The combustion process occurs under conditions of high heat and pressure, which causes nitrogen in the air
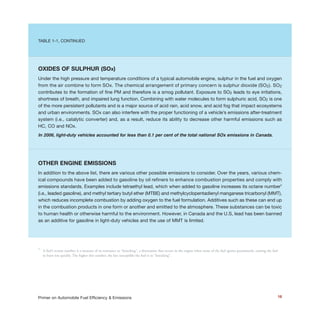
to bond with oxygen and form Oxides of Nitrogen (NOx). The sulphur in fuel also bonds with oxygen to form
Oxides of Sulphur (SOx - under some conditions, the sulphur can also bond with hydrogen to produce a small
amount of hydrogen sulphide, H2S). In addition to these chemical compounds, automobile engines also emit
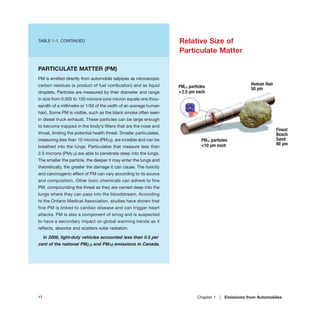
varying amounts of Particulate Matter (PM), which can include microscopic liquid droplets and particles of soot
produced during combustion. Thus, the “real” chemical equation of combustion in the engine looks more like this:
[HxCy + S]FUEL + [O2 + N2]AIR
k HEATENERGY TO POWER ENGINES +
[H20 + CO2 + CO + VOCs(HxCy) + NOx + SOx + PM] EMISSIONS
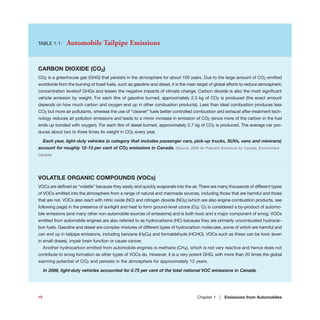
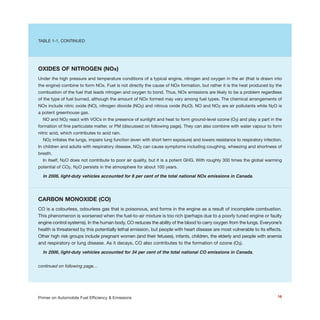
On the following page, Table 1-1 summarizes the characteristics of the major pollutants associated with auto-
mobile use.
1
The terms Volatile Organic Compounds and Hydrocarbons are often used interchangeably in automotive emissions literature.
14Primer on Automobile Fuel Efficiency & Emissions](https://image.slidesharecdn.com/4e062adc-4c54-413a-aaca-78f93096de38-160403185448/85/Auto-Primer-15-320.jpg)