Download as PDF, PPTX

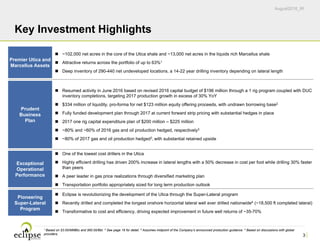
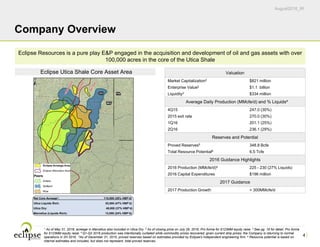
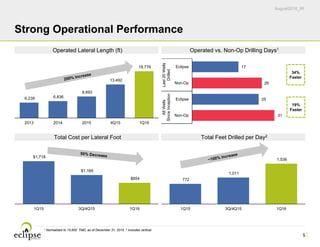
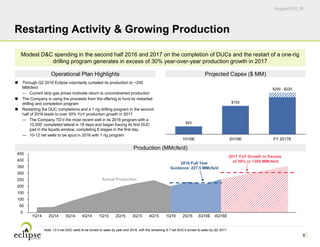
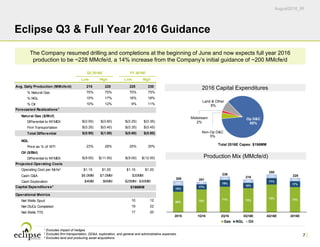
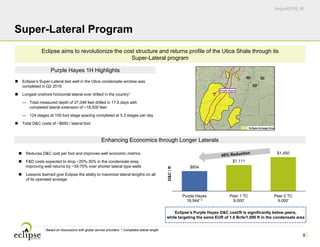
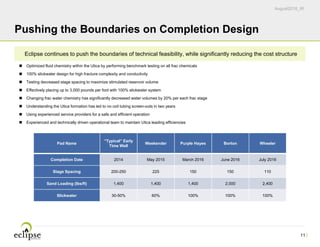
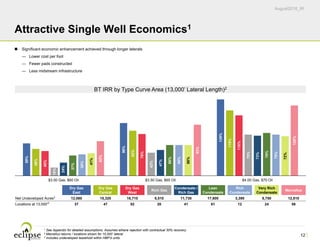
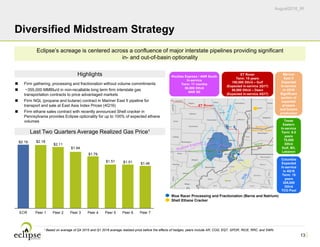
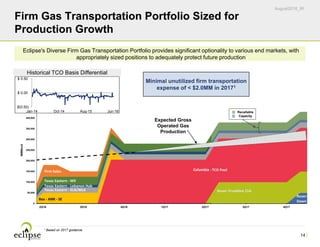
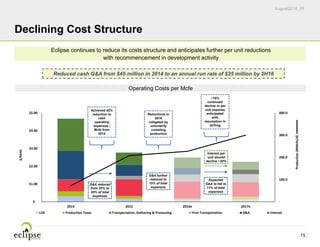
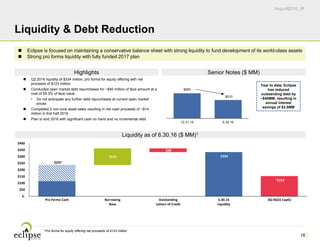
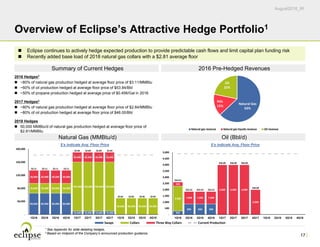

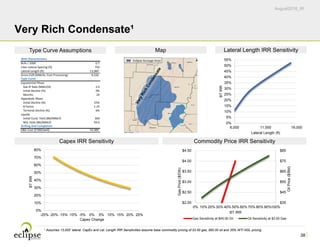
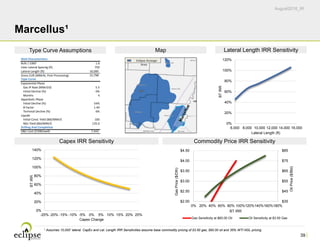

Eclipse Resources is an oil and gas company focused on developing its 115,000 net acres in the core of the Utica Shale and 13,000 net acres in the Marcellus Shale. The presentation highlights Eclipse's strong operational performance, including increasing lateral lengths by 200% while decreasing drilling costs by 50% per foot. Eclipse plans to resume drilling activities in mid-2016 and grow production over 30% year-over-year in 2017 through completing DUCs and operating a one-rig program. The company also discusses its super-lateral drilling program aimed to significantly improve well returns through extending lateral lengths.


