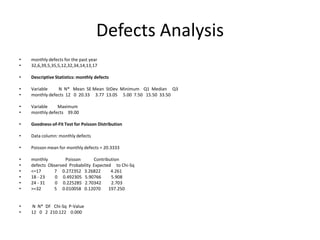
ATM Improvement Project

  Andrew Phillips, MBA, SSMBB
Project Charter
• To find ways to improve the development and
  release of XFS base software.
• To measure the cost of poor quality ATM
  software.
• To measure, analysis, improve and control the
  delivery and implementation of ATM software.
Cost of poor quality
• A recent study of 4 defects for one of our major
  customers showed that to correct these defects was 3
  millions dollars for an average of $750,000 per defect.
• At a average of a little over 20 defects per month.
  These defects for this one customer cost a total of 183
  million dollars. Even if you calculate that the cost for
  these defects is highly skewed by 80% the cost for this
  one customer is still 36.6 million dollars. This
  customer represents. About 20% of ATM in the US so
  we are looking at a total cost of over 183 million dollars
  per year.
Current Process
Defects Analysis
•   monthly defects for the past year
•   32,6,39,5,35,5,12,32,34,14,13,17

•   Descriptive Statistics: monthly defects

•   Variable    N N* Mean SE Mean StDev Minimum Q1 Median Q3
•   monthly defects 12 0 20.33 3.77 13.05 5.00 7.50 15.50 33.50

•   Variable    Maximum
•   monthly defects 39.00

•   Goodness-of-Fit Test for Poisson Distribution

•   Data column: monthly defects

•   Poisson mean for monthly defects = 20.3333

•   monthly        Poisson       Contribution
•   defects Observed Probability Expected to Chi-Sq
•   <=17      7 0.272352 3.26822         4.261
•   18 - 23    0 0.492305 5.90766        5.908
•   24 - 31    0 0.225285 2.70342        2.703
•   >=32      5 0.010058 0.12070        197.250


•   N N* DF Chi-Sq P-Value
•   12 0 2 210.122 0.000
Control Charts
Analysis of Data
• Chi-Squared test shows the expected data
  does not fit the observe data. This means that
  even though the control chart shows a process
  in control it is not in control.
• Goal is to reduce defects by 75%. Reduce the
  average defects by an average of 20 to an
  average of 5
• This will save $137,250,00 per year.
Improve Process
• Increase a system test on top 20% of integration
  system before base software is released. This should
  reduce defects by 50%. We can pass this cost on to the
  customer by reducing the trips to ATM and downtime.
• Increase communication by users and developers by
  having user groups 3-4 times a year. This should
  reduce defects 10%
• Conduct a monthly defect meeting. XFS developers
  and integrators can communicate fixes. This can be a
  SharePoint site. This should reduce defects by 15%.
New Process
Total Annual Savings


Total cost of defects                  $183,000,000.00

Total savings                          $137,250,000.00


Cost of defects after changes           $45,750,000.00

Cost on changes                           2,500,000.00


Total Annual savings                   $134,750,000.00

Atm improvement project

  • 1.
    ATM Improvement Project Andrew Phillips, MBA, SSMBB
  • 2.
    Project Charter • Tofind ways to improve the development and release of XFS base software. • To measure the cost of poor quality ATM software. • To measure, analysis, improve and control the delivery and implementation of ATM software.
  • 3.
    Cost of poorquality • A recent study of 4 defects for one of our major customers showed that to correct these defects was 3 millions dollars for an average of $750,000 per defect. • At a average of a little over 20 defects per month. These defects for this one customer cost a total of 183 million dollars. Even if you calculate that the cost for these defects is highly skewed by 80% the cost for this one customer is still 36.6 million dollars. This customer represents. About 20% of ATM in the US so we are looking at a total cost of over 183 million dollars per year.
  • 4.
  • 5.
    Defects Analysis • monthly defects for the past year • 32,6,39,5,35,5,12,32,34,14,13,17 • Descriptive Statistics: monthly defects • Variable N N* Mean SE Mean StDev Minimum Q1 Median Q3 • monthly defects 12 0 20.33 3.77 13.05 5.00 7.50 15.50 33.50 • Variable Maximum • monthly defects 39.00 • Goodness-of-Fit Test for Poisson Distribution • Data column: monthly defects • Poisson mean for monthly defects = 20.3333 • monthly Poisson Contribution • defects Observed Probability Expected to Chi-Sq • <=17 7 0.272352 3.26822 4.261 • 18 - 23 0 0.492305 5.90766 5.908 • 24 - 31 0 0.225285 2.70342 2.703 • >=32 5 0.010058 0.12070 197.250 • N N* DF Chi-Sq P-Value • 12 0 2 210.122 0.000
  • 6.
  • 7.
    Analysis of Data •Chi-Squared test shows the expected data does not fit the observe data. This means that even though the control chart shows a process in control it is not in control. • Goal is to reduce defects by 75%. Reduce the average defects by an average of 20 to an average of 5 • This will save $137,250,00 per year.
  • 8.
    Improve Process • Increasea system test on top 20% of integration system before base software is released. This should reduce defects by 50%. We can pass this cost on to the customer by reducing the trips to ATM and downtime. • Increase communication by users and developers by having user groups 3-4 times a year. This should reduce defects 10% • Conduct a monthly defect meeting. XFS developers and integrators can communicate fixes. This can be a SharePoint site. This should reduce defects by 15%.
  • 9.
  • 10.
    Total Annual Savings Totalcost of defects $183,000,000.00 Total savings $137,250,000.00 Cost of defects after changes $45,750,000.00 Cost on changes 2,500,000.00 Total Annual savings $134,750,000.00