The document introduces various severity of illness scoring systems used in intensive care units (ICUs) to evaluate the delivery of care and predict outcomes for critically ill patients. It categorizes these systems into anatomical, therapeutic weighted, organ-specific, physiological assessments, and disease-specific classifications, highlighting the most widely used scores like Apache, SAPS, and SOFA. Additionally, it discusses the features of an ideal scoring system, the history of the Apache scoring systems, and their implications in predicting mortality and patient management.

![Classification of Scoring Systems
► Anatomical scores: depend on the anatomical area involved.
Mainly used for trauma patients [e.g. abbreviated injury score (AIS) &
injury severity score (ISS)].
► Therapeutic weighted scores: based on the assumption that
very ill patients require more complex interventions & procedures than
patients who are less ill e.g., the therapeutic intervention scoring
system (TISS).
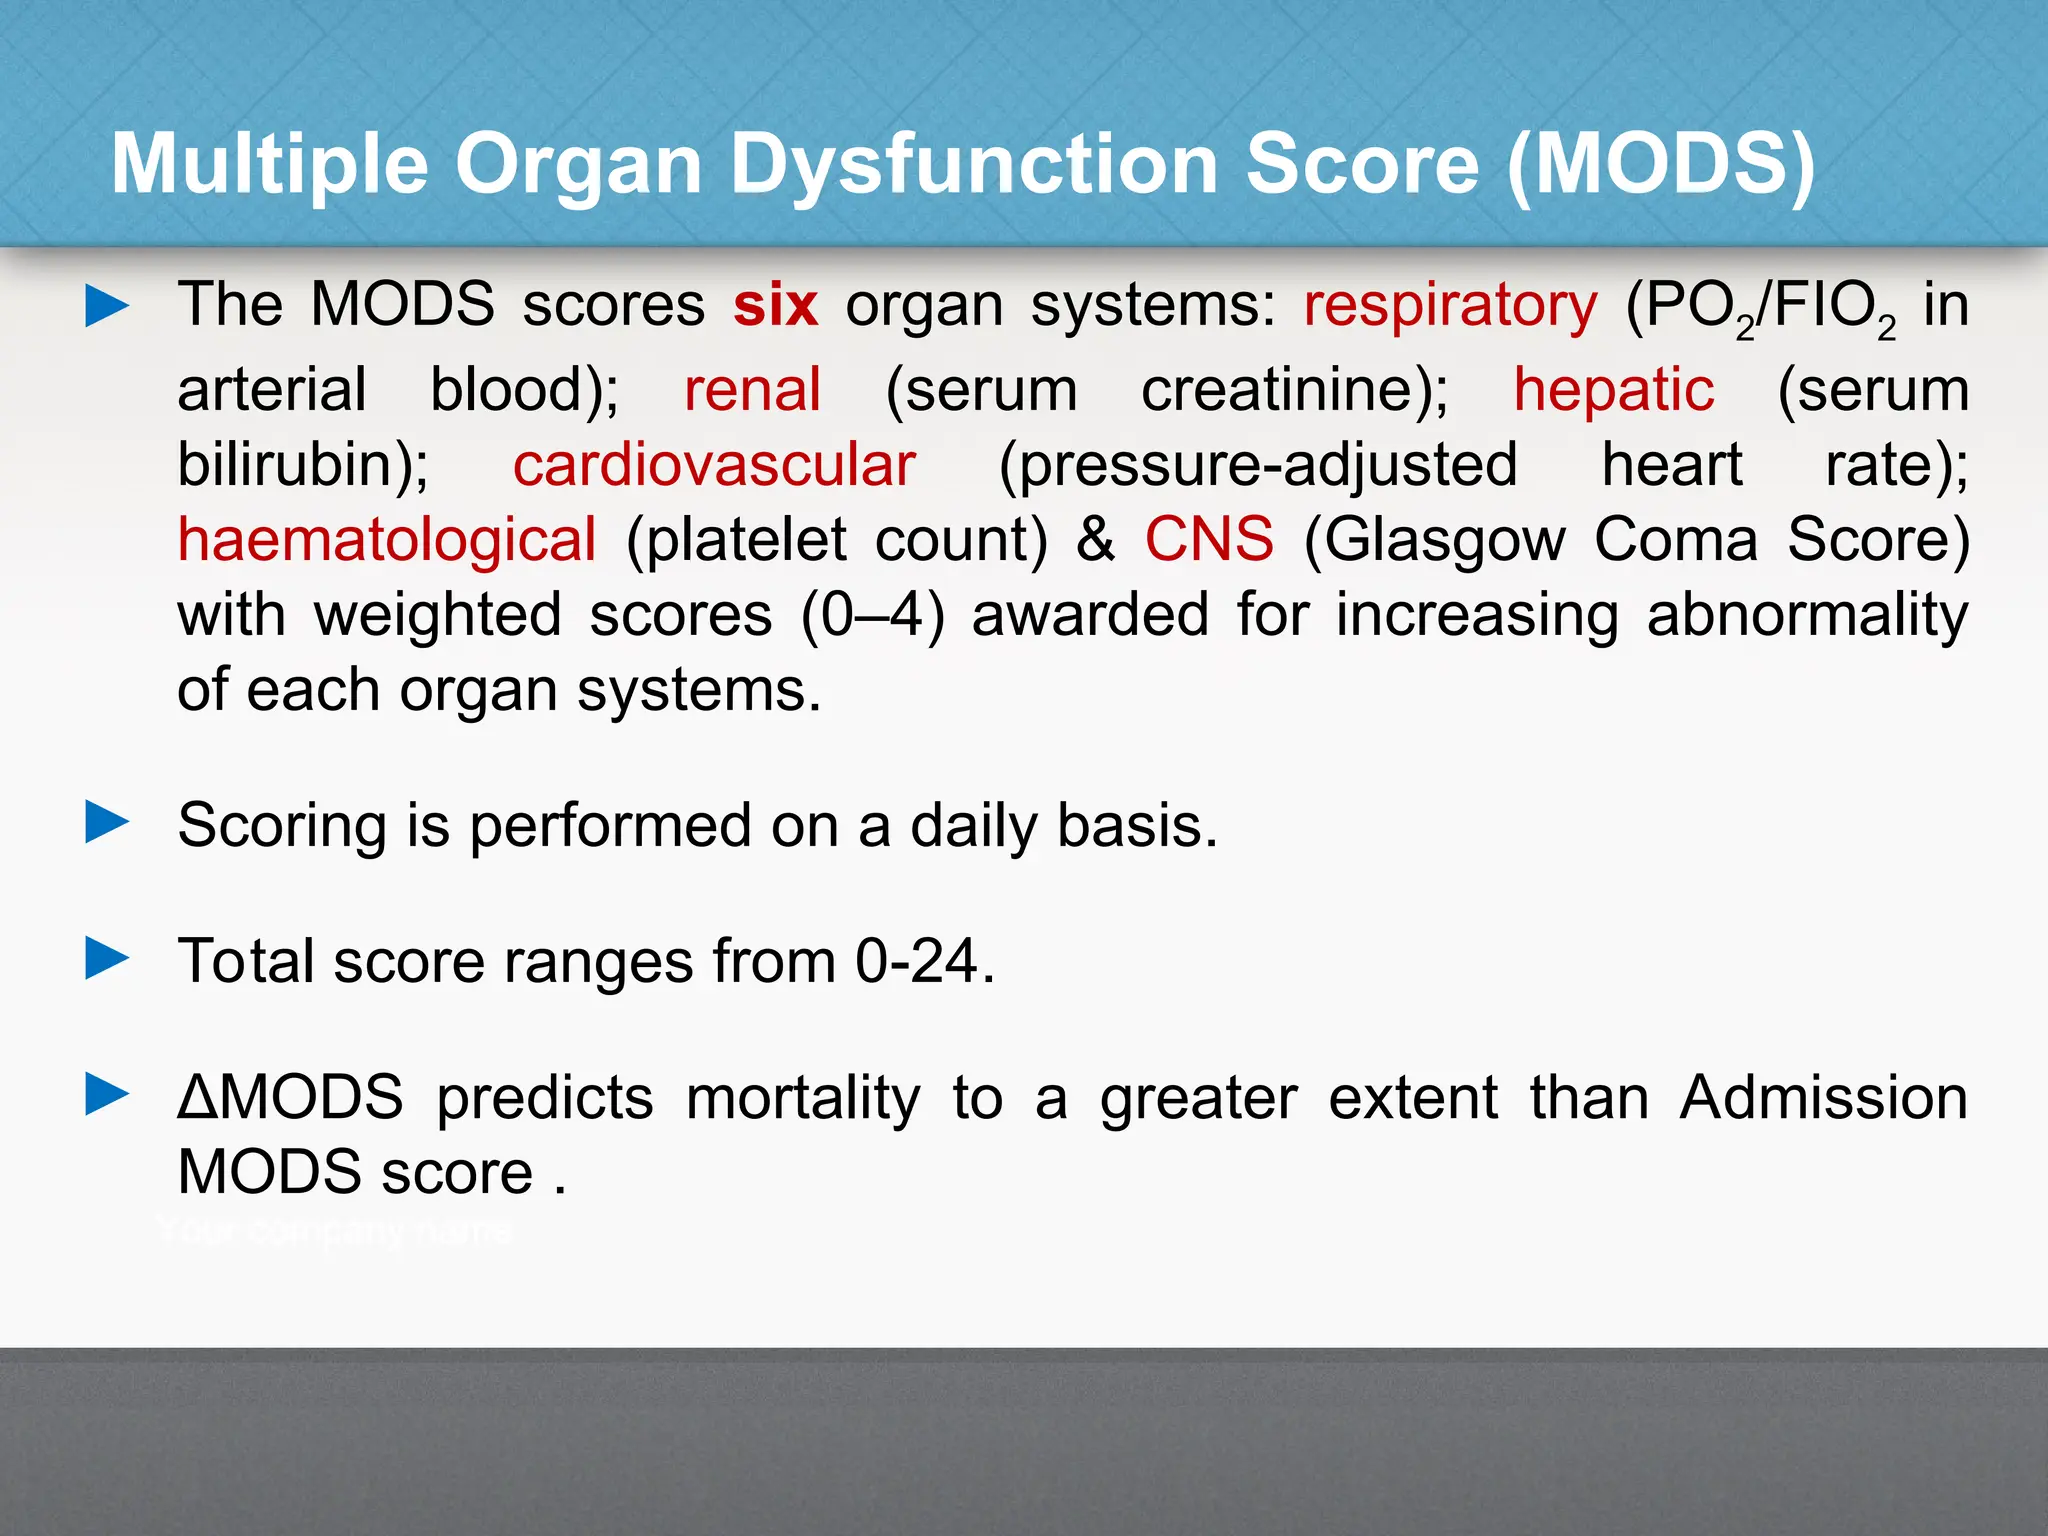
► Organ-specific score: similar to therapeutic scoring; the sicker a
patient the more organ systems will be involved, ranging from organ
dysfunction to failure [e.g. sequential organ failure assessment
(SOFA)].](https://image.slidesharecdn.com/icuscoringsystems-241025160835-0447ca13/75/At-present-Modern-icu-scoring-systems-ppt-4-2048.jpg)
![Classification of Scoring Systems
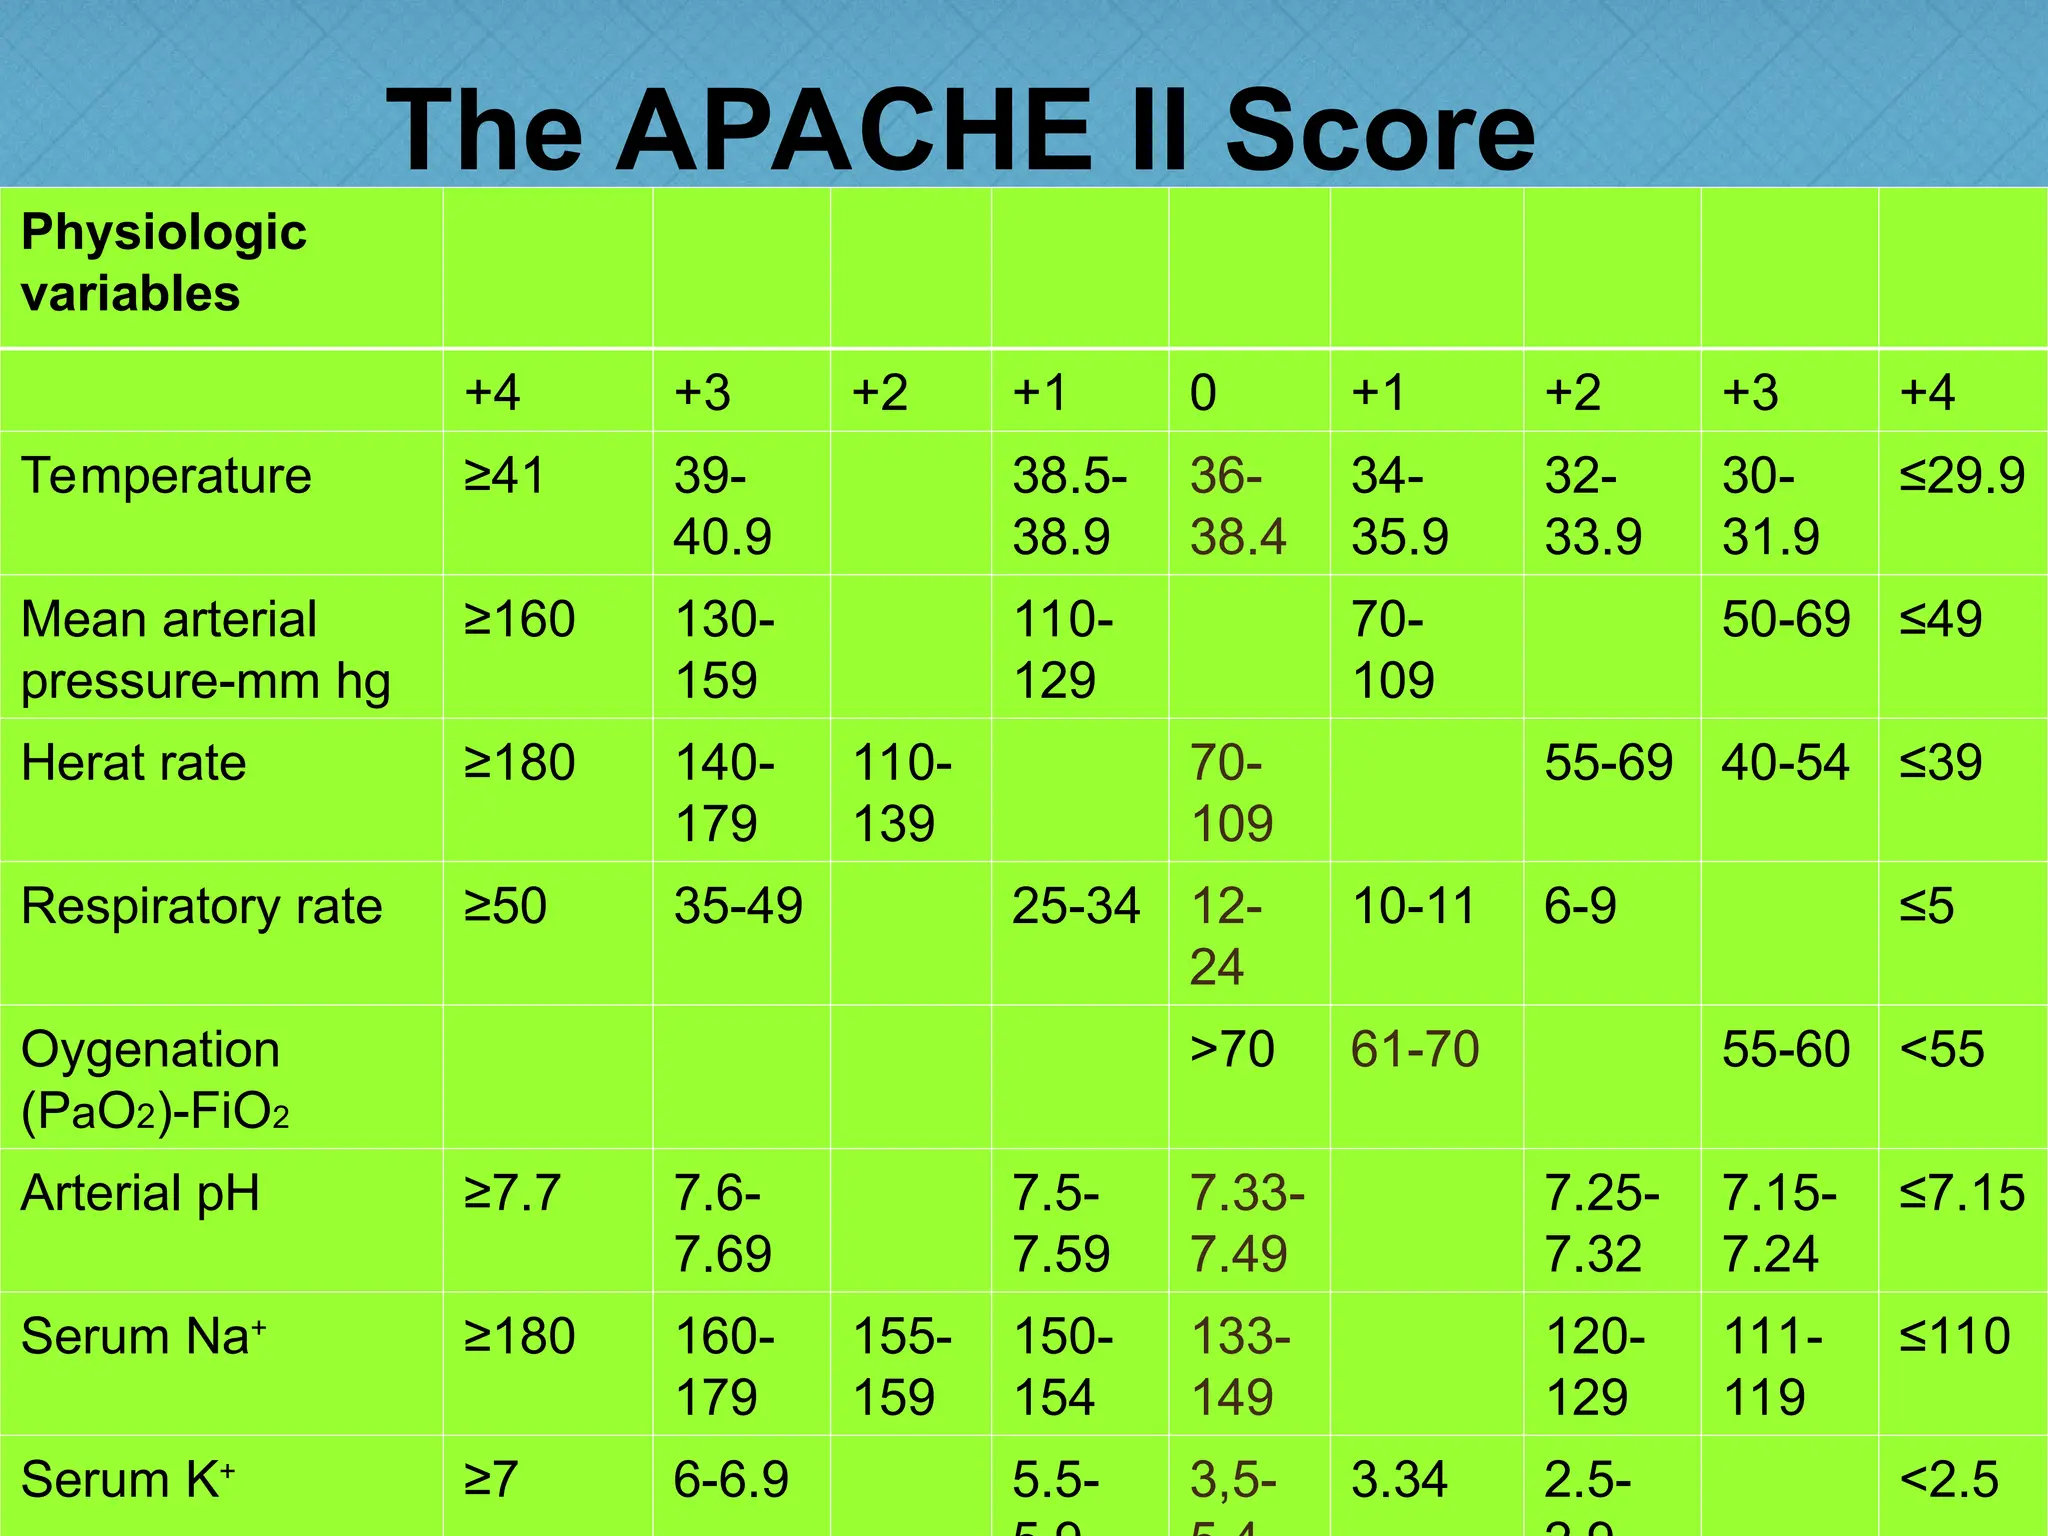
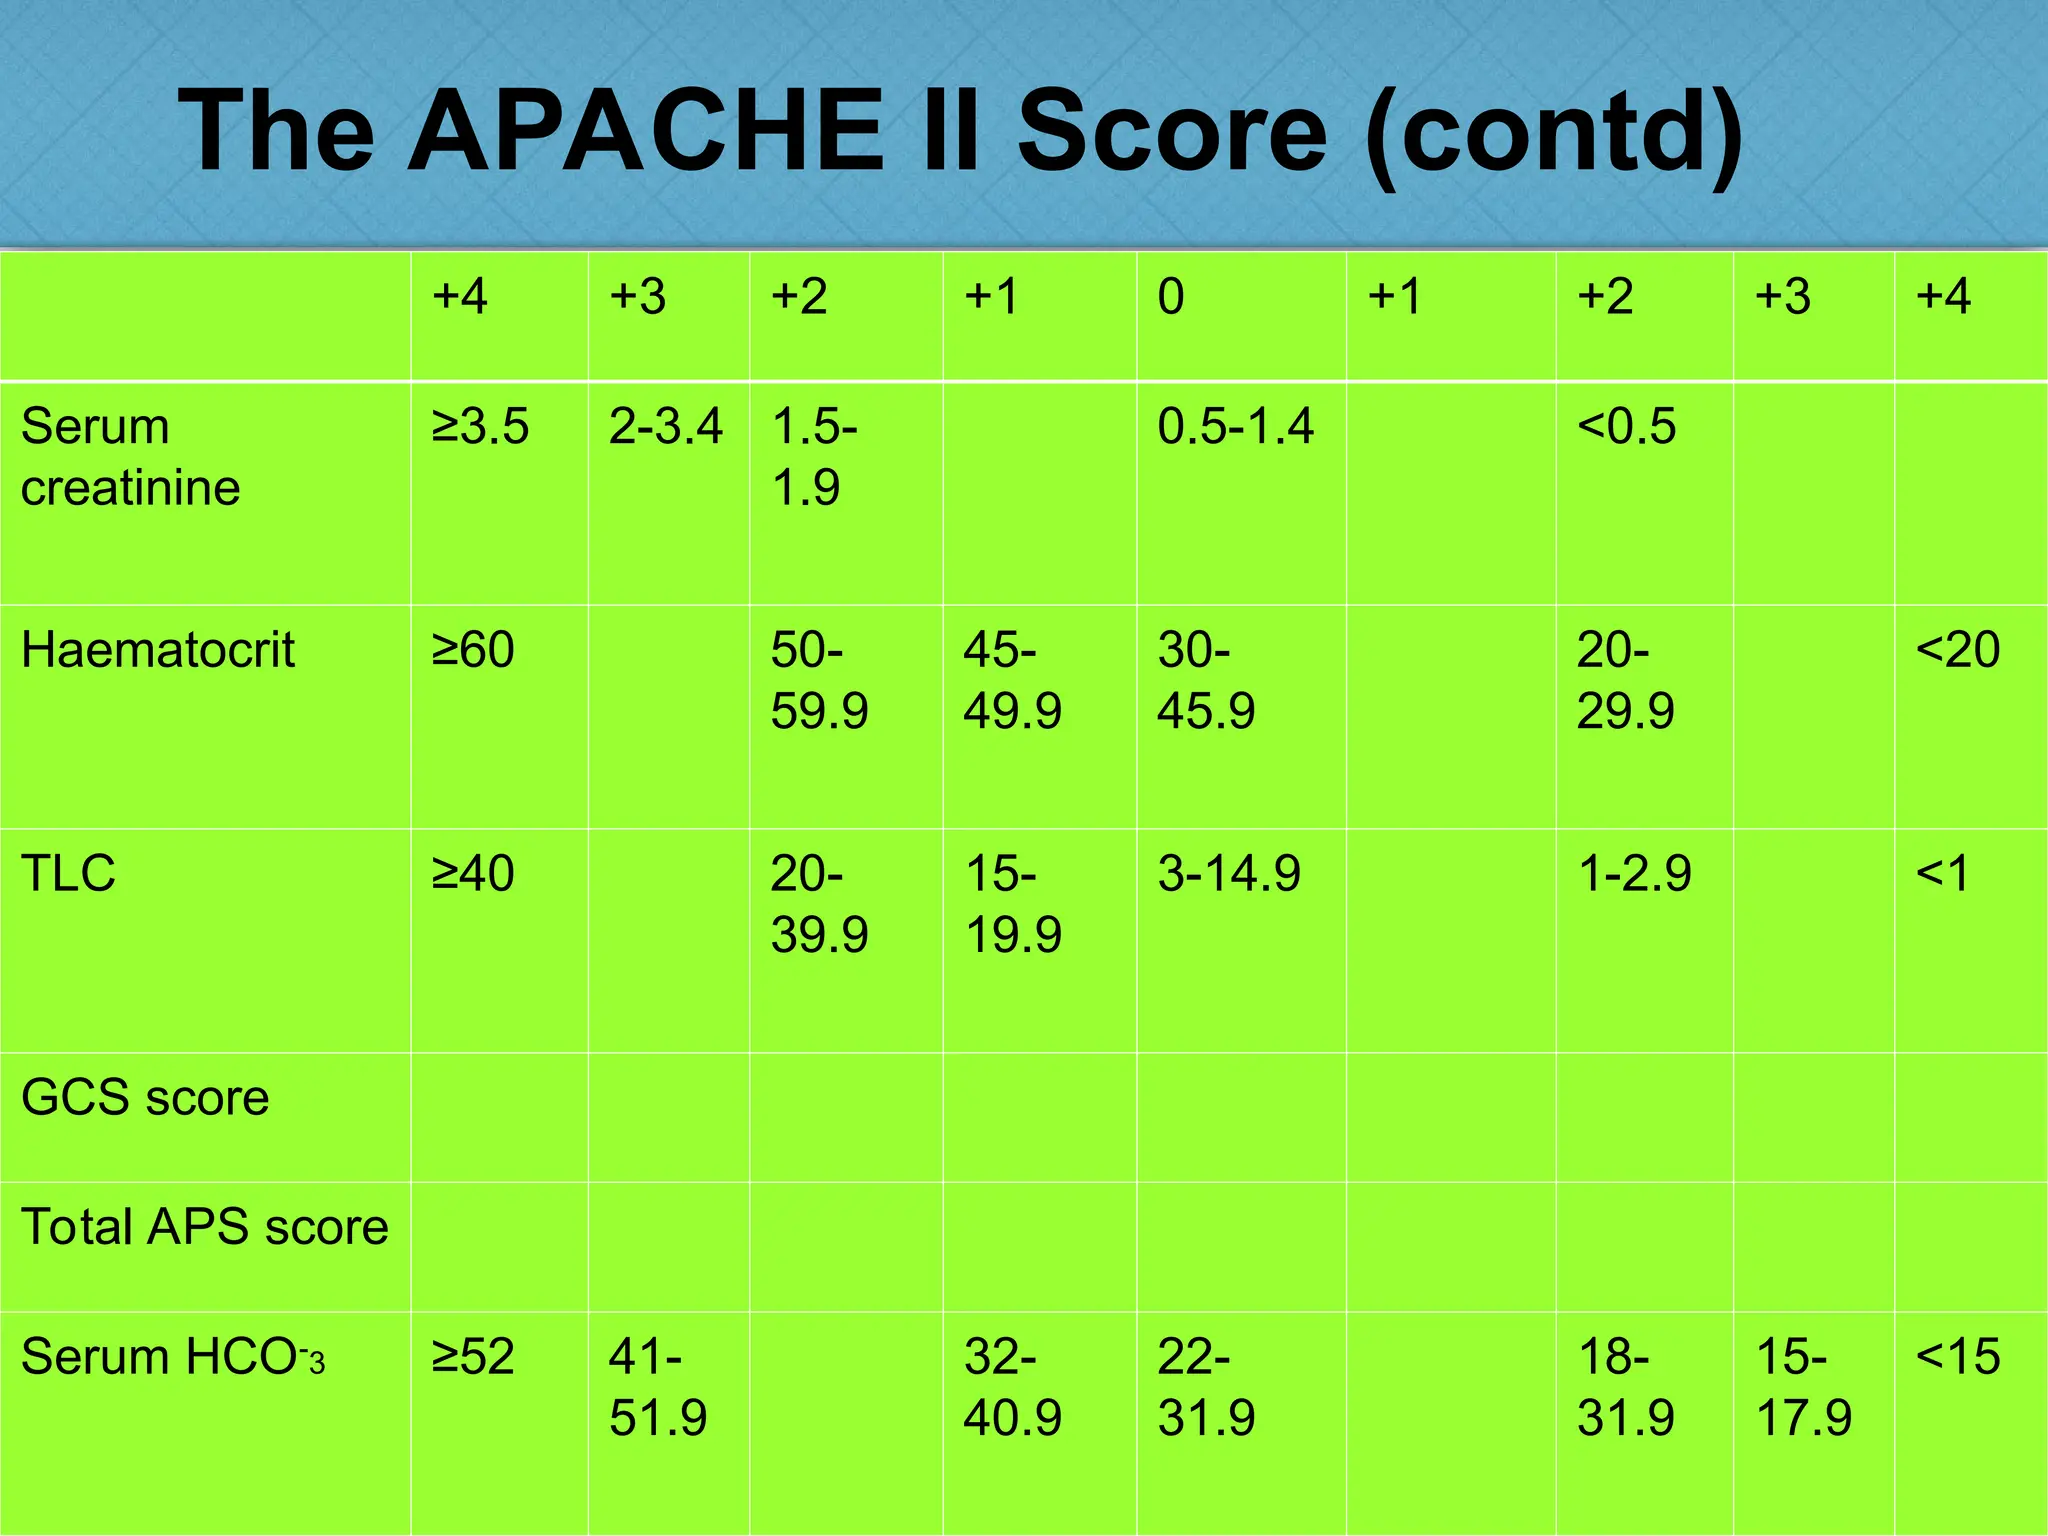
► Physiological assessment: based on the degree of
derangement of routinely measured physiological variables [e.g.
acute physiology and chronic health evaluation (APACHE) &
simplified acute physiology score (SAPS)].
► Simple scales: based on clinical judgment (e.g. survive or die).
► Disease specific: [e.g. Ranson’s criteria for acute pancreatitis,
subarachnoid haemorrhage assessment using the World Federation
of Neurosurgeons score & liver failure assessment using Child-Pugh
or model for endstage liver disease (MELD) scoring].](https://image.slidesharecdn.com/icuscoringsystems-241025160835-0447ca13/75/At-present-Modern-icu-scoring-systems-ppt-5-2048.jpg)