Download to read offline


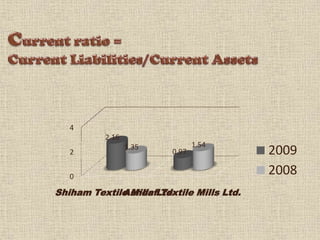
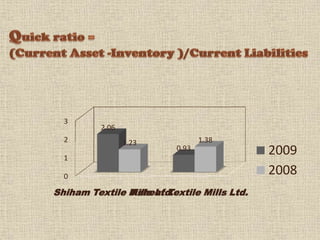
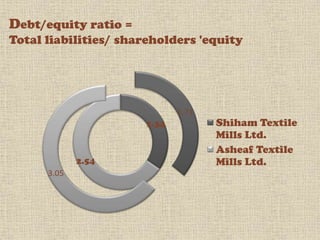
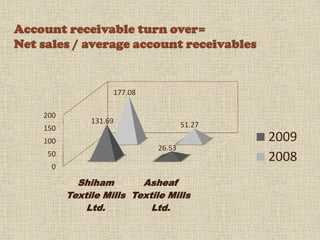
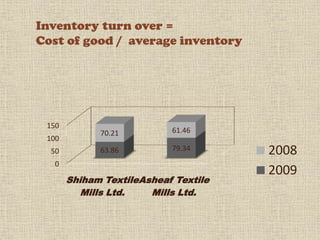
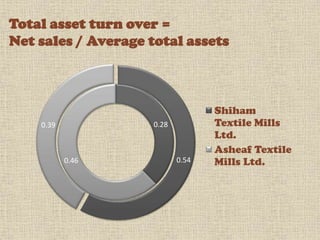
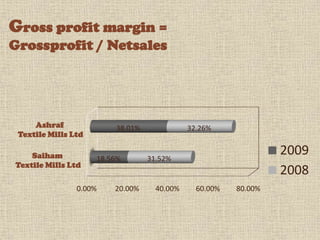
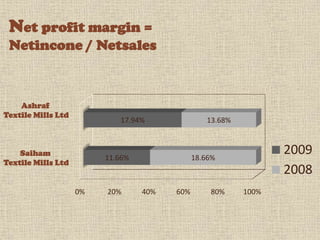
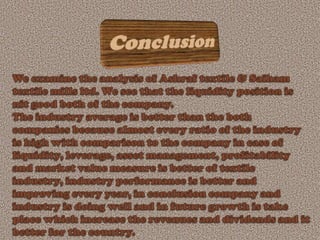
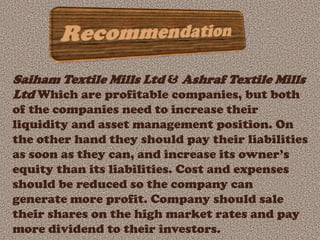


This document compares financial ratios for Ashraf Textile & Saiham Textile Mills Ltd over 2008-2009. It analyzes ratios such as debt/equity, account receivable turnover, inventory turnover, total asset turnover, gross profit margin, and net profit margin. Both companies are profitable but need to improve liquidity, asset management, and reduce costs to generate more profit. They should also pay down liabilities, increase equity, sell shares at high prices, and pay more dividends to investors.


