Foliar application of seaweed extracts as a means for enhancing the yield and...
Asmaa sabrey
1. Genetic Improvement through Selection of Different Stevia rebaudiana
Genotypes
Nader R. Abdelsalam1, Asmaa S. M. Haraz2
, Haraz, Ahmed E.Khalid1
, Magdy S. H.Saleh2
,
Ahmed E. A.Elsheikh2
1Agricultural Botany Department, Faculty of Agriculture Saba-Bacha,
Alexandria University, 22 Tag El-Roasa St. Saba Pacha,
Boulkly P.O. Box: 21531.
2
Breeding and Genetic Department, Sugar Crops
Institute, Agricultural Research Center
(corresponding author: nader.wheat@yahoo.com)
Received February 14, 2016, Accepted February28, 2016
ABSTRACT
The present investigation was carried out at Faculty of
Agriculture Saba Basha, Alexandria University and
Sabahia Agricultural Research Station during two
succesive seasons 2013-2014 and 2014-2015 from nature
population of Stevia (Stevia rebaudiana Bertoni) in order to
study the genetic improvement through selection for
different Stevia genotypes. Ninteen stevia accessions were
collected from healthy plants of nature population and
selected randomly. The data showed high significant
variations between all tested genotypes and there is high
genetic diversity between these genotypes and this might
be, due to the open pollination for these genotypes for
several years and theses genotypes could used in the future
in breeding programme. Also, it can conculad that the
difference in rebaudioside A due to the difference in the
genetic and the negatively correlation between stevioside
and rebaudioside-A. can be partially explained by the
biosynthetic relationships between the individual
glycosides because stevioside is the substrate for the
synthesis of rebaudioside A.
Key words: Stevia rebaudiana, selection, HPLC,
RAPD-PCR
INTRODUCTION
Stevia rebaudiana Berttoni is a genus of about 200
species of herbs and shrubs in the sunflower family
(Asteraceae), the most valuable tropical medicinal plant,
It’s a natural sweet ner herb native of northeastern
Paraguay and today it is cultivated around the world
(Savita et al., 2004). Stevia is diploid plant, having 11
pairs of chromosome (Frederico et al., 1996) with
critical day length of 13 hours (Zaidan et al., 1980).
Stevia rebaudiana Berttoni grows up to 1 m tall (Mishra
et al., 2010). The plant is a perennial herb with an
extensive root system and brittle stems producing small,
elliptic leaves. Medicinal plants are of great importance
to the health of individuals and communities. The
medicinal value of these plants comes from its chemical
substances that produce a definite physiological action
on the human body.Alkaloids, tannins and polyphenols
are important bioactive constituents of Stevia (Edeoga
et al., 2005).
S. rebaudiana (commonly referred to as honey leaf,
candy leaf and sweet leaf) is rich in terpenes and
flavonoids.The basic raw material for the production of
stevioside is the leaves of the stevia plant.The leaves of
stevia naturally contain a mixture of 8 sweet diterpene
glycosides: C, D stevioside, steviolbioside,
rebaudiosides (A, B, and E) and dulcoside A (Geuns,
2003). Stevioside, one of the Stevia glycosides, is about
300 times sweeter than saccharoseit is present with an
average of 4-20% in the dry matter of the plant leaves,
which primarily depends on cultivar characteristics of
plants and basic agricultural techniques (Geuns 2000)
and can be particularly beneficial to those suffering
from obesity, diabetes mellitus, heart disease and dental
caries (Ghanta et al., 2007). Dry leaves of stevia are
sweeter approximately 10 to 15 times than sucrose
(Raymond, 2009) while glycemic index is zero, so it is
sweetener with no caloric value (Kroyer, 2010; Seema,
2010; Puri et al., 2011) and with proven non-toxic
effect on human health (Barriocanal et al., 2008).
The leaves of stevia are used as a food additive and
a sweetener in food products, a green powder obtained
by grinding of dried green leaves (Mishra et al., 2010),
a white powder obtained by depigmentation process of
green powder (Brandle et al., 1992) and a solution
obtained by different extraction methods of stevioside
and rebaudioside A from green powder (Abou-Arab et
al., 2010). Stevia leaf extract shows high level of
antioxidant activity, as well as, the variety of
phytochemicals such as phenolic compounds, which is
directly associated with the removal of free electrons
and superoxide radicals (Thomas and Glade, 2010;
Benzie and Watchel-Galor, 2011). Therefore, stevia
plant has significant potential for use as a natural
antioxidant (Shukla et al., 2009; Ahmad et al., 2010;
Kim et al., 2011). In recent years, stevia products find
widespread use in the food industry (Savita et al., 2004;
Midmore and Rank, 2006). Steviol glycosides are used
as a sweetener in many industrial foods, such as soft
drinks or fruit juices (Goyal et al., 2010), desserts,
sauces, delicacies, sweet corn, bread, biscuits and a
2. Nader R. Abdelsalam, et al.,: Genetic Improvement through Selection of Different Stevia rebaudiana Genotypes 11
table sweetener. Stevia diterpene replace sucrose in:
cereals (muesli), pickles, yoghurt (Amzad-Hossain et
al., 2010), candy (Goyal et al., 2010), soybeans and soy
sauce (Amzad-Hossain et al., 2010) and seafood (Goyal
et al., 2010).
Randomly amplified polymorphic DNA (RAPD)
analysis is a polymerase chain reaction (PCR) based on
procedure of (Williams et al. 1990). RAPD markers are
usually dominant, with polymorphisms between
individual plants indicated by the presence or absence
of a particular rapd fragment. RAPDs have widely been
used for map construction and linkage analysis because
of their simplicity and relatively low cost (Reiter et al.
1992). As part of laying the foundation for molecular
breeding, RAPD markers used to study the genetic
polymorphic aiming to construct a genetic map of the
stevia genome (Banerjee et al., 1999). Thiyagarajan and
Venkatachalam (2015) reported that the genomic DNA
polymorphism and phytochemical variation of Stevia
rebaudiana Bertoniwas investigated by RAPD-PCR for
initial PCR screening, about hundredoligo-nucleotide
primers were used to amplify the genomic DNA from
three accessions of S. rebaudiana (L1 to L3).
HPLC used to analyze stevioside extracted from the
leaf and callus of Stevia rebaudiana Mahmud et al.
(2014). The stevioside in each sample were analyzed by
comparing their retention times with those of the
standards. They maintained that the retention time (RT)
of stevioside for leaves was found 14.96 and for callus
13.81 mins. The percentage of stevioside content from
leaves and callus was 12.19% and 12.62% respectively.
This investigation was carried out to study the
following aspects, morphological characteristics such as
plant height (cm), number of secondary branches per
plant, fresh weight of leaves (gm/plant), dry weight of
leaves (gm/plant), fresh weight of stems (gm/plant) and
dry weight of stems (gm/plant),on Stevia plants,
calculate the content of Stevioside and Rebaudioside A
and identify the genetic polymorphism in stevia
rebaudiana population via RAPD-PCR.
MATERIALS AND METHODS
The present investigation was carried out at Faculty
of Agriculture Saba Basha, Alexandria University and
Sabahia Agricultural Research Station during two
succesive seasons 2013-2014 and 2014-2015 upon
nature population of Stevia (Stevia rebaudiana Bertoni).
Ninteen stevia accessions (Stevia rebaudiana Bertoni)
were collected from healthy plants of nature population
and selected randomly, plants were multiplied
vegetatively through micro-cuttings in of 10:15 cm with
3-4 leaves. The micro-cutting propagation was carried
out by cutting the young apical shoots (YAS) of
matured stevia accessions towards the apex. Five plants
per an accession were made from each genotype. The
excised cuttings were dipped into Indole-3-buutyric
acid (IBA) for 15 minutes in order to allow the auxin
get absorbed into the cut stem through the xylem, and
inorder to stimulate the cuttings to sprout roots in a mist
chamber. Upon rooting the young plants were
transferred to a nursery section in small polyethylene
bags under a shade and were made to remain there for
two weeks. This stage was necessary to harden the
young growing plants. The soil type used in this
experiment was a mixture of sand and loam; all the
plants were subjected to the same conditions of growth
and made to develop under the same climatic condition
in Sabahia Agricultural Research Station. After two
weeks young plants were transferred to a larger
polyethylene bags and finally taken to field. When the
plants became three months old they were evaluated on
the field and subjected to various analyses.
Morphological variations of Stevia genotypes:
Plant height (cm) was expressed in cm, as the ratio
between the measurements from the soil surface to the
highest point of the plant, obtained from five plants of
each plot; number of secondary branches, calculated as
the mean number of secondary branches per plant (BP);
fresh weight of leaves (g) calculated as yield of fresh
matter (FM) in g /plant; dry weight of leaves (g)
calculated as yield of dry matter (DM) in g/plant; fresh
weight of stems (g) calculated as yield of fresh matter
(FM) and expressed in g/plant weighing five plants per
plot; dry weight of stems (g): yield of dry matter (DM)
was expressed in g/plant; moisture contents (%):
calculated as (fresh weight- dry weight)/Fresh
weight*100
Extraction and estimation of Stevia sweeteners:
Stevia leaves were dried in an electric oven (E.
Schulz & Co. Inh. Franz. Skorezewsh KG at 50°C).
Stevia sweeteners were obtained from Stevia
International Company for Agra industrial Projects
(SKAP). Stevioside standard preparation was carried
out according to Nishiyama et al. (1992) as follows:
dried Leaves (10 g leaves of Stevia rebaudiana Bertoni
obtained from Sigma) were extracted by soaking leaves
in 1.0 liter of water nearly boiling (85°C) for 30
minutes. The resulting liquid fraction was separated by
buchner filtration and the residue was washed with an
additional volume of hot water (50 ml). The aqueous
solution was concentrated by lyophyilization (Edwards
Model EF03, England) to be 50 ml and defatted by ethyl
acetate then extraction with isobutyl alcohol (150 ml).
The aqueous phase was discarded and the organic
solution was evaporated by rotary evaporator (Type
349, James Jobling and Co. Ltd. England) at 70°C until
drying was obtained. The dried extract was dissolved in
3. ALEXANDRIA SCIENCE EXCHANGE JOURNAL, VOL.37, No.1JANUARY-MARCH201612
hot methanol (100 ml) and kept over night to crystallize.
The crystals were separated by filtration and re-
dissolved again in boiling methanol (50 ml). This
solution was clarified with active charcoal (B.D.H.
Laboratory Chemicals Division. The procedure was
repeated three times until the formation of colorless
crystals was observed. The pure solution of the
stevioside prepared (pH of 9) was subjected to HPLC.At
the same time an authentic pure stevioside was obtained
from N u Naturals Inc. U.S.A.
Extraction of Stevia sweeteners from leaves was
carried out by 0.5 gm of dry stevia leaves was ground
and dissolved in 0.5 ml methanol and put in shaking and
heating for 30 minutes at 70° C then kept in room
temperature for cooling then abukhner funnel was used
for filtiration using Afilter paper one time after that we
used Activated charcoal for filtration another time
finally it were kept the filtrate frozen until analysis.
Stevia (Stevia rebaudiana Bertoni) leaves extract was
separated and identified on HPLC as follows:
Stevioside and other sweet components standard as
prepared above were filtered through a millipore
membrane (13 mm. diameter, 0.5 µm pore size) were
subjected for determination by chromatography with
stevioside standard as internal standard. Different
extracts of Stevia leaves were injected for
chromatography Acetonitrile with HPLC grade (Fisons
Co. England) was used in this study as mobile phase.
HPLC separation was carried out on 210 nm (Agilent
1200PDA detector); Eclipse plus C18 column (3.5µm
4.6x250 mm); linear gradient over 20min (84:55%
CH3CN in H2O/ 0.1% TFA); flow rate 2.0 mL/min.
Injection volume: 70 µl at ambient temperature (25°C).
All the conditions used were according to Makapugay
et al., (1984). For each samples identification
quantification and the retention time were as described
by Makapugay et al., (1984). Area under each peak was
used to calculate the percent of each compound.
Random amplified polymorphic DNAs (RAPD)
analysis of Stevia genotypes:
DNA is amplified by the polymerase chain reaction
(PCR) using arbitrary short (10 nucleotides) primers
(Williams et al., 1990). RAPD has become an important
technique for population genetic studies since the
amplified products provide random representation of
both coding and non-coding regions across the whole
genome. DNA was extracted following (Murray and
Thompson, 1980) with minor amendments as follow. 50
mg samples of of Leaves of Stevia (Stevia rebaudiana
Bertoni) material was ground with pestle and motor in
1ml 2X CTAB (1M tris (ph8), 0.5M EDTA (ph8), 5M
NaCl, 20gm CTAB (Cetyl-tetramethyl ammonium
bromide) in 1000ml) containing 25µl mercaptoethanol,
10mg polyvinyl pyrolidine (pvp). About 750 µl well
ground paste was taken in to 1.5 ml labeled eppendorf
tube. Tubes were inverted gently to mix the ingredients
incubated at 65°C for 45 minutes in water bath and
centrifuged 12,000 rpm for 10 minutes. Then in new
eppendorf tube taken 700µl supernetant,350µl 1M tris
(ph 8), 350µl chloroform: isoamyle alcohol(24:1), 5µl
proteinase K. Tubes were inverted gently to mix the
ingredients and centrifuged 12,000 rpm 10 minutes.
About 400 µl supernatant were taken carefully in to new
labeled eppendorf tube, 400µl chloroform: isoamyle
alcohol (24:1) and centrifuged 12,000 rpm 10 minutes.
400 µl supernatant were taken carefully in to new
labeled eppendorf tube 700 µl chilled isopropanol was
added to each tube and mixed gently. Tubes were
incubated at 4 °C over night and centrifugation 12,000
rpm for 10 minutes. Supernatant was discarded and
DNA pellet was rinsed with 70% ethanol. DNA pellet
was air dried. The pellet was dissolved in 100 µl TE
buffer (10 mM Tris, 1mM EDTA and PH: 8.0).
RNAase-A was used to remove RNA from the DNA.
For this purpose RNAase-A (0.20 µl of RNAase-A
procured from Gene Link, USA) 40 µg was used and
DNA samples were kept at 37°C for 30 minutes in
water bath. DNA quantification was carried out in
spectrophotometer. A 20 ng dilution of DNA was made
in deionized water to use in Polymerase Chain Reaction
(PCR). DNA samples were stored at -20 °C.
Table 1. Primers and their oligonucleotide sequences used
Primer number Primer Code Sequence 3/
---5/
1 OPN-04 5`- GACCGACCCA -3`
2 OPD-05 5`- TGAGCGGACA -3`
3 OPC-05 5`-GATGACCGCC -3`
4 OPB-07 5`-GAAACGGGTG -3`
5 OPN-10 5`-ACAACTGGGG -3`
6 OPG-12 5`-CAGCTCACGA -3`
7 OPQ-12 5`- AGTAGGGCAC -3`
8 OPQ-14 5`-GGACGCTTCA -3
4. Nader R. Abdelsalam, et al.,: Genetic Improvement through Selection of Different Stevia rebaudiana Genotypes 13
The polymerase chain reaction (PCR) conditions:
RAPD analysis was carried out using eight
oligonucleotide primers (Table 1) that were selected
from the Operon Kit (Operon Technologies Inc.,
Alabameda, CA). The polymerase chain reaction
mixture (25µl) consisted of 13µl master mix (Promega)
Taq DNA polymerase; 2µl of genomic DNA, 2µl
primer, 8µl deionized water. PCR amplification was
performed in a Biometra T1 gradient thermal cycler for
35 cycles after initial denaturation for 5min at 94°C.
Each cycle consisted of denaturation at 94°C for 1min;
annealing at 36°C for 1min; extension at 72°C for 2min
and final extension at 72°C for 5min (Williames, et al.
1990). Amplification products were separated on 2%
Agarose gels at 100 volts for 1.30 hrs with 1 x TBE
buffer. To detect ethidium bromide/DNA complex,
Agarose gels were examined on ultra violet
transilluminator (302nm wavelength) and
photographed. Using 100pb Plus DNA ladder, ready-to-
use (Gene Ruler, Fermentas, and Life Sciences), the
lengths of the different DNA fragments were
determined. For each sample, the reproducible DNA
bands from two runs were scored for their presence or
absence.
Fragments scored as present/absent. Fragment
scoring and lane matching performed automatically on
digital images of the gels, using Phoretix 1D advanced
Version 4.00 (Phoretix International, Newcastle upon
Tyne, UK). All but the faintest bands scored, where
necessary scores and matches corrected manually.
Clustering methods and similarity coefficients were
tested usingthe procedures SIMQUAL, SAHN, and
TREE from the program NTSYSpcversion 2.10
(Applied Biostatistics, Setauket, New York, USA).The
clustering methods UPGMA, WPGMA, Complete-
link,and Single-link were applied in all possible
combinations withthe similarity coefficients Dice,
Jaccard and simple matching. Phoretix electrophoresis
gel image analysis, ID software was used for scanogram
tracing of protein bands of the tissues. The molecular
weights of protein bands were determined against
protein calibration kits (Spectra™ Multicolor Broa
Range Protein Ladder; fermentas life sciencesunder the
license for Strep-tag®
technology). Data matrices were
entered into the NTSYS (Numerical Taxonomic and
Multivariate Analysis System) program, version 2.1,
Applied Biostatistics Inc. (Rohlf, 2000). Similarity
coefficients were used to construct dendrograms using
the UPGMA (Unweighted Pair Group Method with
Arithmetic average) and the SAHN (Sequential
Agglomerative Hierarchical Nested clustering) routing
in the NTSYS software. One Way ANOVA in
completely randomized design was used to reveal the
significant differences among the samples. The L.S.D.
(least significant differences) test was conducted to
identify the significant differences among the means at
5% level of probability. Comparison of the mean values
is usually calculated after an ANOVA.
RESULTS AND DISCUSSION
Morphological characteristics:
Results in Table 2 indicated high significant
variations among all studied stevia genotype in relation
to plant height (cm). The heighest plant height values
were recorded to genotype-7 by mean 123 cm followed
by genotype 17 in average (113.87 cm) and genotype 5
in average (112.25 cm), while genotypes 13, 15 and 10
were the shortest genotypes in average 48, 43.75 and
41.25 cm, respectively. Analysis of variance in Table 2
showed high significant variation between all the stevia
genotypes in relation to plant height by L.S.D.0.05=
12.64, and also data indicated that no significant
variations were observed among genotypes 2 and 3.
Huge number of secondary branches was observed to
the genotype 3 by mean 4.5 branch/plant, followed by
genotypes 7, 11 and 13 showed an average 3.5
branch/plant and were no significant variation between
them with L.S.D=2.04. On the other hand no significant
variation was observed between the other genotypes in
relation to current traits (Table 2).
Data in Table 2 showed that genotype 14 has the
highest value in fresh weight of leaves (g) by an
average of (9.66 g) followed genotype 19 (6.19 g),
genotype 9 (5.98 g) and genotype 16 by 5.95 g with L.
S. D0.05 = 2.86. The results showed high significant
variation between all genotypes of stevia in fresh weight
of leaves (g). The lowest value was recorded to
genotype 2 by average (2.45 g) as showed in Table 3
and Figure 4. Data in Table 2 showed that genotype 19
has the highest value in dry weight of leaves (g) by an
average of (2.34 g) followed genotype 14 (1.84 g) and
genotype 16 (1.63 g) with L.S.D0.05=1.57 . The results
showed that all genotypes aren`t significantly differed
from each other except genotype 2 who recorded the
lowest dry weight of leaves(0.5 g) as showed in Table
3 and Figure 5. Finally, data in Table 2 showed that
genotype 18 has the highest value in mositure content/
leaves (%) by an average of (84.83%) followed
genotype 17 (83.90%) and genotype 9 (82.78%) by
L.S.D0.05=2.23 . The results showed high significant
variation between all genotypes of stevia in mositure
content/ leaves (%) and the lowest value was recorded
to genotype 19 by average (62.26 %) as showed in
Table 2.
5. ALEXANDRIA SCIENCE EXCHANGE JOURNAL, VOL.37, No.1JANUARY-MARCH201614
Table 2. Plant height(cm) and Number of branches/ plant, Fresh, Dry weight/leaves (gm)
and Mositure content/leaves (%) of nineteen genotypes of Stevia rebaudiana Bertoni from
stem cuttings during 2014-2015 season
Character
Genotype
Plant height
(cm)
Number of
secondary
branches/ plant
Fresh
weight/leaves/
Plant (gm)
Dry
weight /leaves/
plant (gm)
Moisture
content /
leaves (%)
Genotype_1 77.75fg
2.0b
3.17b
0.59a
81.08b
Genotype_2 98.50bcde
2.5ab
2.45 b
0.51a
78.76b
Genotype_3 98.5bcde
4.5a
5.00ab
1.12a
77.08ab
Genotype_4 83.75efg
3.0ab
3.83b
0.88a
76.98b
Genotype_5 112.25ab
2.0b
5.23ab
1.25a
76.25ab
Genotype_6 108.25abc
2.5ab
4.98 a
1.35a
74.41a
Genotype_7 123.00a
3.5ab
4.00b
0.76a
80.68b
Genotype_8 84.50efg
2.0ab
3.80b
0.91a
76.60b
Genotype_9 80.00efg
2.0b
5.98ab
0.80a
82.78ab
Genotype_10 41.25h
2.6ab
3.15b
0.62a
79.09b
Genotype_11 68.50g
3.5ab
3.76b
0.79a
77.85b
Genotype_12 67.50g
2.5ab
4.99ab
1.14a
77.27ab
Genotype_13 48.00h
3.5 4.33b
0.95a
77.80b
Genotype_14 91.75cdef
2.0b
9.66 a
1.84a
81.26a
Genotype_15 43.75h
3.0ab
5.15ab
1.21a
75.64ab
Genotype_16 66.00g
2.0b
5.95ab
1.63a
72.68ab
Genotype_17 113.87ab
2.5ab
3.35b
0.55a
83.90b
Genotype_18 50.00h
0.0b
5.79ab
0.86a
84.83ab
Genotype_19 96.63bcdef
0.0b
6.19a
2.34a
62.26a
LSD=0.05 12.64 2.04 2.86 1.57 2.23
Data in Table 3 showed that genotype 19 has the
highest value in fresh weight of stems (g) by average
9.47 g followed genotype 16 (8.42 g) and genotype 4
(7.97 g) with L.S.D0.05=5.43 . The results showed that all
genotypes were not significantly differed from each
other except genotype 10 who recorded the lowest fresh
weight of stems was genotype 10 by an average of (3.18
g) as showed in Table 3. Data in Table 3 showed that
genotype 19 has the highest value in dry weight of
stems (g) by average of (2.15) followed genotype 6
(1.74 g) and genotype 1 (1.6 g) with L.S.D0.05=1.26 . The
results showed significant variations between all
genotypes of stevia in dry weight of stems and detected
the lowest value for genotype 10 by average (0.5 g) as
shown in Table 4 and Figure 7. Results in Table 3
showed that genotype 3 has the highest value in
mositure content/ stems (%) by average of (84.43%)
followed genotype 11 (83.02%) and genotype 18
(82.85%) by L.S.D0.05 = 4.29. The results showed
significant variation between all genotypes of stevia in
moisture content of stems. The lowest value was
recorded to genotype 1 by average (74 %) as showed in
Table 3.
The previous data showed that high significant
variations between all the genotypes in relation to the
morphological characteristics had achieved. That means
there is high genetic diversity between these genotypes
due to the open pollination for these genotypes several
years and theses genotypes could sed in the future
breeding programme.
These results are in agreement that accepted by
Abdullateef and Osman (2011) who’s evaluated 10
stevia accessions in Malaysia using morphological
parameters and collected data were subjected to‘t’ test
analysis. Also, our results are agreed with Kassahun et
al., (2013) worked on some morphological character on
Stevia rebaudiana Bertoni. Data on survival count,
survival percentage, number of branches/seedlings,
number of leaves/branches and number of
leaves/seedlings were recorded. The results showed that
Mean squares from analysis of variance revealed the
existence of a very highly significant influence (P <
0.001) of cutting position, node number and interaction
effect of cutting position withnode numbers on all the
parameters considered in the study. The current work is
agreed with Shizhen, and Wanzhong (1988) studied the
variation of 14 important quantity character of Stevia
rebaudiana B. and the influence of different density on
the variation.
6. Nader R. Abdelsalam, et al.,: Genetic Improvement through Selection of Different Stevia rebaudiana Genotypes 15
Table 3. Fresh weight /stems (g) and Number of branches/ plant of nineteen genotypes of
Stevia rebaudiana Bertoni from stem cuttings during season 2014-2015
Character
Genotype
Fresh weight /stems
/plant (gm)
Dry weight/stems
/plant (gm)
Moisture content /stems
(%)
Genotype_1 6.2b
1.68b
74.00b
Genotype_2 7.78b
0.89b
79.65b
Genotype_3 6.5b
1.3b
84.43b
Genotype_4 7.97b
1.6b
79.92b
Genotype_5 4.40b
0.87b
80.42b
Genotype_6 6.12a
1.74a
81.67a
Genotype_7 5.70b
1.38b
76.01b
Genotype_8 4.57b
0.97b
78.93b
Genotype_9 4.80b
0.97b
79.59b
Genotype_10 3.18b
0.57b
81.98b
Genotype_11 6.90b
1.16b
83.02b
Genotype_12 6.65b
1.25b
78.96b
Genotype_13 4.01b
0.88b
79.08b
Genotype_14 4.52b
0.91b
79.73b
Genotype_15 5.68b
1.36b
75.60b
Genotype_16 8.42b
1.64b
80.71b
Genotype_17 4.92b
1.01b
79.37b
Genotype_18 7.32b
1.26b
82.85b
Genotype_19 9.47b
2.15b
77.50b
LSD=0.05 5.43 1.26 4.29
The results indicate the variation tended to appear
similar in the same character. Some of the characters
were more stable, namely the paired leaf numbers,
number of nods before transplanting, transplanting and
plant height, number of nods, length of leaf at harvest
time. Some of the character was not stable, namely the
number of branch and the yield of dry, fresh culm, leaf.
The result of the analysis for character correlation was
shown that some characters, closely related to yield,
first of all were dry leaf weight, fresh leaf weight, fresh
culm weight, dry culm weight per plant, then, culm
width, number of branch, and the third, plant height,
number of nod, paired leaf number before transplanting.
The results agree with Oliveira et al., (2004) who
examined some morphological features of strains of
Stevia rebaudiana. The current research was in the line
with Brandle and Rosa (1992) who studied the genetic
variability in locallya vailable stevia germplasm to
allow selection of lines with agronomic and chemical
properties suitable to local production conditions. They
found that yield, leaf: stem ratio and stevioside
concentration (62.1, 78.8 and 76.6, respectively) they
were highly heritable. Yield levels were comparable to
other stevia producing areas. Stevioside concentration
was higher, probably as a result of production under
long days. These initial results also showed that clearly
suggested that genetic improvement of stevia is
possible. These high heritabilities enable selection and
breeding programs, aimed at higher yield, to achieve
substantial gains.
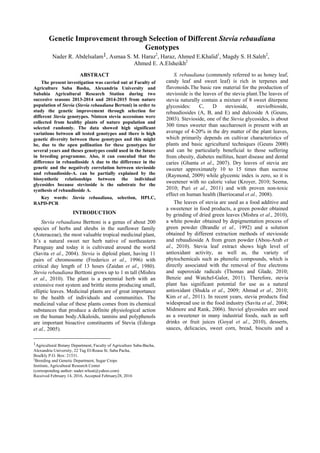
Extraction and estimation of Stevia sweeteners
Stevia sweeteners were analyzed and determined
employing the high performance liquid chromatography
HPLC. Data in Table 4 and Figures 1-2 showed the
analysis of Stevia sweeteners (Stevioside (%) and
rebaudioside-A). The results clearly indicated there
were high significant variations between the nineteen
genotypes under the study. The results showed that the
hieghest concentration of rebaudioside-A was (28.2%)
in genotype (6), and decreased to be (0.08% and 0.09%)
in genotypes (12 and 13), respectively, as the lowest
two genotypes in contrast in stevioside percentage the
results showed that the highest percentage of stevioside
was (99.5%) in genotype (12) followed by genotype
(10) by (99.2%), and decreased to be (42.3% and 34.4%
in genotypes (6 and 11) respectively. From the previous
data, we can conculaded that the different in
rebaudioside A due to the different in the genetic
background because these 19 geneotypes were grew and
polanated rondamly for many different seasones. The
data detected negatively correlation between stevioside
and rebaudioside-A.
7. ALEXANDRIA SCIENCE EXCHANGE JOURNAL, VOL.37, No.1JANUARY-MARCH201616
Figure 1. HPLC Chromatogram of stevioside and rebaudioside-A in relation to total
sweeteners: (1) standard solution, (2) genotype_3, (3) genotype_4, and (4) genotype_5
Figure 2. HPLC Chromatogram of stevioside and rebaudioside for genotype_6 in relation to
total sweeteners
8. Nader R. Abdelsalam, et al.,: Genetic Improvement through Selection of Different Stevia rebaudiana Genotypes 17
Table 4. Analysis of stevioside and Rebaudioside-A from Stevia rebaudiana fresh leaves
using HPLC in relation to total sweeteners
Rebaudioside-A (%)Stevioside (%)Genotype;
1.08
4.30
9.57
13.7
5.19
28.2
-
-
-
-
0.32
0.08
0.09
0.11
0.15
0.13
0.53
-
0.57
93.7
91.8
87.4
78.5
92.4
42.3
92.2
93.8
98.2
99.2
34.4
99.5
97.4
81.8
98.4
97.5
98.1
83.2
87.7
Genotype_1
Genotype_2
Genotype_3
Genotype_4
Genotype_5
Genotype_6
Genotype_7
Genotype_8
Genotype_9
Genotype_10
Genotype_11
Genotype_12
Genotype_13
Genotype_14
Genotype_15
Genotype_16
Genotype_17
Genotype_18
Genotype_19
These correlations can be partially explained by the
biosynthetic relationships between the individual
glycosides because stevioside is the substrate for the
synthesis of rebaudioside A. the plants which have high
concenteration in rebaudioside A will probably be low
in stevioside.
These results are in agreenent with Shibata et al.,
(1995) who observed a wide range of variation in the
four main glycosides and found that dulcoside A and
stevioside, and rebaudioside A and C, and it were
positively correlated with each other. Stevioside and
rebaudioside A, and dulcoside and rebaudioside C, were
negatively correlated with each other. These
correlations can be partially explained by the
biosynthetic relationships between the individual
glycosides because stevioside is the substrate for the
synthesis of rebaudioside A, plants high in rebaudioside
A will probably be low in stevioside. The current results
is agree with Huang et al., (1995) who investigated the
seedling population and clone variation from the
difference of sweet component andcontent in Stevia
rebaudiana Bertoni. The results showed: (1) there are
7.3% high yielding plants in seedling population, in
which the proportion of R-A type with content of R-A
over St content is 10.96%, and their R-A content varies
from 3.3 to 12.0%. (2) Among the selected improved
clone J-2, there are high significant difference in leaf
size and steviosides content. The R-A content varies
from 4.5 to 12.2%. (3) The individuals with R-A
content of 7.04 apprx 12.03% from seedling population
(original content 3.86%) and individuals with R-A
content of 10.15 apprx 12.15% from improved
individual clone (original content 9.10%) were selected
out.
RAPD-PCR ANALYSIS
Plant molecular geneticists are currently used RAPD
markers routinely to identify genetic variations (Keil
and Griffin, 1994; Lashermes et al. 1996; Irwin et al.,
1998 and Sun et al. 1998). RAPD markers have been
also used successfully in various taxonomic and
Phylogenetic studies. In addition, it locates regions of
the genome linked to agronomically important genes
(Reiter et al., 1992; Martin et al., 1991; Michelmore et
al., 1991; Pillay and Kenny 1996). Furthermore, it
facilitates introgression of desirable genes into
commercial accessions (Lavi et al., 1994). In the
present study, the genetic variability and relationships
of different genotypes of Stevia (Stevia rebaudiana)
have been studied based on RAPD analysis. Initial
screening of large number of RAPD primers with
ninteen genotypes of stevia (Stevia rebaudiana) resulted
in eight RAPD primers that produced in formative and
polymorphic products resolvable by agarose gel
electrophoresis.
The results of primer OPN-04 are illustrated in
Table 5. The total fragments were 61 amplification
products at the fragment lengths ranged between 237 to
3000 bp. One of 61 fragments was monomorphic (300
bp) and 15 fragments were polymorphic i.e. (3000,
2841, 1825, 1707, 1413, 937, 895, 877, 822, 794, 790,
9. ALEXANDRIA SCIENCE EXCHANGE JOURNAL, VOL.37, No.1JANUARY-MARCH201618
700, 529, 500 and 469 bp)and 45 fragments were
unique (2684, 2377, 2230, 2088, 1598, 1500, 1338,
1273, 1220, 1128, 1073, 1065, 1040, 1019, 1000, 986,
982, 966, 950, 923, 900, 898, 886, 845, 842, 831, 810,
807, 790, 767, 737, 734, 718, 674, 656, 634, 632, 615,
581, 472, 438, 394, 378, 268 and 237 bp). The
percentage of the polymorphism was 98.36%. Results
showed that the genotypes number 2, 6, 7, 11, 12, 14,
15, 16 and 9 gave the same number of fragments (5, 6)
respectively, While the genotypes 1, 8, 10, 17 and 18
detected the highest number of fragments (7 fragments).
In the same time genotypes 5, 13 and 19 recorded the
lowest number of fragments (4 fragments). On the other
hand, the genotypes 3 doesn`t amplified any fragments
and he missing during loading procedure (Table 5)
The total fragments were 63 amplification products
at the fragment lengths ranged between 127 to 2710 bp
for OPD-05 primer. One monomorphic fragment was
detected (1000 bp), 21 fragments were polymorphic and
41 fragments were unique. The percentage of the
polymorphism was 98.4%. Results in Table 6 showed
that genotypes 13 recorded (2 fragments, 3 (five
fragments), while all the fowling genotypes (1, 18), (16,
17), (9, 15), (4, 10, 11) and (2, 6, 7, 8) detected the
same number of fragments (1, 18), (16, 17), (9, 15), (4,
10, 11) and (2, 6, 7, 8), respectively. On the other hand
genotype 3 detected 5 fragments. The highest numbers
of DNA fragments were recorded to genotypes 14, 19
by 9 fragments. While, genotype 13 amplified the
lowest DNA fragments number (2 fragments) and
finally genotype 12 doesn`t amplified any fragment.
The results of OPC-05 primer are illustrated in
Table 7. The total fragments were 73 amplification
products at the fragment lengths ranged between 100 to
2528 bp. Four fragments were monomorphic (1000,
700, 500 and 300 bp) and 18 fragments were
polymorphic. The percentage of the polymorphism was
94.5%. Results in Table 7 showed that the highest
number of DNA fragments was 13 fragments recorded
to the genotypes 18. Genotypes 17 and 19 recorded 11
and 12 fragments, in respect. Genotypes (5, 8, 9), (2, 4,
15), (6, 7, 10, 13) and (14, 11, 16) detected the same
number of fragments (7, 8, 9 and 10), respectively. On
the other hand, the genotype 3, 12 amplified the lowest
DNA fragments number (6 fragments). The total
fragments by using primer OPB-07 were 28
amplification products at the fragment lengths ranged
between 300 to 2429 bp. Two of 28 fragments were
monomorphic (1435 and 801 bp) and seven fragments
were polymorphic. 19 of 28 fragments were unique and
the percentage of the polymorphism was 92.85%.
(Table 8).
Results showed that genotypes 2, 6, 12, 15 and 4, 8,
9, 13, 16 detected the same number of fragments (3 and
4 fragments, respectively),while the genotypes 3, 7, 10,
11, 18 and 19 showed the highest number of DNA
fragments (5 fragments). On the other hand, the
genotype 14 amplified the lowest DNA fragments
number (2 fragments). Genotypes 5, 17 don`t gave any
fragments.
The results of primer OPN-10 are illustrated in
Table 9. The total fragments were 22 amplification
products at the fragment lengths ranged between 628 to
2738bp. One fragment of 22 was monomorphic (1015
bp), six of 22 fragments were polymorphic (2738, 995,
898, 890, 883 and 628 bp) and 15 fragments were
Unique (2483, 1781, 1679, 1585, 983, 939, 909, 900,
876, 830, 787, 756, 688, 680 and 648 bp). The
percentage of the polymorphism was 95.45%. Results
showed that genotypes (2, 5, 7, 9, 11, 14, 17, 19) and
genotypes (3, 4, 6, 10, 18) detected the same number of
fragments (2 and 3 fragments), respectively, while, the
genotypes 1, 15 and 16 showed the highest number of
DNA fragments (4 fragments). On the other hand, the
genotypes 8, 12 and 13 don`t gave any fragments.
Concerning to primer OPN-10 found in Table 10,
the total fragments were 17 amplification products at
the fragment lengths ranged between 113 to 1405 bp.
one of 17 fragments was monomorphic (500 bp), one of
17 fragments was polymorphic (665 bp) and 15
fragments were unique. The percentage of the
polymorphism was 94%. With primer OPQ-12 the total
fragments were 19 amplification products at the
fragment lengths ranged between 176 bp. to 1018 bp.
one of 19 fragments was monomorphic (714 bp), 4 of
19 fragments was polymorphic (775, 742, 728, and 176
bp) and 14 fragments were unique. The percentage of
the polymorphism was 94.7 % (Table 11). The results
of primer OPQ-14 are illustrated in Table 12. The total
fragments were 9 amplification products at the fragment
lengths ranged between 190 bp. to 2316 bp. One of 9
fragments was monomorphic (190 bp), 2 of 9 fragments
were polymorphic (612 and 829 bp) and 6 fragments
were unique (2316, 1406, 926, 641, 222 and 197 bp).
The percentage of the polymorphism was 89%.
Data in Table 13 showed the primer name, total
number of amplicons, monomorphic and polymorphic
amplicons and the percentage of polymorphism among
the nineteen genotypes. The mean precxentage of
polymorphic was 94.65 %.
10. Nader R. Abdelsalam, et al.,: Genetic Improvement through Selection of Different Stevia rebaudiana Genotypes 19
12. Nader R. Abdelsalam, et al.,: Genetic Improvement through Selection of Different Stevia rebaudiana Genotypes 21
The genetic polymorphism between the nineteen
genotypes ranged from 89% by using OPQ-14 to 98.4%
with OPN-04 and OPD-05, in respect (Table 13). That
mean there are high genetic diversity between the
current genotypes and it could be used in the breeding
program to obtaining new genetic resources from Stevia
rebaudiana plants.
To study the genetic similarities and phylogenetic
relationships among the ninteen tested genotypes of
Stevia rebaudiana RAPD-PCR analysis were used. The
obtained data were subjected to cluster analysis with
dice equation by using NTYSIS (ver 2.1) computer
program to calculate proximity matrix and design
dendogram. In the present study the genetic
relationships among the nineteen genotypes were
determined by Dice coefficient. The matrix of similarity
index ranged from 0.78 recorded between genotype 13
and 14 to 0.٩١ recorded between genotype 7 and 8 with
an average of 0.80. The dendrogram illustrating the
distance among the examined genotype is presented in
Figure 3. The dendogram in this case revealed two main
groups (A & B) by ٠٫٨١% similarity. The first group A
consists of two clusters (genotype 9 and 3) by 84 %
similarity. Cluster B divided to two sub clusters (A/
and
B/
) by 82.5% similarity. Sub cluster (A/
) divided to two
three clusters and includes (Genotypes 19, 18, 16, 13)
by 83% similarity. Sub cluster (B/
) divided to two sub
cluster (A//
& B//
). Sub cluster A//
includes two sub
clusters AND genotypes 6, 7, 8, 10, 11, 14 and 15,
while, sub cluster B//
include both genotypes 1, 2, 4, 5,
12 and 17.
The current study was in the line with
Moktaduzzaman and Rahman (2009) who worked on 9
randomly selected regenerated plants and subjected to
RAPD analysis. Their results indicated that the
estimation of genetic similarity coefficient based on
RAPD band-sharing data indicated that some
regenerated plants were 100% similar to the mother the
mother plants and some were 71.57 or 14% similar may
be due to in vitro condition. Also, our results are agree
with Radhika et al., (2012) who worked on molecular
genetic fingerprints of medicinal species using
Randomly Amplified Polymorphic DNA (RAPD)
marker to elucidate the genetic diversity among the 18
species of stevia rebaudiana plant. The results indicated
that of which 232 fragments were polymorphic with
96.84% of polymorphism. Some of the RAPD markers
were useful for species discrimination and
identification. Most of the RAPD markers studied
showed different level of genetic polymorphism.
Amplified fragment sizes ranged from 300 to 5000 bp.
PairwiseNei and Li’s similarity coefficient value ranged
from 0.00-0.72 for 18 species of medicinal plants. The
results in the line with Chester et al., (2013) who
studied the genetic and metabolic variability in S.
rebaudiana among accessions of different geographical
regions of India using random amplified polymorphic
DNA (RAPD) markers. They found ten out of 20
primers screened were most informative; amplification
products of the genotypes yielded a total of 87 scorable
bands (67 polymorphic), whereas genetic similarity
(GS) coefficient (0.01-0.08) and polymorphism (67.24-
92.40%) showed huge variability. The current results in
the line with Paramanik and Chikkaswamy (2014) who
assayed the genetic relationships between eighteen
medicinal plants with RAPD markers. They showed that
over 77.23 reproducible bands were generated by
RAPD primers, out of which, 77.23 polymorphic bands
were identified, conferring 97.6% polymorphism. All
the primers produced typical banding in each of the
medicinal plants, suggesting the applicability of this test
in medicinal plant identification. Results of the current
work is agreed with Chikkaswamy (2015) who
investigated molecular genetic fingerprints of medicinal
species using RAPD marker to elucidate the genetic
diversity among the 18 species. Three decamer-primers
generated 250 RAPD fragments, of which 232
fragments were polymorphic with 96.84% of
polymorphism. Some of the RAPD markers were useful
for species discrimination and identification. They
maintained that most of the RAPD markers studied
showed different level of genetic polymorphism.
Amplified fragment sizes ranged from 300 to 5000 bp.
Table 12. DNA polymorphism of Ninteen genotypes of Stevia rebaudiana plant using
randomly amplified polymorphic DNA with primer OPQ-14
Genotype 1 2 3 4 5 6 7 8 9 10 11 12 13 14 15 16 17 18 19
Monomorphic
Polymorphic
Unique
Total bands
Polymorphism%
1
0
2
3
66.6
0
0
0
0
0
1
0
0
1
0
0
0
0
0
0
0
0
0
0
0
1
0
1
2
50
1
0
1
2
50
1
0
0
1
0
1
0
0
1
0
1
2
0
3
66.6
1
2
1
4
75
0
0
0
0
0
0
0
0
0
0
1
0
1
2
50
0
0
0
0
0
1
0
0
1
0
0
0
0
0
0
1
0
0
1
0
0
.0
0
0
0
13. ALEXANDRIA SCIENCE EXCHANGE JOURNAL, VOL.37, No.1JANUARY-MARCH201622
Table 13. Polymorphism data as detected by RAPD markers, total number of amplicons,
monomorphic and polymorphic amplicons and the percentage of polymorphism among the
nineteen genotypes
Primer code
Total amplicons
Monomorphi
c
polymorphicuniquepolymorphism %
OPN-04611154598.4
OPD-05631214198.4
OPC-05734185194.5
OPB-0728271992.8
OPN-1022161595.5
OPG-1217111594.0
OPQ-1219141494.7
OPQ-14912689.0
Total2921274206
Polymorphism %94.65
Figure 3. Dendrogram of similiratiy of different ninteen Stevia genotypes based on 8 RAPD-
RCR primers
REFERENCES
Abdullateef, R.A., and M. Osman. 2011. Influence of Genetic
Variation on Morphological Diversity in Accessions of
Stevia rebaudiana Bertoni. Int. J. Biol. 3: 66-72.
Abou-Arab, A.E., A.A. Abou-Arab, and M.F. Abu-Salem.
2010. Physico-chemical assessment of natural sweeteners
steviosides produced from Stevia rebaudiana Bertoni
plant. Afr. Food Sci. 5: 269- 281.
Ahmad, N., H. Fazal, B. Abbasi, and S. Farooq. 2010.
Efficient free radical scavenging activity of Ginkgo
biloba, Stevia rebaudiana and Parthenium hysterophorous
leaves through DPPH (2,2-diphenyl-1-picrylhydrazyl).
Int. Phytom. 3: 231–239.
Amzad-Hossain, M., A. Siddique, and S. Mizanur-Rahman.
2010. Chemical composition of the essential oils of Stevia
rebaudiana Bertoni leaves. Asian . Trad. Medicines 2: 56–
61.
Barriocanal, L., M. Palacios, G. Benitez, S. Benitez, S.J.T.
Jimenez, and N. Jimenez. 2008. Apparent lack of
pharmacological effect of steviol glycosides used as
sweeteners in humans, a pilot study of repeated
exposures in some normatensive and hypotensive
individuals and in type 1 and type 2 diabetics. J. Regu.
Toxicol. and Pharm. 1: 37-41.
Benzie, I.F., and S. Watchel-Galor. 2011. Herbal Medicine:
Biomolecular and Clinical Aspects. J. CRC Press, USA.
465: 1-48.
14. Nader R. Abdelsalam, et al.,: Genetic Improvement through Selection of Different Stevia rebaudiana Genotypes 23
Brandle, J.E., and N. Rosa. 1992. Heritability for yield, leaf-
stem ratio and stevioside content estimated from a
landrace cultivar of Stevia rebaudiana. Can. J. Plant. Sci.
4: 1263-1266.
Chester, K., E.T.Tamboli, R. Parveen, and S. Ahmad. 2013.
Genetic and metabolic diveristy in Stevia rebaudiana
using RAPD and HPTLC analysis. Pharm. Biol. 6: 771-
777.
Chikkaswamy, B.K. 2015. Assessment of Genetic Diversity
and Relationships of Medicinal Plants using RAPD
Marker. Int. Adv. Res. in IT and Eng. 2: 25-35.
Edeoga, H., D. Okwu, and B. Mbaebie. 2005. Phytochemical
constituents of some Nigerian medicinal plants. Afr. J.
Bio. 7: 685–688.
Frederico, A.P., P.M. Ruas, M.A. Marinmorlaes, C.F. Ruas,
and J.N. Nakajima. 1996. Chromosome studies in some
Stevia (Compositae) species from southern Brazil.
Brazilian . Gene. 4: 605-609.
Geuns, J. M.C. 2003. Stevioside. J. Phytochemistry., 5: 913–
921.
Geuns, J.M.C. 2000. Safety of Stevia and stevioside. Recent
Res. Dev. Phytochem. 4 : 75-88.
Ghanta, S., A. Banerjee, A. Poddar, and S. Chattopadhyay.
2007. Oxidative DNA damage preventive activity and
antioxidant potential of Stevia rebaudiana (Bertoni), a
natural sweetener. J. Agric. Food Chem. 26:10962–10967.
Goyal, S.S., and R. Goyal. 2010. Stevia (Stevia rebaudiana) a
biosweetener: A review. Int. J. of Food Sci . Nutrition 1:
1-10.
Huang, X-Y., J-F. Fu, and D-L.Di. (2010). Preparative
isolation and purification of steviol glycosides from Stevia
rebaudianaBertoni using high-speed counter-current
chromatography.J. Sep. and Pur. Technol. 2: 220-224.
Huang, S.Y.G., G. Ai , Y. Q. Cheng, Y. L. Gu, and F. Hong.
1995. Studies on the variation of steviosides content and
selection of type R-A in Stevia rebaudiana. J.Plant Res. &
Env. 3: 28-32.
Irwin, S. V., P. Kaufusi, K. Banks, R. D.L. Pena, and J. J.
Cho. 1998. Molecular characterization of taro (Colocasia
esculenta) using RAPD markers. Journal of Euphytica .
3:183-189.
Kassahunt, B.M., H. Nurhusain, H. Gebremeskel, S.A.
Mekonnen, Z. Damtew, M. Philipos, B. Melka, and T.
Niide. 2013. Participatory Development of Quality
Seedlings for Stevia(Stevia rebaudianaBertoni) Using
Stem CuttingsWorld Journal of Agricultural Sciences. 2:
148-154.
Keil, M., and R.A. Griffith. 1994. Use of random amplified
polymorphic DNA (RAPD) markers in the discrimination
and verification of genotypes in Eucalyptus. Journal of
Theoratical and Applied Genetics. 4: 442-450.
khatab, A. 2015. Peroxidase Isozymes and Proline Content In
Relation To Salinity Tolerance in Stevia Plant. Alex.
Science Exchange J. 3: 206-212.
Kim, I., M. Yang, O. Lee, and S. Kang. 2011. The antioxidant
activity and the bioactive compound content of Stevia
rebaudiana water extracts. LWT – Journal of Food
Science and Technology 5: 1328-1332.
Kroyer, G. 2010. Stevioside and Stevia-sweetener in food:
application, stability and interaction with food ingredients.
Journal für Verbraucherschutz und Lebensmittelsicherheit.
2: 225-229.
Lashermes, P., P. Trouslot, F. Anthony, M.C. Combes, and A.
Charrier. 1996. Genetic diversity for RAPD markers
between cultivated and wild accessions of Coffea
arabica.Journal of Euphytica. 1:59-64.
Lavi, V., M. Akkaya, A. Bhagwat, E. Lahav, and P.B.
Cregan. 1994. Methodology of generation and
characteristics of SSR DNA repeat in Avocado (Persea
americana M.).Euphytica. 3: 171-177.
Mahmud, S., S. Akter, I.A. Jahan, S. Khan, A. Khaleque, and
S. Islam. 2014. Comparative analyses of stevioside
between fresh leaves and in-vitro derived callus tissue
from Stevia rebaudiana Bertoni. using HPLC. Bangladesh
Journal of Scientific and Industrial Research. 4: 199-204.
Makapugay, H.C., N.P.D. Nanayakkara, and A.D. Kinghorn.
1984. Improved high-performance liquid chromatographic
separation of the Stevia rebaudianas weetditerpene
glycosides using linear gradient elution.Journal of
ChromatographyA. C: 390-395.
Martin, G.B., J.G.K. Williams, and S.D. Tanksley. 1991.
Rapid identification of markers linked to a Pseudomonas
resistance gene in tomato by using random primers and
near isogenic lines. Proceedings of the National Academy
of Sciences of the United States of America. 6: 2336–
2340.
Michelmore, R.W., I. Paran, R.V. Kesseli. 1991. Identification
of markers linked to diseaseresistance genes by bulked
segregant analysis: a rapid method to detect markers in
specific genomic regions by using segregating
populations. Proceedings of the National Academy of
Sciences of the United States of America. 21: 9828-9832.
Midmore, J.D. and A.H. Rank. 2006. An intense natural
sweetener-laying the ground work for a new rural
industry. Joural of RIRDC Publication . 6: 1-20.
Mishra, P., R. Singh, U. Kumar, and V. Prakash. 2010. Stevia
rebaudiana – A magical sweetener. Global Journal of
Biotechenology and Biochemstery. 1: 62–74.
Moktaduzzaman, M., and S.M.M. Rahman. 2009.
Regeneration of stevia rebaudiana and Analysis of
Somaclonal Variation by RAPD. Journal of
Biotechnology. 4: 449-445.
Murray, M.G., and W.F. Thompson. 1980. Rapid isolation of
high molecular weight plant DNA. Nucleic Acids Res 8:
4321-4325.
Nishyama, P., M. Alvarez, and L.G.E. Vieira. 1992.
Quantitative analysis of stevioside in the leaves of Stevia
rebaudianaby near infrared reflectance spectroscopy.
Journal of Science Foodand Agriculture. 3: 277-281.
15. ALEXANDRIA SCIENCE EXCHANGE JOURNAL, VOL.37, No.1JANUARY-MARCH201624
Oliveira1, D.M.V., E.R. Forni-Martins, P.M. Magalhaes, and
M. N. Alves. 2004. Chromosomal and morphological
studies of diploid and polyploidcytotypes of
Steviarebaudiana (Bertoni) Bertoni (Eupatorieae,
Asteraceae). Journal of Genetics and Molecular Biology.
2: 215-222.
Paramanik, R.C., and B.K. Chikkaswamy. 2014. Study on
Genetic Diversity relationship some Medicinal plantsusing
RAPD Molecular marker. International Journal of Current.
Microbiology and Applied Science. 6: 1004-1015.
Pillay, M., and S.T. Kenny. 1996. Structure and inheritance of
ribosomal DNA variants in cultivated and wild hop,
Humulus lupulus L. Journal of Theoretical and Applied
Genetics. 3:333–340.
Puri, M., D. Sharma, and A.K. Tiwari. 2011. Downstream
processing of stevioside and its potential applications.
Journal of Biotechnology Advances. 6: 781-791.
Radhika, K., S. Sumer, S.M. Gopinath, and A.G.M. Patil.
2012. A study on assessement of genetic diversity and
relationships of medicinal plants using RAPD .Global
Journal of Research on Medicinal Plants and Indigenous
Medicine. 12: 678–686.
Raymond, K.W. 2009. General Organic and Biological
Chemistry. Journal of John Wiley & Sons, USA. 16: 364-
368.
Reiter, R.S., J.G.K. Williams., K.A. Feldman., J.A. Rafalski.,
S.V. Tingey, and P.A. Scolnik.(1992). Global and local
genome mapping in Arabidopsis thaliana by using
recombinant inbred lines and random amplified
polymorphic DNAs. Proceedings of the National
Academy of Sciences. 4: 1477-1481.
Rohlf, F.J. 2000. On the use of shape spaces to compare
morphometric method. Hystrix,The Italian Journal of
Mammology (n.s.). 1: 8-24.
Savita, S.M., K. Sheela, A.G.S. Sharan Sunanda, and P.
Ramakrishna. 2004. Stevia rebaudiana – A Functional
Component for Food Industry.Journal of Human and
Ecology. 4: 261-264.
Seema, T. 2010. Stevia rebaudiana: A medicinal and
nutraceutical plant and sweet gold for diabetic patients,
International Journal of Pharmacy and Life Sciences. 8:
451-457.
Shibata, H., Y. Sawa, T. Oka, S. Sonoke, K. K. Kim, and M.
Yoshioka. 1995. Steviol and steviol-glycoside:
Glucosyltransferase activities in Stevia rebaudiana
Bertoni-Purification and partial characterization. Journal
of Archives of Biochemistry and Biophysics. 2: 390-396.
Shukla, S., A. Mehta, V. Bajpai, and S. Shukla. 2009. In vitro
antioxidant activity and total phenolic content of ethanolic
leaf extract of Stevia rebaudiana Bertoni. Journal of Food
and Chemical Toxicology. 9: 2338–2343.
Skoog, D.A., M.D. West, and J. F. Holler. 1988.
Fundamentals of Analytical Chemistry (High Performance
Liquid Chromatography).Journal of Analytical Ceemistry.
6: 1-15.
Sun, Q. N., Z. Litu, J. Gao, and T. Huang. 1998. Genetic
relationships and diversity among Tibelian whets,
common wheat and European spelt wheat revealed by
RAPD markers. Journal of Euphytica. 3: 205 - 211.
Thiyagarajan, M., and P. Venkatachalam. 2015. Assessment
of genetic and biochemical diversity of Stevia rebaudiana
Bertoni by DNA fingerprinting and HPLC analysis.
Journal of Annals of Phytomedicine. 1: 79-85.
Thomas, J. E and J. M. Glade (2010). Stevia: It’s not just
about calories. The Open Obesity Journal. ( 2): 101–109.
Williams, J.G., R.A. Kubelik, J.K. Livak, K,A.J. Rafalski,
and V.S. Tingey. 1990. DNA polymorphisms amplified by
arbitrary primers are useful as genetic markers Journal of
Nucleic acids research. 22: 6531-6535.
Zaidan, L.B.P., S.M.C. Dietrich, and G.M. Felippe. (1980).
Effect of photoperiod on flowering and stevioside content
in plants of Stevia rebaudiana Bertoni. Japanase Journal
of Crop Science. 49: 569-574.