Download as PDF, PPTX

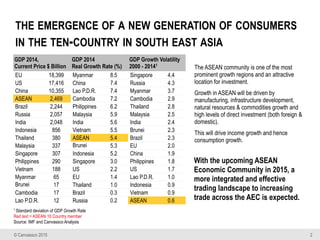
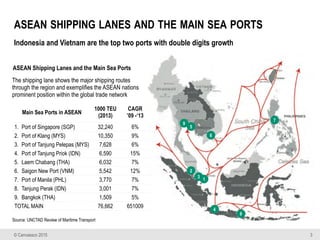
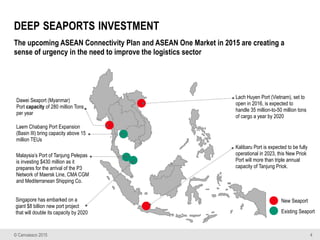
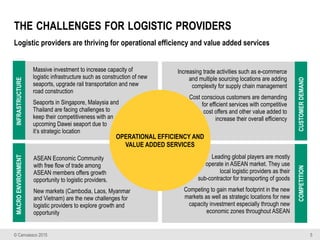
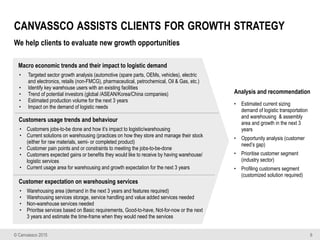


The document discusses the growth potential of the ASEAN logistics market, driven by an integrated trading landscape with the 2015 ASEAN Economic Community. It highlights major investments in seaports and logistics infrastructure to improve operational efficiency and accommodate rising trade activities. The report also identifies challenges for logistics providers in accessing new markets and meeting the demands of cost-conscious customers while leveraging local sub-contractors.