1. Sources of Funds and Investment Activities of Venture Capital Funds:
Evidence from Germany, Israel, Japan and the UK
Colin Mayer
Sa¿d Business School, University of Oxford and CEPR
colin.mayer@sbs.ox.ac.uk
Koen Schoors
University of Ghent
koen.schoors@rug.ac.be
Yishay Yafeh
Hebrew University of Jerusalem
msyafeh@mscc.huji.ac.il
March 27, 2002
We thank Hedva Ber, Michel Habib, Thomas Hellman, Eugene Kandel, Ken Kim, Jan-Peter Krahnen,
Saul Lach, Sophie Manigart, Alan Morrison, Kristian Rydqvist, Juro Teranishi, Naoyuki Yoshino, and
seminar participants at the Bergen School of Management, the European Central Bank, the Mannheim
Conference on “Industrial Economics and Input Markets,” the Oslo School of Management, the Oxford
Finance Workshop, Waseda University, the IMF/Hitotsubashi Conference “Designing Financial
Systems in East Asia and Japan” (Tokyo), and the CEPR Conference “Understanding Financial
Architecture” (Madrid) for helpful comments and suggestions. Financial support from the European
Commission Research Training Network “Understanding Financial Architecture: Legal and Political
Frameworks and Economic Efficiency” is gratefully acknowledged. This research project was initiated
while Koen Schoors and Yishay Yafeh were visiting fellows at the University of Oxford (Sa¿d
Business School, and St. Antony’s College and the Nissan Institute, respectively) whose hospitality and
financial support are gratefully acknowledged.
2. Abstract
Using a newly constructed data set, we compare sources of funds and investment
activities of venture capital (VC) funds in Germany, Israel, Japan and the UK.
Sources of VC funds differ significantly across countries, e.g. banks are particularly
important in Germany, corporations in Israel, insurance companies in Japan, and
pension funds in the UK. VC investment patterns also differ across countries in terms
of the stage, sector of financed companies and geographical focus of investments. We
find that these differences in investment patterns are related to the variations in
funding sources - for example, bank and pension fund backed VC firms invest in later
stage activities than individual and corporate backed funds – and we examine various
theories concerning the relation between finance and activities. We also report that
the relations differ across countries; for example, bank backed VC firms in Germany
and Japan are as involved in early stage finance as other funds in these countries,
whereas they tend to invest in relatively late stage finance in Israel and the UK. We
consider the implication of this for the influence of financial systems on relations
between finance and activities.
Key words: venture capital, financial institutions, sources of funds
JEL classification: G20, O32.
3. 1. Introduction
Promotion of entrepreneurship and innovation has become one of the primary
industrial policies of developed economies around the world. For example, at the
Nice European Council of December 2000, the leaders of the 15 member states of the
European Union described entrepreneurship as a central component of European
employment policy. The development of a venture capital (VC) industry is often
regarded as a significant component of this policy.
The question that this raises is to what extent does the VC industry play a
similar role in different countries, and how large is the influence of its sources on its
activities. Some observers see the supply of entrepreneurs, the science base, technical
transfer from universities to industry, the ability of entrepreneurs to capture the fruits
of their inventiveness and other institutional factors affecting the demand for VC
support as the key to investment in technology related industries. Others regard the
financial system and the supply of risk capital as critical factors. Policies to
encourage investors to invest in private equity and institutions to be less risk averse in
their investment strategy have supply of funds at their root. For example, Gompers
and Lerner (1998) argue that relaxation of the “prudent man” rule in the US at the end
of the 1970’s allowed the rapid growth of VC in the 1990’s to occur.
The relevance of financial institutions and financial systems to corporate
activity has been much discussed in the academic literature. In the context of the
financing of innovation, Black and Gilson (1998) contrast bank and stock market-
oriented financial systems, and argue that initial public offerings (IPOs) provide an
important exit route for VC funds. More generally, differences in financial systems
have been associated with different types of investments. Allen (1993) and Allen and
Gale (2000) have argued that stock markets allow investors to hold diverse views
about investments, whereas banks are well equipped to acquire information about
firms where there is a high degree of consensus. Securities markets are therefore
particularly relevant where investors have diverse views about, for example, new
technologies, whereas banks can exploit economies of scale in collecting information
about more traditional investments in, for example, manufacturing. Carlin and Mayer
(1999) report a relation between the types of activities undertaken in different
countries and the structure of countries’ financial systems.
The present paper is an industry study, focusing exclusively on the VC sector
and posing the question how is the structure of VC funds and, more specifically, their
1
4. financing sources related to their investment activities. Our analysis can therefore be
viewed as an attempt to shed light on the question of whether the Modigliani-Miller
theorem holds in this sector. We report results from a newly constructed database
consisting of about 500 venture capital firms in four countries – Germany, Israel,
Japan and the UK. The database is valuable not only for studying the venture capital
industry but also as a source of information on the above debates on relations between
sources of finance and investment activity more generally. The data provide unique
insights on both the types of investments made by financial institutions by stage of
activity, sector and location and on the sources from which they raise their finance. It
is therefore possible to undertake new analyses of how financing relates to
institutions’ investment allocations and to undertake comparisons of this across
countries.
As regards the analysis of the VC industry itself, it differs from the existing
literature in several respects. Firstly, the existing empirical literature is almost
exclusively focused on the US. For example, in a collection of articles, Gompers and
Lerner (1999) consider several financial aspects of VC investments and their impact
on the performance of VC backed firms in the US (e.g. at the time of the IPO).
Hellman and Puri (2000) study the influence of VC funds on the activities of their
clients, and Kaplan and Stromberg (2000) examine the contractual relations between
the funds and their clients, also within the US.1
VC activity is growing rapidly elsewhere and there is increasing interest in the
performance of the VC industry outside of the US.2 This paper considers four
countries - Germany, Japan, Israel and the UK, all of which have significant and/or
rapidly growing VC industries. The spread of countries is interesting because it
includes two bank-oriented systems (Germany and Japan), one (non-US) market-
oriented system and one major high technology success story, Israel, with supposedly
the largest concentration of VC investments outside of California and Massachusetts.
Within Europe, Germany and the UK are particularly important for the study of the
VC industry, because these two countries together account for over half of all VC
investments in the Continent (BVK, 2000).
1
For more extensive surveys of (some of) the empirical VC literature, see, for example, Manigart and
Sapienza (2000) and Gompers and Lerner (2001). The theoretical VC literature is also, to a very large
extent, motivated by observations about the US VC industry, for example with respect to the type of
contracts used (e.g. Cornelli and Yosha, 1997, Hellman, 1998).
2
See a survey of VC activity in Europe in Botazzi and Da Rin (2001) and Cumming’s (2001) study of
VC contracts in Canada.
2
5. Secondly, most analyses of VC in different countries report aggregate
statistics. In this paper we employ disaggregated data at the individual fund level.
Thirdly, to the extent that disaggregated data have been used they have focused on
firms. We focus on the VC funds themselves rather than on financed firms, posing
the question to what extent can differences in individual fund activities (in particular,
the technological stage of financed firms and their sector focus) be associated with
differences in the sources of finance. For example, is it the case that VC firms that
are funded through banks invest in firms at different stages of their development from
those that are funded by private individuals? To the best of our knowledge, no study
has yet examined the relation between sources of funds and investment strategies in
the VC industry.
Our empirical analysis proceeds in four stages. We first provide descriptive
statistics of the VC industries in the four countries. We then analyze the correlation
between sources of finance and types of activity financed, focusing on the
technological stage of companies receiving VC finance. We examine a variety of
regression specifications explaining VC activity, measured by stage, sector and
geographical focus of investment. Initially, we assume that there are similar relations
between sources of finance and activities across countries. We then relax this
assumption and allow the relations to be country specific. This permits us to evaluate
whether financial markets are integrated across countries or whether financial systems
in different countries bear on the relations between sources of finance and activities.
For example, are the activities of bank backed VC firms different in the bank oriented
financial systems in Germany and Japan from those in the market oriented system in
the UK? Our analysis sheds light on possible reasons for differences in VC activity
across different funds within a country and between countries.
The results are striking. Firstly, there are substantial differences across
countries in terms of the stage of finance of VC firms. They are much more focused
on early stage investments in some countries, most notably Israel, than others, in
particular Japan. There is a remarkably close similarity in stage of finance between
Germany and the UK, despite the frequently cited differences in their financial
systems. Secondly, there are significant differences in VCs’ sector focus. While
biotechnology and life sciences receive a substantial level of attention in all four
countries, a much larger fraction of VC firms in Israel and Japan focus on information
technology (IT) and software than in Germany and the UK, where the manufacturing
3
6. sector receives more attention. VC investment in electronics appears to be relatively
uncommon in Japan.
Turning to institutional differences across countries, we find that there are
substantial variations in the sources of finance of VC firms. Banks are a major source
of external finance in all countries, particularly in Germany and Japan. Pension funds
are much more significant in the UK than in the other three countries. Corporations
are a more important source of finance of VC firms in Israel than elsewhere.
We find that there are significant relations between sources of finance of VC
firms and their investment activities within countries. In particular, banks, insurance
and pension fund backed VC firms invest in later stage activities, and VC firms
relying on private individual investors and corporations favour earlier stage activities.
Individual and corporate backed funds invest more in IT, software and electronics in
preference to manufacturing sectors, while the reverse holds for insurance and
pension fund backed funds. Bank and pension backed funds invest domestically
while individual and corporate backed funds invest globally. Financial intermediary
backed funds are therefore focused on late stage investments in relatively low tech
domestic industries while individual and corporate backed funds invest globally in
early stage activities in high tech industries. Finally, we find a strong focus of
government backed funds on domestic investments.
There are significant differences in the relations between financing and
investment stage across countries. While bank backed VC firms in Israel and the UK
invest in later stage activities relative to other sources of finance, this is not the case in
Germany and Japan. In contrast, investment in early stage activities by corporate
backed funds is a feature of Germany and the UK, not of Israel and Japan. Early
stage investment by individual backed funds is a feature of Germany and Japan but
not of Israel and the UK.
We believe that these relations may have important implications for theories
of corporate finance. In particular, they support theories that suggest that banks are
associated with investments in less innovative, more traditional activities which
benefit from active screening and monitoring requiring geographic proximity to
investments. The cross-country variations indicate that this is less pronounced in
some countries - those with bank oriented financial systems where long-term relations
between banks and firms may be associated with more innovative investments than
elsewhere. Individual and corporate backed funds are associated with more
4
7. innovative and higher tech industries and greater international diversification. There
is some evidence suggesting that this feature may be more pronounced in bank
oriented systems where there is less emphasis on diversification through financial
instruments and markets (see Allen and Gale, 2000).
The paper is organized as follows. In the next section, we present a
conceptual framework for our empirical analysis and derive a set of testable
hypotheses. Our database and the descriptive statistics on VC in the four countries
are described in Section 3. Section 4 presents the results of the correlation and
regression analyses. Section 5 summarizes the results and their implications for the
hypotheses of Section 2. Section 6 concludes the paper.
5
8. 2. Conceptual Framework
This paper is concerned with the relation between the activities of VC firms
and their financing. Our conjectures are summarized in a series of hypotheses,
denoted by H1 through H10.
In the presence of perfect capital markets, there should be no systematic
relation between sources of finance and activities.
H1: The activities of VC are independent of their sources of finance.
However, in the presence of imperfect information and incomplete contracts,
several reasons have been suggested for why there may be a relation between
financing and activities. Allen (1993) and Allen and Gale (2000) argue that banks can
exploit economies in acquiring information about firms where there is a high degree
of consensus about more traditional investments whose technologies are well
understood. In addition, the liability structure of banks is short-term and they are
exposed to maturity transformation risks from long-term investments. The
requirement to be actively involved in screening and monitoring makes the focus of
their investments local and national.
H2: Bank backed VC firms are inclined towards late stage investments in
domestic, low technology sectors, such as manufacturing.
Like banks, pension funds and insurance companies can exploit economies of
scale in information collection but, in contrast to banks, their liabilities are long term.
Their preferred investment profile might therefore be expected to be early stage but
with a focus on sectors that are subject to little speculative investment. As in the case
of banks, screening and monitoring make the focus of pension fund and insurance
backed VC funds domestic.
H3: Pension fund and insurance company backed VC firms invest in early
stage activities in relatively low technology domestic sectors such as manufacturing
and services.
In contrast, individual investor participation is found where there are few
economies of acquiring information about firms and there are greater benefits from
aggregating the diverse views of many investors about, for example, new
technologies. There are diversification benefits from investing in overseas as well as
domestic markets
6
9. H4: Individual investor backed VC funds are focused on early stage
investments in high technology sectors such as biotechnology, IT and electronics in
global as well as domestic markets.
Companies will look to VC firms as ways of undertaking activities that they
cannot perform in-house. For example, VC vehicles may be used to invest in earlier
stage and higher risk activities than those in which the sponsoring firm is engaged.
H5: Corporate backed VC firms invest in early stage activities in high
technology sectors overseas.
Finally, governments will be concerned with rectifying domestic market
failures, which are most likely to be observed for long-term investments in risky
domestic sectors.
H6: Government backed VC firms invest in early stage activities in domestic
high technology sectors.
The predicted stage, industry and geographical focus of different types of
funds are summarized below:
Source of Funds Stage Sector Geographical Focus
Banks Late Low technology Domestic
Pension funds/ insurance cos. Early Low technology Domestic
Individuals and corporations Early High technology International
Government Early High technology Domestic
If capital markets are internationally integrated so that VC firms can raise
funds from any national market then we would not expect there to be a variation in
these relations across countries. Our next hypothesis assumes internationally
integrated financial markets.
H7: There are similar relations between VC activities and sources of finance
across countries.
In the absence of complete capital market integration then domestic capital
conditions may affect the above relations. In some countries, there appear to be closer
relations between banks and corporate borrowers than in others. It is possible that in
these countries, banks are better placed to fund longer term investments.
7
10. H8: The emphasis of bank backed VC funds on late stage investments is
particularly pronounced in countries where long-term relations between banks and
firms are absent.
In countries with large stock markets, there are more opportunities for
diversification through financial instruments and markets than elsewhere (see Allen
and Gale, 2000). The emphasis of individual and corporate backed VC funds on early
stage, high tech sectors should be particularly pronounced in markets where these
opportunities are less readily available.3
H9: The focus of individual and corporate backed funds on early stage
investments in high tech sectors is particularly in evidence in bank oriented
economies where diversification opportunities are limited.
There will be less of a requirement for governments to correct market failures
in investing in high technology, long-term activities in countries where diversification
opportunities are present.
H10: Government backed funds will be particularly focused on early stage
activities in high technology sectors in bank oriented financial systems.
The differences expected across countries are summarized below:
Financing Source Stock Market Economies Bank Oriented Systems
Bank backed funds More late stage, low tech
investment
Individual and corporate More early stage, high tech
backed funds investment
Government backed funds More early stage, high tech
investment
We examine the above relations as follows. Let αij represent the allocation of
VC firm i’s funds to investment activity j and βis its financing from source s. We will
assume that VC firms in country k operate within the same market but face different
demands from those in other countries. We then examine the relation between
activities and sources of finance in the following equation:
αij = ak + Σsasβis (1)
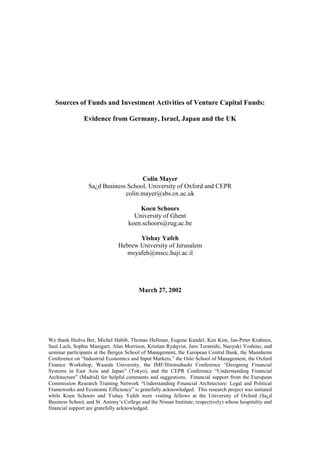
Figure 1 illustrates this. It shows the supply of VC funds (Sij) against returns
(Rjk) for activity j from two funds (i = 1 and 2) that obtain their finance from different
3
A competing conjecture is that individuals invest more in early stages in countries where they are
better able to diversify risk.
8
11. sources in each country but from the same sources in the two countries (k = A and B).
The funds face common demands from entrepreneurs within a country (Djk) but
different demands across countries. If VC activities are independent of sources of
finance then as = 0 and the supply schedules shown in Figure 1 will coincide.
Equation (1) assumes that financial markets are integrated so that similar
activities are associated with financing from similar institutions in different countries.
Equation (2) relaxes this by allowing the relation between VC fund activity and
sources of finance to vary across countries.
αijk = ak + Σs aksβis (2)
Figure 2 shows this for two VC funds that, as in Figure 1, derive their finance
from different sources in each country and the same sources in the two countries but
now the relation between activity and source of finance is allowed to differ across the
two countries.
In the subsequent analysis, we estimate the coefficients as and aks that relate
the sources of finance of VC firms to the allocation of their investments, αij.
3. Data
3.1 Sources and Sample Coverage
Our data are drawn from the individual countries’ venture capital associations.
For Germany and the UK, we use information from the European association of
venture capitalists (evca.com) as well as from their respective local associations in
2000. For Israel, we use data provided by the Israeli association of venture capital
(ivc-online.com, a “snapshot” as of late 2000), and for Japan we rely on a survey
conducted by Nikkei Kinyu (Financial Nikkei) in 1999 on venture capital activities in
Japan.
For Germany, Israel and the UK we have data on all VC funds included in the
associations, although some funds do not fully disclose data on their sources of funds
and investment activities. Our database includes 187 German funds, 119 from Israel
and 140 from the UK.4 For Japan, the survey we use includes information on 62 VC
funds, about half of the extant population of VC funds in Japan according to this
4
Membership of a particular country’s VC association is open to funds operating in that country
irrespective of where the fund is owned or controlled.
9
12. survey. We have no reason to suspect any particular bias in this sample of
respondents. 5
For each venture capital fund we collect information on the fund size
(capitalization) (section 3.2), its corporate form and types of investment (section 3.3),
its sources of funds or ownership (section 3.4), and its investment strategies by stage
of investment (section 3.5), sector (section 3.6) and location of investment (section
3.7).
3.2 Size of Funds
Measuring fund size in terms of assets under management, British venture
capital funds are by far the largest, with mean capital of over 900 million US dollars,
about eight times bigger than the average Japanese fund ($115m)6, and twelve times
bigger than the average Israeli fund ($73m). Although no information on individual
fund size is available for Germany, aggregate statistics suggest that the average
German fund is about the same size as the average Israeli fund, with capital of about
$77m (BVK, 2000). Using medians rather than means suggests that in all countries
the majority of funds are much smaller. In the UK the median VC has capital of
about $140m, compared with only $12m in Japan and about $40m in Israel.
Interestingly, the median Israeli fund is bigger than the median Japanese fund,
although both are much smaller than the median British VC.
3.3 Corporate Form and Types of Investment
VC firms have different legal structures in the four countries of our sample. In
the Japanese sample, all VC funds are joint stock companies, often affiliates of banks
and securities companies.7 In Germany about a quarter of the funds are listed
companies (AG’s), and in the UK limited partnership is the most common form of VC
organization (only about 5 percent of the funds are public companies).
5
A more recent survey conducted by Nikkei Venture Business (2001) provides a larger sample of
about 100 VC funds and other providers of finance, but with only limited information on their
activities. Another survey (conducted by the Asian Venture Capital Journal) reports the existence of
about 220 VC funds in Japan, although only about half of them are active (Lerner and Hardymon,
1999). Further information on the Japanese venture capital industry is available in Sako and Kelly
(2002).
6
This figure is very close to the one reported by the Asian Venture Capital Journal.
7
Sako and Kelly (2002) note that it was only in 1998 that the Japanese government enacted the
Limited Partnership for Venture Capital Investment (Toshi jigyo yugensekinin kumiai ho) which
defined the legal basis for the limited liability of non-general partners.
10
13. Data on types of investment made by funds are available for Germany and
Israel. In both countries, equity is the dominant form of investment, unlike the US,
where convertible debt has been documented as the most common form of VC
finance. Lerner and Hardymon (1999) report that equity finance is common among
Japanese VC funds as well. Loans are provided by about one-sixth of funds in
Germany, and in Israel convertible debt (but not straight debt) is provided by about
half of the funds.8
3.4 Sources of Finance
As noted, all venture capital funds in our Japanese sample are joint stock
companies, and their owners are also their investors and providers of funds. In other
countries, funds report whether they received finance from a certain category of
investors. The data reported below are a snapshot of the stock of sources of finance
used by VC funds, rather than a flow of money in a given period, or financing patterns
over time. With the exception of Japan, our data sources do not provide the precise
amounts of money received from each source, and we therefore define a number of
qualitative and not mutually exclusive dummy variables that equal one if the fund
reports having used a given source of finance. These dummies signify whether there
is bank finance (BANK), finance from pension funds (PENSION), insurance
companies (INSUR), other financial institutions (OTHER), corporate investors
(CORPORATE), private individual investors (INDIVIDUAL) or the government and
regional authorities (GOV’T).
Table 1 displays the sources of external finance for the VC industry in the four
countries.9 There are clearly some important differences between the countries. In
Germany, banks are by far the most important source of finance for the VC industry,
nearly twice as popular as the second largest source of finance, individual investors.
Bank finance is between three and four times more popular in Germany than finance
from industrial corporations or insurance companies. Relying exclusively on bank
finance is also very common in Germany: over 60 percent of the VC funds that raise
8
Cumming (2001) provides evidence that VC contracts in Canada also involve a variety of financial
contracts other than convertible debt. He also makes references to other studies documenting non-
convertible debt contracts between VC and client firms in various countries. Bascha and Walz (2001)
study the organization of the venture capital industry in Germany, and document the use of various
types of financial contracts, which, in their view, depend on the severity of agency problems.
9
In the UK sample, there are 19 funds that rely exclusively on their own or their parent company
funds.
11
14. money from banks use this source exclusively. The equivalent figure for the UK is
about one third, and for Israel about one fifth. Surprisingly, only one seventh of the
Japanese VC funds in our sample rely exclusively on bank finance.
Pension funds are conspicuously absent as a source of venture capital funds in
Germany.10 This is in sharp contrast to the UK where pension funds, other
institutional investors, and individual investors provide funds to as many companies
as banks. Government (typically local authority) funding plays a more important role
in the UK than it does in Germany, and is negligible in the other countries.
Sources of funds for the Israeli VC industry are widespread, with industrial
corporations (typically from the US) being the single most popular source of funds.
Since Japanese funds are organized in the form of joint stock companies (rather than
as limited partnerships) with the owners providing the sources of funds, the figures for
Japan in Table 1 are based on ownership data. Financial institutions other than banks
(e.g. securities firms, credit card or leasing companies and mortgage institutions) are
the single most important category of finance among Japanese funds, followed by
banks and insurance companies.11 It is quite common in Japan for the
owners/providers of finance for Japanese VC funds to be all affiliated with the same
bank-centered corporate group, or to be otherwise related to each other. In over half
of the Japanese funds in our sample, at least three of the five largest shareholder
providers of finance are related to each other or affiliated with the same group.
It is interesting to note from Panel B of Table 1 that VC funds in Germany
tend on average to use fewer sources of funds than do VC’s in other countries, and 61
percent of them rely on a single source of funds. By contrast, funds in Israel, Japan
and the UK tend to use many sources of finance; in particular, about a quarter of the
UK funds report using at least four different sources.
For the UK and Germany, it is possible to compare the figures in Table 1 with
aggregate statistics on sources of finance to VC and private equity (BVK, 2000).
Aggregate figures differ somewhat from the figures in Table 1, because they are based
on the amounts invested rather on whether or not a particular source is used. They
10
In the German data, up to 1999, pension fund contributions to VC funding have been small (BVK,
2000) and are included in the category “other financial institutions.” BVK (2000) suggests that, as a
result of on-going reforms in the German pension system, pension funds have become a much more
important source of funds for the VC industry. Differences between Germany and the UK in this
respect may therefore diminish over the next few years.
11
Some, but not all, of these institutions are partly bank owned, sometimes indirectly. However, we do
not track the ultimate ownership of any of the institutions providing finance to VC companies.
12
15. also reflect a size-weighted average of the sources used by individual funds, whereas
our figures are simple averages. Finally, the aggregate statistics refer to private equity
in general, rather than specifically to VC funds. Nevertheless, aggregate figures
support our conclusions that banks are by far the most important source of finance for
the German VC industry, providing about 40 percent of funds in 1999, far more than
any other source. In the UK, pension funds, banks and insurance companies, in this
order, were the largest sources of finance in 1999, providing 31 percent, 25 percent,
and 14 percent of the funds, respectively.12 The figures in Table 1 are consistent with
those reported for Japan in 2000 by the Asia Venture Capital Journal. According to
these aggregate statistics, corporations (aggregating financial and other), banks and
insurance companies were the most important sources of finance for the Japanese
venture capital industry, providing 48 percent, 25 percent, and 13 percent of all funds,
respectively. By way of comparison, we note that aggregate figures for the US
suggest that the most important sources of funds for the American VC industry in
1999 were pension funds, individuals, corporations, and insurance companies. These
provided 23 percent, 22 percent, 15 percent, and 13 percent of funds in the US,
respectively (NVCA, 2000).
3.5 Type of Investment Activity: Investment Stage
Table 2 provides statistics on the type of investment activity funded by VC’s
in the four countries, characterizing investments by the technological stage at which
they are made, sector and geographical focus. Panel A displays the percentage of VC
funds investing in different stages and their average stage of investment. Funds report
focus on one or more categories of investments (seed, start-up, middle, expansion and
growth, and later stages including refinancing and management buy-ins and buy-
outs), without specifying the precise amounts invested in each activity.
We categorize stages as “early” for seed and start-up, “middle” for middle,
expansion and growth investments, and “late” for later stage investments.13 We also
calculate a simple “average stage” by assigning the value 1 to early, 2 to middle and 3
12
The significance of individual investors as a source of funds is greater in our data than in the
aggregate figures, probably because they provide small amounts of money relative to other,
institutional, sources of funds. Individual investors provided only 4 percent of the total amount of
private equity raised in the UK in 1999.
13
In the Japanese data, the definition of the stages is somewhat different, but the three categories in the
survey correspond to early, middle and later stages. We discuss the possible impact of differences in
the stage definitions between Japan and the other countries in the sample below.
13
16. to late stage investments. We then derive the mean investment stage under the
assumption of equal investment in all stages in which the fund invested positive
amounts.
Panel A of Table 2 shows that the VC industry in Israel provides finance
primarily to companies in early stages of development. Nearly all funds report
positive investments in firms in their early stages. The average stage of investment is
1.4, between “early” and “middle” stages. VC funds in Germany and the UK provide
funding to companies in all stages, with a slight bias towards later stages of
development (their average investment stage is about 2 or “middle”) with the figure
for the UK somewhat higher than that of Germany. In Japan, VC funds are
predominantly directed at companies in (middle and) later stages of development with
very little support for seed and start-up companies. Average stages of financing in
Germany, Israel and Japan are all statistically different from those in the UK. The
distributions of fund investments by stages are also statistically different at the 5
percent level in Israel and Japan from the UK. The proportion of funds investing in
early stages is significantly higher (at the 5 percent level) in Germany than in the UK.
These observations are consistent with evidence from other sources. EVCA
(2000) reports, using aggregate data, that the distribution of investments for UK funds
is centred on firms in middle stages of development, when measured by the number of
companies in which investments are made.14 Jeng and Wells (2000) report that
investment in early stages relative to GDP has been slightly higher in Germany than
in the UK in recent years, although in the past the UK has invested relatively more in
companies in their early stages. BVK (2000) provides figures that are consistent with
these observations as well. IVA (2000) confirm our observation that VC investments
in Israel are focused on early stages. Lerner and Hardymon (1999) describe the
Japanese VC industry as focused on investment in much older firms than its American
counterpart. Seed and startup investments accounted for only 17 percent of all VC
investments in Japan in 1996, whereas expansion and “mezzanine” investment
accounted for over 80 percent.
14
In terms of amounts invested, there seems to be more weight on later stage investments involving
MBI/MBO activities.
14
17. 3.6 Type of Investment Activity: Sector
VC funds record the industries in which they invest. We classify these
investments into one or more of the following five categories of industries: (1) life
sciences, biotechnology and environmental technology; (2) software, communication
and information technology; (3) electronics and semiconductors; (4) manufacturing
(including chemicals); (5) services and other sectors. Again we have (only binary)
information on whether or not a fund invests in a particular sector.
For the purposes of producing summary statistics in Table 2, we construct
industry shares under the assumption of equal investments in all the industries in
which a fund invests positive amounts. Thus, if a fund invests in n industries, each
industry’s share in total investment is calculated as 1/n.
Panel B of Table 2 reports the industry distribution of VC investments in the
three countries. There are substantial differences. VC funds in Israel and Japan
invest predominantly in the IT and software industry, whereas the distribution of
investments across industries in Germany and the UK is more even, and surprisingly
similar to each other. Another surprising result is that, in Japan, the electronics
industry seems to be a less favourable target for VC investments than it is in other
countries, perhaps because R&D in this sector is carried out within large companies.
Manufacturing and chemicals are relatively more popular in Germany and the UK.
Panel C of Table 3 reports the number of industries in which VC funds, on
average, invest in the four countries. Funds are heavily diversified across sectors
(four or more) in the UK and Germany, and somewhat less so in Japan. In Israel,
many more funds are concentrated in only one sector.
Again, the available aggregate statistics are not easily comparable because the
industry classifications used differ between sources and because of our assumption
that funds invest equal amounts in all sectors in which they report positive investment.
Nevertheless, for Israel, IVA (2000) provide figures on VC investments by industry,
which are consistent with ours. For Germany and the UK, BVK (2000) confirms the
relative even spread of investments across sectors, with IT and manufacturing being
important investment targets.15
15
Earlier figures for Japan are somewhat different from ours: Lerner and Hardymon (1999) report
substantial VC investments in financial and other services, as well as in (the not clearly defined)
“consumer products.” The Asian Venture Capital Journal figures (which refer to 2000) are closer to
ours in that they report substantial investment in services, but, like us, find that computer related
15
18. 3.7 Type of Investment Activity: Location
Finally, we gather information on the geographical concentration of fund
investments in specific regions or countries. We describe each fund’s geographical
focus as follows: we assign the number 1 to it if it invests within a single region
within a country; 2, if it invests anywhere in its domestic country; 3 if it operates
within a single continent; 4, if it operates worldwide (i.e. in two or more continents).
Since Japanese companies report the fraction of their investments invested abroad
(with no geographical breakdown), we construct the variable for Japan in a slightly
different way. We assign the number 1 to it if the fund is regional; 2 if it invests in
Japan only; 3 if it invests up to 50 percent of its funds abroad; and 4 if over 50 percent
of the fund’s investment are abroad.
There are again some interesting differences across countries (Panel D of
Table 2). The UK venture capital industry is the most international with 60 percent of
funds having some investments outside the UK. By contrast, two thirds of German
funds invest only in Germany (or in a region within Germany). Aggregate statistics
from BVK record that UK VC funds invest 25 percent of their capital abroad,
compared with 15 percent invested outside Germany by German VC firms. Figures
for Japan (as reported by the Asian Venture Capital Journal) suggest that investment
outside Japan constituted 24 percent of total investment by Japanese VC funds in
2000.
4. The Determinants of VC Investments
In the next three sections we analyze the relation between the sources of
funding and the nature of VC investment activity. Section 4.1 provides partial
correlation coefficients between sources of finance and investment activities. Section
4.2 describes the way in which equations describing the relation between sources of
funding and VC investment have been estimated, and section 4.3 presents the results.
4.1 Partial Correlation Coefficients
Table 3 reports partial correlation coefficients between sources of finance,
country dummies and stage of investment. Correlation coefficients with both
individual stage responses and average stage are reported, and record similar results.
investments constitute about 27 percent of the total amounts invested, far more than the life sciences
and electronics sectors.
16
19. There is a negative association between bank, insurance and pension backed funds
and early stage investment, and a positive correlation with average stage. The
backing of financial intermediaries is therefore associated with the provision of later
stage finance.
There is a positive correlation between corporate and individual investor
backed funds and early stage and a negative correlation with average stage. Corporate
and private individual finance is therefore associated with the provision of earlier
stage investment. There is a positive, albeit statistically insignificant, association of
government backing and average stage, implying that government finance is
associated with later stage financing.
In regard to the location of the VC funds, the positive correlation of early
stage and the negative correlation of average stage with the Israeli dummy means that
Israeli funds are early stage investors. Conversely, in Japan and to a lesser extent in
the UK, Japanese and UK funds tend to be later stage investors. German funds are
most closely correlated with middle stages.
4.2 Estimating the Determinants of VC Investments
We examine three measures of activity (aij): stage of investment, sector and
geographical focus. For investment stage, three specifications are used. In the first,
the choice of early and late stages is estimated as seemingly unrelated zero-one Probit
regressions. The advantage of this approach is that no assumptions have to made
about relative proportions of investment in the three stages. The second method uses
the average stage of investment, computed under the assumption of equal allocations
to stages in which funds report positive investment. Since the averages are bounded
between one and three we use Tobit regressions for this. The third specification is
based on ordering all possible combinations of stages of investment reported by the
funds to generate “stage rank” as follows:
Fund Investment Strategy Stage Rank
Early Middle Late
1 0 0 1
1 1 0 2
1 0 1 3
1 1 1 3
0 1 0 3
0 1 1 4
0 0 1 5
17
20. This ranking scheme is valid assuming equal investments in the various stages,
although it is sufficient to require only that investments in the various stages will not
be “too different.” We estimate this using Ordered Probit.16
Several tests of robustness of the results were performed. Firstly, there might
be a degree of heterogeneity in VC firms operating in different sectors. To investigate
this, we disaggregated the regressions on average stage by sector. Secondly, an
underlying assumption in this analysis is that VC firms in a particular country operate
in a single market and face common demand functions, so that different investment
strategies reflect different fund attributes (such as the sources of finance) rather than
different demand conditions. This is a questionable assumption for funds that operate
at a regional rather than a national or international level. We therefore repeated the
above regressions excluding VC firms that said that they operate at a regional level.
For sectors, we estimate the sector share variables (maintaining the
assumption of equal investment) as a system of four seemingly unrelated equations.17
Finally, we estimate the determinants of the geographical focus of investment using
Ordered Probit regressions, where the dependent variable takes values between 1 and
4, as described above.
4.3 Regression Results
4.3.1 Investment Stage
Table 4 presents Probit, Tobit and Ordered Probit estimates of equation (1) on
stages of investment. Results are very consistent across the three methodologies.
Panel A reports the Probits on early and late stage, estimated as seemingly unrelated
regressions. They reveal that bank, insurance and pension backed funds are
associated with later stage investments, whereas funds that obtain finance from
corporations and individuals are more likely to invest in early stages. Panel B of
Table 4 reports Tobit estimates of the determinants of average stage (which lies
between 1 and 3) and Ordered Probit estimates of the stage rank. According to both
specifications, bank finance is associated with later stage investment. VC funds that
rely on pension funds also tend to favour later stages, whereas funds obtaining money
from individual investors prefer earlier stages.
16
In our data, 17 percent of the funds are in Stage Rank 1, 14 percent in 2, 34 percent in 3, 24 percent
in 4, and 11 percent in 5.
17
We also estimated the four equations separately using Tobit regressions and obtained very similar
results.
18
21. In the left column of Panel B, shifting from individual to bank finance is
associated with an increase of 0.26 in average investment stage. This compares with a
standard deviation of between 0.45 in average stage (in Germany) and 0.76 (in Japan).
The shift therefore represents between 0.3 and 0.6 of a standard deviation. The within
country relations between investment stage and source of funds are therefore
economically as well as statistically significant.
Several tests of robustness of the results were performed (Panel C of Table 4).
Firstly, there might be a high degree of heterogeneity in VC firms operating in
different sectors. To investigate this, we disaggregated the regressions on average
stage by sector. There was a high degree of consistency across sectors. A positive
relation was found between average stage and bank, insurance and pension fund
backing in all sectors. Conversely, a negative relation between corporate, private and
government backing and stage was observed in all sectors.
Secondly, to test the assumption that firms operate in a single market within a
country and face common demand functions, we disaggregated the regression by
geographical focus. In particular, we repeated the regression on average stage
excluding VC firms that stated that they operate at a regional rather than a national or
international level. 93 observations are dropped but the results remain almost
identical to those reported above. The size and significance of coefficients is little
affected with the exception that pension funds are no longer significant at the 10
percent level.
4.3.2 Sector
Table 5 reports seemingly unrelated regressions of VC investments by sector
on sources of finance. The table suggests that VC funds that rely on pension funds and
insurance companies for finance (“institutional investors”) are less likely to focus on
IT and software, and more likely to favour the life-sciences (insurance backed funds)
and manufacturing (pension backed funds). In contrast, corporate and individual
backed funds are less likely to invest in manufacturing and more likely to direct more
resources to IT and software. Institutional backed funds therefore tend to invest in
relatively low technology manufacturing in preference to high technology IT and
19
22. software and corporate and individual backed funds in high technology IT and
software in preference to low technology manufacturing.18
4.3.3 Geographical Focus
We examine the relation between geographical focus of VC investment and
sources of finance using Ordered Probit regressions (Table 6). We observe that bank
backed VC funds tend to invest more locally, whereas funds backed by industrial
corporations, insurance companies and individual investors tend to invest more
abroad. Government funding is particularly closely associated with local and national
investment.
4.3.4 Country Specific Estimates
To date, we have imposed the same coefficients on sources of financing in
different countries. Table 7 reports the results of average stage and stage rank in
regressions with country-specific coefficients. The tendency of banks to favour later
stage investments is observed in British and Israeli VC funds but not in German and
Japanese funds, where bank finance is not associated with significantly earlier or later
stage investment. The coefficients on the bank variable in Israel and the UK are
economically as well as statistically significant amounting to 0.65 and 0.59 of a
standard deviation in investment stage respectively in the two countries. The
tendency of individual and corporate backed VC firms to invest in early stage
activities is observed in Germany and Japan but not in Israel and the UK. The
association of government backed funds with early stage activities is observed in
Germany but not in the UK. Overall, a hypothesis that the four country coefficients
are equal can be rejected at the one percent level.
Thus far, we have not made reference to the coefficients on the country
dummies in the regressions. In Table 4, the country dummy variables for Japan and
Israel are highly statistically significant. The Israeli VC industry is associated with
18
Note that these conclusions are based on investment shares, calculated under the equal investment
assumption. It is also possible to estimate Probit regressions, where the dependent variable is a dummy
which equals one if a fund invests in a particular sector. We do not present the results of this
specification because we believe the industry shares shed more light on the relative fund focus between
different industries.
20
23. earlier stage of investment than that in the UK, and Japan appears to be associated
with later stage investment than the UK.19
Similarly in Table 5, the country dummy variables are significant (relative to
the UK) and suggest an Israeli and Japanese focus on IT, software and life sciences,
away from manufacturing. German VC investment is directed more towards the life
sciences and away from investment in IT and software.
Finally, Table 6 shows that funds in the UK tend to invest more abroad than
funds in other countries. In contrast to investment stage and sector preference, the
coefficients on some funding sources are of similar magnitude to the country dummy
variables suggesting that source of finance is as critical a determinant of location of
investment as the country of operation of a fund.
5 Summary and Implications of Results
In summary, we find that:
Investment activities of VC funds as measured by stage, sector and
geographical focus of investments are closely associated with sources of finance.
We therefore reject Hypothesis 1 that the activities of VC firms are independent of
their sources of finance.
Bank backed funds invest in late stage, domestic activities. We therefore fail
to reject Hypothesis 2.
Pension and insurance-backed funds invest in late stage activities in low
technology sectors. We therefore do not reject Hypothesis 3’s prediction about
sector but we do reject its prediction about stage.
19
MBI/MBO activity is extremely rare in Japan, suggesting that some of the funds classified as
engaged in financing later stage activities in the Japanese survey could perhaps be classified as
supporting middle staged companies according to the other data sources. Lerner and Hardyman’s
(1999) description of VC activity in Japan is also consistent with this view. We therefore convert all
Japanese funds with later stage investments into middle stage, and find no significant changes in the
coefficients on the sources of finance, although this change does render the Japan country dummy
statistically insignificant (i.e. not different from Britain). Nevertheless, it is clear that early stage
investments (in seed and start-up companies) are extremely rare in the Japanese funds included in our
data. It should also be noted that the Japan dummy is negative in both Probit regressions (Panel A of
Table 4), and positive in the other stage specifications. This is due to the fact that Japanese funds
typically invest in only one stage (middle or late) whereas British funds invest in many stages.
Therefore, when estimating the determinants of investment in a particular stage separately, as in the
Probit specification, it appears that UK funds invest more than Japanese funds in both early and later
activities.
21
24. Corporate and individual backed VC firms invest in early stage, high
technology activities globally rather than domestically. We do not therefore reject
Hypothesis 4 or Hypothesis 5.
Governments invest in domestic activities. We therefore do not reject
Hypothesis 6.
With the exception of Hypothesis 1, it has not therefore been possible to reject any
of the hypotheses described in section 2 though we do not find a difference in stage of
investment between bank backed and pension and insurance backed funds. Instead,
financial intermediary-backed funds all invest in relatively late stage activities.
In relation to the theories on financial market integration, we find that:
Relations between sources of finance and VC activities differ across countries,
leading to a rejection of Hypothesis 7 of capital market integration.
The association of bank backed VC firms with later stage activity than
investment by other VC firms is weaker in the bank based systems of Germany
and Japan, relative to the UK (although it is present in Israel, whose financial
system is also dominated by banks). We cannot therefore reject Hypothesis 8.
The association of individual backed activities with early stage investment is a
feature of the bank-based systems of Germany and Japan. The association of
corporate backed activities with early stage is observed in Germany (although not
Japan). We cannot therefore reject Hypothesis 9.
The relation of government backed funds to early stage investment is found in
bank dominated Germany, in which less diversification opportunities through
financial instruments and markets are present. We cannot therefore reject
Hypothesis 10.
Finally, it is worth noting the positive association between pension backed
funds with stage in the UK and of insurance backed funds with stage in Germany. In
neither country does the long-term nature of their liabilities encourage long-term
finance. In contrast, Japanese funds financed by non-bank financial institutions invest
relatively more in earlier stages. Regulation may bear on these observations in so far
as it encourages institutions to pursue conservative investment strategies to meet, for
example, “prudent man” and, in the UK, “Minimum Funding” requirements.20
20
Minimum Funding Requirements stipulate the conduct of pension funds and the basis on which their
liabilities should be valued.
22
25. One possible explanation for the significance of the dummy variables in the
activity equations is the violation of the integrated financial market assumption.
However, as Table 7 records, even once the restriction of common coefficients on the
financing variables in the investment stage regressions is relaxed, the intercept terms
on the individual country equations are significantly different. The interaction of
financial systems with the relation of financing sources to activities cannot explain the
pronounced country differences.
There are several factors that could account for the country dummy variables
and intercepts. These include differences in the availability of investment projects,
i.e. the supply of entrepreneurs rather than finance, alternative sources of finance for
innovative activity in different countries, for example business angels, differences in
the location of innovative activity within as against outside firms, tax incentives, legal
differences, and macroeconomic conditions. The advantage of fund level data is that
it controls for the large number of other factors that might influence investment
activity and which afflict more macroeconomic analyses. However, by the same
token they do not readily lend themselves to an assessment of the influence of other
factors.
It is therefore beyond the scope of the paper to provide much evidence on this.
However, one piece of evidence that suggests that entrepreneurial demand may be a
key factor comes from the geographical focus of funds. When we concentrate on
funds that operate in an international market and therefore face common worldwide
demand functions (i.e. with the geographical focus variable equals 4), then the
country of origin of the fund as well as it sources of funds are generally insignificant
determinants of the preferred investment stage.21
6. Conclusions
The purpose of this article has been to examine the financing of the VC
industry in four countries where VC funds are important or growing and to establish
21
The one exception is the Israel dummy, which remains significantly negative. This probably reflects
the fact that Israeli VC funds are not as global as international funds in other countries. We also
examine the investment strategies of six funds operating in both Germany and UK, and another fund
operating in both the UK and Japan, finding no significant difference in the stage of investment of
these funds in different countries. This could reflect a similarity of demand conditions in Germany and
the UK, or perhaps reflect a general investment strategy adopted by funds irrespective of where they
operate.
23
26. how institutional differences in the financing of VC firms relate to the types of
activities in which they invest.
To answer this question, we have collected a unique data source on VC firms
and their sources of finance and provided cross-country controls that allow us to
identify the impact of sources of finance on VC activity. We use the data to test a
range of theories concerning the relation between sources of finance and investment
activities.
We have documented substantial differences across countries in the sources of
funds used to finance VC investment and substantial differences in the activities in
which they invest. We have found that the sources of finance are significantly related
to the differences in VC activities within countries. In particular, financial
intermediary-backed funds are associated with late stage investments in relatively low
technology industries. In contrast, individual and corporate backed funds invest in
early stage, higher technology industries. Their investment is also more globally
focused than that of financial intermediary backed funds.
We have argued that these observations are consistent with theories that
emphasize the different information collected by financial intermediaries and market
participants. They are also in line with patterns of relations that would be expected of
funds operating in countries with different bank-firm relations and opportunities for
risk spreading through financial markets and instruments. Consistent with a role for
government in correcting market failures, public sector funding is associated with
investment in domestic early stage activities.
However, we have also found that sources of finance only account for a
portion of the differences in VC activities across countries. A range of other factors
including demand for funds (i.e. supply of entrepreneurs), alternative sources of
entrepreneurial finance (for example, business angels) and different corporate
organization of entrepreneurial activities may also be relevant.
24
27. References
Allen, F. (1993), “Stock Markets and Resource Allocation,” in C. Mayer and X.
Vives, (eds.), Capital Markets and Financial Intermediation (Cambridge University
Press, Cambridge).
Allen, F. and D. Gale (1999), “Diversity of Opinion and Financing of New
Technologies,” Journal of Financial Intermediation, Vol. 8, pp. 68-89.
Allen and Gale (2000), Comparing Financial Systems (MIT Press, Cambridge, MA).
Asian Venture Capital Journal (2002), “The 2002 Guide to Venture Capital in Asia,”
(available on the Internet at asiaventure.com).
Bascha, A. and U. Walz (2001), “Financing Practices in the German Venture Capital
Industry: An Empirical Assessment,” unpublished manuscript, University of
Tubingen.
Black, S. and R. Gilson (1998), “Venture Capital and the Structure of Capital
Markets: Banks versus Stock Markets,” Journal of Financial Economies, Vol. 47, pp.
243-277.
BVK (2000), Venture Capital in Europa 1999 (German Venture Capital Association,
Berlin).
Blass, A. and Y. Yafeh (2001), “Vagabond Shoes Longing to Stray: Why Foreign
Firms List in the US,” Journal of Banking and Finance, Vol. 25, pp. 555-572.
Botazzi, L. and M. Da Rin, M. (2001), “Venture Capital in Europe: Euro.nm and the
Financing of European Innovative Firms,” forthcoming, Economic Policy.
Carlin, W. and C. Mayer (1999), “Finance, Investment and Growth,” CEPR
Discussion Paper No. 2223.
Cornelli, F. and O. Yosha (1997), “Stage Financing and Convertible Debt,” CEPR
Discussion Paper No. 1735.
Cumming, D. (2001), “United States Venture Capital Financial Contracting: Evidence
from Investments in Foreign Securities,” unpublished manuscript, University of
Alberta.
EVCA (2000), Mid-Year Survey, January-June 2000, (European Venture Capital
Association, available on the Internet at evca.com).
Gompers, P. and J. Lerner (1998), “What Drives Venture Capital Fundraising?”
Brookings Papers on Economic Activity (Microeconomics), pp. 149-192.
Gompers, P. and J. Lerner (1999), The Venture Capital Cycle, (Cambridge, MA, MIT
Press).
25
28. Gompers, P. and J. Lerner (2001), “The Venture Capital Revolution,” Journal of
Economic Perspectives, Vol. 15, pp. 145-168.
Hellman, T. (1998), “The Allocation of Control Rights in VC Contracts,” RAND
Journal of Economics, Vol. 29, pp. 57-76.
Hellman, T. and M. Puri (2000), “The Interaction between Product Market and
Financing Strategy: The Role of Venture Capital,” Review of Financial Studies, Vol.
13, pp. 959-984.
IVA (2000), 2000 Yearbook, (Israel Venture Capital Association, Tel Aviv).
Jeng, L. and P. Wells (2000), “The Determinants of Venture Capital Funding:
Evidence Across Countries,” Journal of Corporate Finance, Vol. 6, pp. 241-289.
Kaplan, S. and P. Stromberg (2000), “Financial Contracting Theory Meets the Real
World: An Empirical Analysis of Venture Capital Contracts,” NBER Working Paper
No. 7660.
Lerner, J. and F. Hardymon (1999), Venture Capital and Private Equity: A Case Book
(New York, Wiley and Sons Press), Chapter 19.
Manigart, S. and H. Sapienza (2000), “Venture Capital and Growth,” in D. Sexton
and H. Landstrom (eds.), The Blackwell Handbook of Entrepreneurship (Blackwell,
Oxford).
NVCA (2000), NVCA Yearbook 2000 (National Venture Capital Association,
Arlington, VA).
Osnabrugge, M. (1998), “The Financing of Entrepreneurial Firms in the UK: A
Comparison of Venture Capital and Business Angels Investment Procedures,”
unpublished D. Phil. Thesis, Hertford College, Oxford.
Sako, M. and W. Kelly (2002) “Governance of Start-ups in Japan: What Scope for
Change?” Working Paper, Saïd Business School, Oxford.
26
29. Figures 1 and 2
The returns on investment in activity j are on the vertical axis and the amount of capital is on the
horizontal axis. The downward sloping “demand” schedules describe the pool of available projects
requiring funds in two countries, A and B. The a’s are the amounts provided by each fund in each
country. In Figure 1, the two supply schedules describe a case in which in each country there are two
VC funds (i=1 and 2) which differ from each other in their investment preferences, but are identical
across countries. In Figure 2, funds in each country have investment preferences, which differ between
funds and across counties.
Figure 1
Rjk
S1j
S2j
DjB
DjA
α1jA α1jB α2jA α2jB αijk
Figure 2
Rjk
S1jA
S1jB
S2jB
S2jA
DjB
DjA
α1jA α1jB α2jA α2jB αijk
27
30. Table 1: Sources of External Funds for the VC Industry
This table reports sources of funds of VC firms in Germany, Israel, Japan and the UK based on binary
responses to a question of whether or not a particular fund uses a certain source. Panel A records the
fraction of funds that report using a given source. Panel B records the percentage of funds using one,
two, three, or four or more sources. * and ** denote mean values which are statistically different from
those of the UK at the 10 and 5 percent levels, respectively.
Panel A: Fraction of Funds using Particular Sources
Funds Banks Insurance Pension Corporate Individual Gov’t Other
Companies Funds Investors Investors Institutions
Germany 187 0.59** 0.22** 0** 0.16** 0.36* 0.09** 0.21**
Israel 119 0.51 0.11** 0.02** 0.60** 0.36 0.01** 0.54
Japan 62 0.56 0.43 0** 0.27 0.21** 0.03** 0.80**
UK 140 0.44 0.36 0.49 0.26 0.45 0.24 0.55
Panel B: Percentage of Funds using Particular Number of Sources
1 2 3 4 or more
Germany 61% 22% 9% 8%
Israel 38% 27% 21% 15%
Japan 21% 39% 29% 11%
UK 35% 16% 15% 24%
28
31. Table 2: Characteristics of VC Investments
Table 2 reports the characteristics of VC investments based on discrete responses by firms. Panel A
refers to investment stage and reports the proportion of funds investing in different investment stages:
“early” refers to seed and start-up, “middle” to expansion and growth, and “late” to later stages. Panel
B refers to the sectors of investment using five groups of industries: life sciences, IT and software,
electrical and semi-conductors, manufacturing and chemicals, and other industries (further discussion
of the calculation used to derive these results is in the text). Panel C records the percentage of funds
investing in one, two, three, or four or more industries. Panel D records the regional, national or
international nature of investments by funds. It reports the percentage of funds investing in a region
within a country, in several regions within a country, within a single continent, or in two or more
continents (or in the case of Japan if more than 50 percent is invested abroad). * and ** denote mean
values which are statistically different from those of the UK at the 10 and 5 percent levels, respectively.
Panel A: VC Investments by Stage
Funds Early Middle Late Average
(1) (2) (3) Stage
Germany 187 0.68** 0.89* 0.74 2.0**
Israel 98 0.93** 0.49** 0.28** 1.4**
Japan 57 0.15** 0.19** 0.65** 2.5**
UK 140 0.48 0.84 0.80 2.1
Panel B: VC Investments by Industry
Funds Life IT and Elect and Mnfg and Other
Sciences Software Semi-C. Chemicals Industries
Germany 183 0.21** 0.23 0.16 0.23 0.17
Israel 95 0.24** 0.51** 0.16 0.08** 0.01**
Japan 56 0.26** 0.49** 0.05** 0.06** 0.14
UK 140 0.17 0.26 0.15 0.24 0.19
Panel C: Percentage of Funds Investing in Certain Number of Industries
1 2 3 4 or more
Germany 9% 16% 15% 60%
Israel 39% 23% 17% 21%
Japan 3% 12% 42% 42%
UK 11% 7% 7% 75%
29
32. Panel D: VC Investments by Region
Percentage of Funds Investing in Different Locations
Funds Region within Country only County and Worldwide Average
Country Continent
(1) (2) (3) (4)
Germany 187 34% 32% 18% 17% 2.18*
Israel 97 1% 67% 25% 7% 2.35*
Japan 55 13% 44% 38% 5% 2.28*
UK 139 16% 24% 35% 24% 2.68
30
33. Table 3: Partial Correlation Coefficients
Table 3 reports partial correlation coefficients and p-values (in brackets) of sources of funds (bank,
insurance companies, pension funds, corporate, individual, government and other) and location of VC
firms with stage (early, middle, late and average stage), sector of investments (life sciences, IT and
software, electrical and semi-conductors, manufacturing and chemicals) and geographical focus (the
percentage of funds investing in a region within a country, in several regions within a country, within a
single continent, or in two or more continents (or in the case of Japan if more than 50 percent is
invested abroad).
Avg. IT and Geog.
Early Middle Late Stage Life Sciences Software Electronics Manufactng. Focus
BANK -0.05 0.11 0.09 0.10 0.10 0.09 0.10 0.06 -0.12
(0.25) (0.01) (0.06) (0.03) (0.03) (0.04) (0.03) (0.21) (0.00)
INSURANCE -0.16 -0.00 0.08 0.18 0.13 -0.07 -0.03 0.09 0.14
(0.00) (0.97) (0.06) (0.00) (0.00) (0.13) (0.54) (0.06) (0.00)
PENSION -0.15 0.10 0.15 0.16 0.18 0.10 0.19 0.24 0.16
(0.00) (0.02) (0.00) (0.00) (0.00) (0.02) (0.00) (0.00) (0.00)
CORPORATE 0.13 -0.14 -0.20 -0.16 -0.14 -0.03 -0.10 -0.16 0.21
(0.00) (0.00) (0.00) (0.00) (0.00) (0.58) (0.03) (0.00) (0.00)
INDIVIDUAL 0.11 0.00 -0.07 -0.09 -0.09 -0.05 -0.04 -0.06 0.10
(0.02) (0.96) (0.13) (0.04) (0.06) (0.27) (0.41) (0.19) (0.02)
GOVERNMT -0.03 0.09 0.07 0.04 0.09 -0.07 0.15 0.15 -0.08
(0.50) (0.05) (0.10) (0.35) (0.05) (0.15) (0.00) (0.00) (0.07)
OTHER -0.09 -0.19 -0.02 0.06 -0.05 0.08 -0.10 -0.07 0.10
(0.03) (0.00) (0.63) (0.16) (0.29) (0.07) (0.02) (0.09) (0.03)
GERMANY 0.07 0.32 0.17 0.05 0.20 -0.14 0.18 0.23 -0.14
(0.10) (0.00) (0.00) (0.20) (0.00) (0.00) (0.00) (0.00) (0.00)
ISRAEL 0.35 -0.25 -0.41 -0.46 -0.20 0.03 -0.15 -0.32 -0.03
(0.00) (0.00) (0.00) (0.00) (0.00) (0.46) (0.00) (0.00) (0.43)
JAPAN -0.34 -0.39 0.01 0.30 -0.14 -0.01 -0.36 -0.24 -0.01
(0.00) (0.00) (0.83) (0.00) (0.00) (0.75) (0.00) (0.00) (0.88)
UK -0.19 0.18 0.21 0.19 0.09 0.13 0.20 0.24 0.19
(0.00) (0.00) (0.00) (0.00) (0.04) (0.00) (0.00) (0.00) (0.00)
31
34. Table 4: Estimates of the Determinants of the Stage of Investment
This table reports the results of pooled regressions of stages of investment on sources of funds reported
by individual VC funds with individual country intercepts. Panel A reports the results of seemingly
unrelated Probit estimates where the dependent variables are EARLY and LATE. The left column of
Panel B reports the results of Tobit regressions of average stage of investments of a fund (which lies
between 1 and 3). The right column of Panel B reports the results of an ordered Probit on Stage rank,
which lies in the range of 1 to 5. Panel C reports similar regressions for several sub-samples. The
country-specific intercepts are measured relative to the UK. * and ** denote statistical significance at
the 10 and 5 percent levels, respectively
Panel A: Seemingly Unrelated Probit Estimates
EARLY LATE
CONSTANT 0.02 0.88**
(0.17) (0.19)
BANK -0.05 0.25*
(0.13) (0.13)
INSURANCE -0.18 0.06
(0.16) (0.16)
PENSION -0.45* 0.31
(0.25) (0.27)
OTHER 0.06 0.08
(0.15) (0.15)
CORPORATE 0.26 -0.31**
(0.16) (0.15)
INDIVIDUAL 0.31** -0.29**
(0.14) (0.13)
GOVERNMENT 0.09 -0.13
(0.20) (0.21)
GERMANY 0.33* -0.24
(0.18) (0.20)
ISRAEL 1.32** -1.35**
(0.27) (0.23)
JAPAN -1.17* -0.57**
(0.27) (0.26)
N 482 482
LOG LIKELIHOOD -475.2
32
35. Panel B: Tobit and Ordered Probit Estimates
Avg. Stage Stage Rank
(Tobit) (O. Probit)
CONSTANT 2.04** Not
(0.09) applicable
BANK 0.14** 0.19*
(0.07) (0.10)
INSURANCE 0.11 0.17
(0.08) (0.12)
PENSION 0.24** 0.38**
(0.12) (0.19)
OTHER -0.01 -0.01
(0.07) (0.11)
CORPORATE -0.10 -0.17
(0.08) (0.12)
INDIVIDUAL -0.12* -0.21**
(0.07) (0.12)
GOVERNMENT -0.11 -0.16
(0.11) (0.16)
GERMANY -0.10 -0.20
(0.10) (0.15)
ISRAEL -0.79** -1.16**
(0.12) (0.18)
JAPAN 0.65** 0.97**
(0.14) (0.21)
N 482 482
PSEUDO R2 0.14 0.11
33
37. Table 5: The Determinants of Industry Investment Shares
This table reports the results of seemingly unrelated OLS regressions of the share of a fund’s
investment in five different sectors (life sciences, IT and software, electronics and semiconductors,
manufacturing and services and other sectors) on sources of funds. * and ** denote statistical
significance at the 10 and 5 percent levels, respectively
Life Sciences IT and Software Electronics Manufacturing
CONSTANT 0.15** 0.29** 0.14** 0.70**
(0.03) (0.03) (0.02) (0.05)
BANK -0.03 0.01 0.02 0.01
(0.02) (0.02) (0.01) (0.02)
INSURANCE 0.07** -0.06* -0.02 0.02
(0.02) (0.03) (0.02) (0.02)
PENSION 0.06 -0.11** 0.02 0.08**
(0.04) (0.05) (0.02) (0.03)
OTHER -0.01 0.02 -0.00 0.00
(0.02) (0.03) (0.14) (0.02)
CORPORATE 0.00 0.05* 0.01 -0.04**
(0.02) (0.03) (0.14) (0.02)
INDIVIDUAL -0.03 0.06** 0.00 -0.05**
(0.02) (0.03) (0.01) (0.02)
GOV’T -0.01 -0.04 0.02 0.01
(0.03) (0.04) (0.02) (0.02)
JAPAN 0.10** 0.18** -0.09** -0.16**
(0.04) (0.05) (0.03) (0.03)
GERMANY 0.07** -0.09** 0.02 0.02
(0.03) (0.04) (0.02) (0.02)
ISRAEL 0.11* 0.16** 0.00 -0.12**
(0.03) (0.04) (0.02) (0.03)
N 474
R2 0.05 0.21 0.07 0.25
35
38. Table 6: Ordered Probit Estimates of the Determinants of Geographical Focus
The table reports the results of regressions of geographical focus (which takes values between 1 and 4,
where 1 corresponds to investment within a region within a country, 2 to investment in one country, 3
to investment in a continent, and 4 to worldwide investments) on sources of funds. * and ** denote
statistical significance at the 10 and 5 percent levels, respectively
BANK -0.21**
(0.10)
INSURANCE 0.28**
(0.12)
PENSION -0.02
(0.20)
OTHER 0.02
(0.11)
CORPORATE 0.56**
(0.12)
INDIVIDUAL 0.19*
(0.10)
GOVERNMENT -0.70**
(0.17)
GERMANY -0.52**
(0.15)
ISRAEL -0.52**
(0.18)
JAPAN -0.41*
(0.20)
N 478
PSEUDO R2 0.06
36
39. Table 7: Regressions with Country-Specific Coefficients
This table reports the results of regressions of stages of investment on sources of funds reported by
individual VC funds with individual country intercepts and coefficients. For each country, the left
column reports the results of Tobit regressions of average stage of investments of a fund (which lies
between 1 and 3). The right column reports the results of an ordered Probit on Stage rank, which lies
in the range of 1 to 5. The constants for Germany, Japan and Israel are measured relative to the UK. *
and ** denote statistical significance at the 10 and 5 percent levels, respectively
GERMANY ISRAEL JAPAN UK
Avg. Stage Stage Avg. Stage Avg. Stage Avg. Stage
(Tobit) Rank Stage Rank Stage Rank Stage Rank
(O. (Tobit) (O. (Tobit) (O. (Tobit) (O.
Probit) Probit) Probit) Probit)
CONSTANT 2.06** 0.08 1.01** -1.43** 3.68** 2.62** 1.98** N/A
(0.11) (0.24) (0.18) (0.33) (0.34) (0.55) (0.10)
BANK -0.02 -0.04 0.34** 0.43* -0.18 -0.27 0.30** 0.47**
(0.11) (0.18) (0.17) (0.26) (0.22) (0.33) (0.12) (0.20)
INSURANCE 0.21* 0.34* 0.12 0.25 0.07 0.08 -0.02 -0.07
(0.12) (0.20) (0.24) (0.38) (0.21) (0.32) (0.16) (0.25)
PENSION N/A N/A -0.09 -0.22 N/A N/A 0.32** 0.55**
(0.37) (0.57) (0.16) (0.25)
OTHER 0.08 0.16 -0.01 0.00 -0.91** -1.39** -0.07 -0.11
(0.12) (0.20) (0.16) (0.26) (0.30) (0.47) (0.14) (0.21)
CORPORATE -0.27** -0.47** 0.07 0.04 0.08 0.15 -0.25 -0.38
(0.13) (0.22) (0.16) (0.25) (0.24) (0.37) (0.16) (0.25)
INDIVIDUAL -0.17 -0.31* 0.05 0.05 -0.58 -0.93** -0.09 -0.18
(0.11) (0.17) (0.18) (0.27) (0.25) (0.38) (0.12) (0.20)
GOV -0.29* -0.49* N/A N/A N/A N/A 0.13 0.21
(0.16) (0.26) (0.15) (0.23)
N 482
PSEUDO R2
Tobit 0.18
Probit 0.14
37