SlideShare a Scribd company logo
1 of 13
Download to read offline
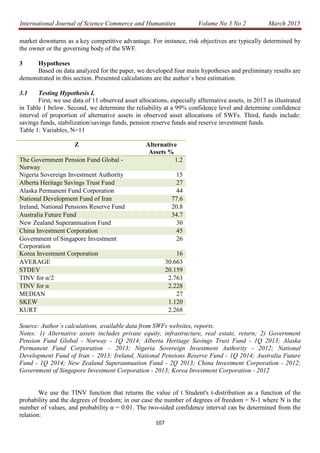
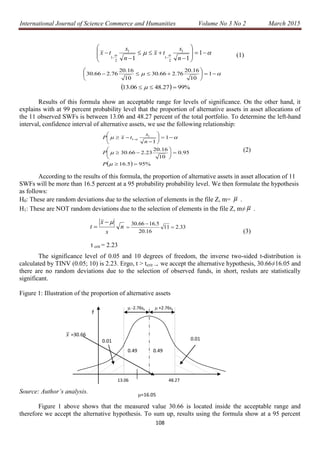
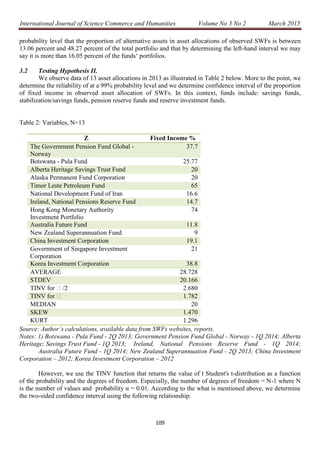
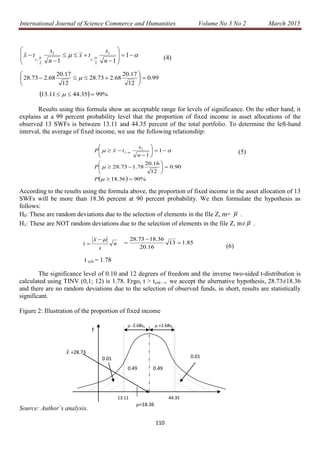
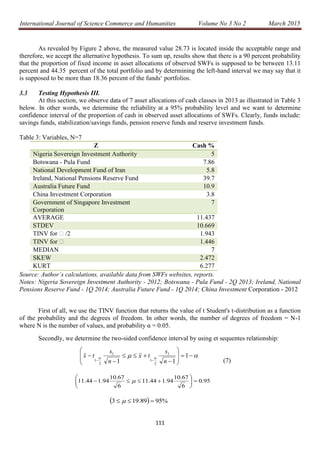
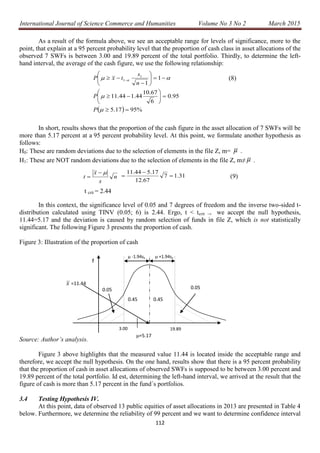
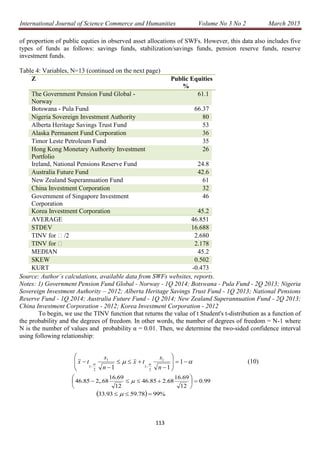
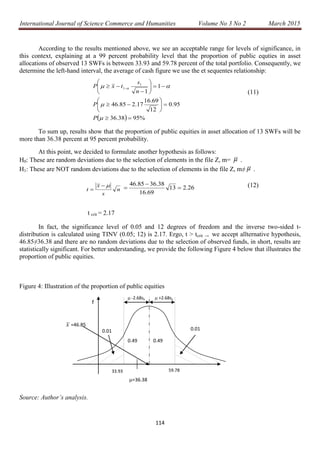
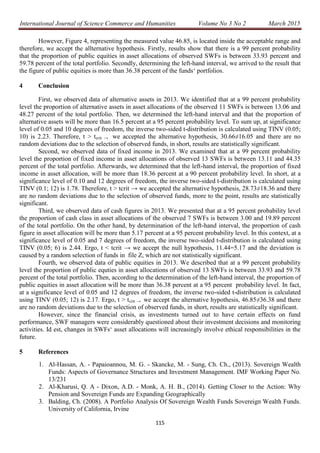
International Journal of Science Commerce and Humanities Volume No 3 No 2 March 2015
104
SOVEREIGN WEALTH FUNDS:
STATISTICAL ANALYSIS OF ASSET ALLOCATIONS IN 2013
ANTONIA FICOVA
PhD Student at Faculty of Economics and Business
Pan European University, Bratislava
antoniaficova@zoho.com*
+421 918 216 381
*Corresponding Author
JURAJ SIPKO
Institute of Economic Research, Slovak Academy of Science, Šancova 56, 811 05 Bratislava,
Slovakia
Assoc. Prof. at Faculty of Economics and Business, Pan-European University, 851 05 Bratislava,
Slovakia, juraj.sipko@gmail.com, +421 918 664 613
Abstract:
The paper explores the proportions of asset allocations of observed Sovereign Wealth Funds in 2013.
Portfolios include: savings funds, stabilization/savings funds, pension reserve funds and reserve investment
funds. First, we determine confidence interval of the proportion of alternative assets in 11 observed
portfolios at a 99 percent probability level. Second, we determine confidence interval of the proportion of
fixed income in 13 observed asset allocation of SWFs at a 99 percent probability level. Third, we determine
determine confidence interval of proportion of cash figure in 7 observed portfolios at 95 percent probability.
Finally, we determine confidence interval of the proportion of public equities in 13 observed asset
allocations at a 99 percent probability level. In this context, proportions of each of these classes are
provided through statistical analysis and illustrations.
Keywords: Sovereign Wealth Fund, Portfolio, Asset Allocations.
JEL classification: C12, F21, G11.
1 Introduction
Sovereign Wealth Funds (SWFs) are long-term investments that follow either a strategic approach to
ensure the supply of natural resources and technology or that transfer wealth to future generations through
transformation or accumulation of assets. Fundamentally, SWFs are seeking four things. First, high returns,
motivated by the opportunity cost of excess official reserves invested in risk-free assets. Second, the funds
save wealth for future generations, when the natural sources will be exhausted, meaning no surplus revenues
for the country. Third, countries dependent on commodity exports set up funds for absorbing the shock of
fluctuations in global market prices of oil, indicating a stabilization function. Fourth, these funds promote
domestic industries through their investments.
Viewed in this light, SWF activities can be summarized in the following two points. First, SWF
motives can be strategic rather than purely financial as SWFs may seek to gather ownership rights in
sensitive sectors such as telecommunications, media, energy, seaport, financial services and dual use
industries and later use these assets to support the domestic economy in the case of war. Second, SWFs may
acquire proprietary information only available to corporate insiders and transfer this corporate intelligence to
International Journal of Science Commerce and Humanities Volume No 3 No 2 March 2015
105
a rival company in their own country. As a result, SWF´s investments have received increasing attention due
to the drastic increase in their size and visibility and due to their potential to threaten the stability of firms.
Exempli gratia, according to International Monetary Fund (IMF) estimates, SWFs are growing at
a rate of USD 800–900 billion p.a. In other words, since 2008, assets under management of SWFs rose by
76 percent to USD 5.4 trillion in October 2013. This is as a result of the investment activities of these funds.
Moreover, the sheer size of SWF is also obvious from the comparison with top stock exchanges worldwide.
According to the International Sovereign Wealth Fund Institute 2012 report, comparing the assets under
management of these funds with the market capitalization of the top 16 stock exchanges of the world
suggests that the AUM of SWFs are more than that of all the exchanges except NYSE Euronext (US) with
the market capitalization of USD 12.6 trillion. On the other hand, the USD 5.4 trillion of AUM of SWFs is
more than twice the market capitalization of the Indian National Stock Exchange (NSE) and the Bombay
Stock Exchange (BSE) put together according to the data of the World Federation of Exchanges in 2012.
It is important to mention a number of studies on the subject of SWFs since 2007. In particular,
Beck, R. and Fidora, M. (2008) provided a background on the impact of sovereign wealth funds (SWFs) on
the global financial markets and the impact of a transfer of traditional foreign exchange reserves to SWFs on
global capital flows. Baptista, A. M. (2008) presented that portfolios lie away from the mean–variance
frontier under fairly general conditions. More to the point, he found that the composition and location of
such portfolios can differ notably from those on the mean–variance frontier. Miracky et. al. (2009) studied
investment patterns and performance of SWFs.
Bernstein, S., Lerner, J. and A. Schoar (2009) provide the direct private equity investment strategies
across SWFs and their relationship to the funds’ organizational structures. Brown, A., Papaioannou, M. and
Petrova, I. (2010) examined some basic macrofinancial linkages of an SWF's strategic asset allocation
(SAA) strategies with regard to the government budget, monetary policy and exchange rate movements.
Kunzel, P., Lu, Y., Petrova, I. and Pihlman, J. (2011) argued for the continued importance of SWFs as a
stabilizer in international capital markets for regular macro-risk assessments of the sovereign.
Johan, S., Knill, A.M. and Mauck, N. (2013) examined the investments of 19 SWFs around the
world from 1991 through 2010. They found that investments are similar to other institutional investors and
are less likely to invest in private equity versus public equity internationally. Al-Hassan, A., Papaioannou,
M., Skancke, M. and Chih Sung, Ch. (2013) described in a systematic (normative) manner the salient
features of a SWF’s governance structure in relation to its objectives and investment management that can
ensure its efficient operation and enhance its financial performance.
Bodie, Z. and Briere, M. (2013) addressed the management of sovereign wealth from the perspective
of the theory of contingent claims; moreover, in the sovereign’s balance sheet, they framed sovereign fund
management as an asset-liability management (ALM) problem. Lee, B. S. and In, F. H. (2013) investigated
that sovereign wealth funds’ poor performance is partly due to their poor information about the target firms.
They applied Granger-causality tests. Gilligan, G., O'Brien, J. and Bowman, M. (2014) focused on the role
that they might play in domestic investment in order to stimulate the growth of social capital and nation
building in their home country as well as progress made by SWFs themselves in the improvement of the
standards and processes of governance.
Gelb, A., Tordo, S., Halland, H., Arfaa, N. and Smith, G. (2014) proposed some basic elements of a
conceptual framework to create a system of checks and balances to help ensure that the SWFs do not
undermine macroeconomic management. Al-Kharusi, Q. A, Dixon, A. D. and Monk, A. H. B. (2014)
pointed out that SWFs are expanding geographically, moving their organizations into the markets they found
appealing, rather than waiting for intermediaries to come to them, reflecting a broader trend towards the
professionalization of pension and sovereign fund investment organizations.
The research objectives of this paper are presented as follows: What are the current proportions of
each asset allocation of SWFs? What is the mean of reliability of the following classes: alternative assets,
fixed income, cash and public equties in portfolios of SWFs?
International Journal of Science Commerce and Humanities Volume No 3 No 2 March 2015
106
1.2 Data and Methodology
This paper examines the proportion of each class of portfolio of SWFs. We provide statistical
analysis of 11 observed alternative assets, analysis of 13 observed fixed income, analysis of 7 observed cash
figures and finally we analyze public equties of 13 observed portfolios in 2013. Observed portfolios of
SWFs include savings, stabilization/savings, pension reserve and reserve investment funds. This has been
done by illustrations using available data from official websites of funds and over fifty annual and quarterly
reports and author´s calculations due the fact that most of the funds do not provide data to the public. In
addition, we present the estimates using the ‘Student’ t-test distribution with (N−1) degrees of freedom and
determination of the left-hand interval. The methods to be deployed in this paper are qualitative and
quantitative analysis and comparative research that requires active intervention by the researcher.
2 Literature Review
There are many different definitions of a SWF. On the one hand, the EU Commission (2008)
describes SWFs as state-owned investment vehicles which manage a diversified portfolio of domestic and
international financial assets. On the other hand, McKinsey & Company (2007) presents that SWFs are
funded by the Central Bank’s reserves, aimed to maximize the returns within manageable risk bands. The
technical definition of SWFs is that they are government-owned and controlled (directly or indirectly), have
no outside beneficiaries or liabilities and that they invest their assets, either in the short or long-term,
according to the interests and objectives of the sovereign sponsor, argued Monk (2009).
2.1 Asset Allocations
More to the point, strategic asset allocation is based on long-term risk and return objectives as well as
investor expectations regarding asset class returns, volatility and correlations. In addition to this, the
principal factors driving these allocation are as follows. First, Asset Class Diversification, meaning
allocations to a wide range of asset classes, which diversifies away the risk to the portfolio of individual
asset classes that underperform. Second, Geographic Diversification, meaning allocations to a wide range of
different geographic regions, which diversifies away the risk to the portfolio of different regions and
countries that underperform. Third, illiquidity premium, meaning allocations to asset classes that are illiquid
in nature but are expected to generate superior returns over a long-term horizon. Fourth, growth, meaning
allocations to asset classes expected to capture economic growth including emerging markets equity, small
cap equity and private equity. Fifth, inflation protection, meaning allocations to assets that are more likely
to protect against longer term inflation including inflation-linked bonds, commodities and infrastructure.
In the case of strategic investment, the SWFs‘ strategy will be very opportunistic and will also
involve opaque transactions using Sovereign Wealth Enterprises. On the other hand, asset management for
wealth accumulating SWFs is more comparable to that of endowment funds. More to the point, both investor
types share some common characteristics such as the long-term perspective and the obligation to increase or
at least to preserve the capital stock. Nevertheless, SWFs differ in terms of their exposure to funding risk,
stemming from the price uncertainty of natural resources. To sum up, to account for this dependency, the
SWF sponsor has two options: hedging or diversification. However, the portfolio shall be diversified in
order to reduce concentration risk among government money market funds and managed accounts.
The question is: What is the purpose of diversification? More to the point, diversification is to
provide reasonable assurance that no single fund has a disproportionate exposure to the SWFs‘ assets that
may adversely impact the aggregate results of the SWF or impede its liquidity. Viewed in this light,
diversification is an important tool of risk management and can mitigate the volatility and uncertainty
inherent in substantial exposure to risk assets and as such, the SWF will seek to be diversified.
If we look at determinants in the setting up of an appropriate investment, the first determinant is the
objective of the SWF and the second determinant is the risk-bearing capacity of the SWF. In this regard, the
longer a fund‘s investment horizon is, the higher its capacity to take on investment risks. On the other hand,
a short investment horizon signals a lower scope for exposure to risky assets. To sum up, investment funds
with a strong intergenerational savings orientation tend to view their long horizon and ability to ride through
International Journal of Science Commerce and Humanities Volume No 3 No 2 March 2015
107
market downturns as a key competitive advantage. For instance, risk objectives are typically determined by
the owner or the governing body of the SWF.
3 Hypotheses
Based on data analyzed for the paper, we developed four main hypotheses and preliminary results are
demonstrated in this section. Presented calculations are the author´s best estimation.
3.1 Testing Hypothesis I.
First, we use data of 11 observed asset allocations, especially allternative assets, in 2013 as illustrated
in Table 1 below. Second, we determine the reliability at a 99% confidence level and determine confidence
interval of proportion of alternative assets in observed asset allocations of SWFs. Third, funds include:
savings funds, stabilization/savings funds, pension reserve funds and reserve investment funds.
Table 1: Variables, N=11
Z Alternative
Assets %
The Government Pension Fund Global -
Norway
1.2
Nigeria Sovereign Investment Authority 15
Alberta Heritage Savings Trust Fund 27
Alaska Permanent Fund Corporation 44
National Development Fund of Iran 77.6
Ireland, National Pensions Reserve Fund 20.8
Australia Future Fund 34.7
New Zealand Superannuation Fund 30
China Investment Corporation 45
Government of Singapore Investment
Corporation
26
Korea Investment Corporation 16
AVERAGE 30.663
STDEV 20.159
TINV for α/2 2.763
TINV for α 2.228
MEDIAN 27
SKEW 1.120
KURT 2.268
Source: Author´s calculations, available data from SWFs websites, reports.
Notes: 1) Alternative assets includes private equity, infrastructure, real estate, return; 2) Government
Pension Fund Global - Norway - 1Q 2014; Alberta Heritage Savings Trust Fund - 1Q 2013; Alaska
Permanent Fund Corporation – 2013; Nigeria Sovereign Investment Authority - 2012; National
Development Fund of Iran – 2013; Ireland, National Pensions Reserve Fund - 1Q 2014; Australia Future
Fund - 1Q 2014; New Zealand Superannuation Fund - 2Q 2013; China Investment Corporation - 2012;
Government of Singapore Investment Corporation - 2013; Korea Investment Corporation - 2012
We use the TINV function that returns the value of t Student's t-distribution as a function of the
probability and the degrees of freedom; in our case the number of degrees of freedom = N-1 where N is the
number of values, and probability α = 0.01. The two-sided confidence interval can be determined from the
relation:
International Journal of Science Commerce and Humanities Volume No 3 No 2 March 2015
108
(1)
Results of this formula show an acceptable range for levels of significance. On the other hand, it
explains with at 99 percent probability level that the proportion of alternative assets in asset allocations of
the 11 observed SWFs is between 13.06 and 48.27 percent of the total portfolio. To determine the left-hand
interval, confidence interval of alternative assets, we use the following relationship:
(2)
According to the results of this formula, the proportion of alternative assets in asset allocation of 11
SWFs will be more than 16.5 percent at a 95 probability probability level. We then formulate the hypothesis
as follows:
H0: These are random deviations due to the selection of elements in the file Z, m=  .
H1: These are NOT random deviations due to the selection of elements in the file Z, m≠  .
(3)
t crit = 2.23
The significance level of 0.05 and 10 degrees of freedom, the inverse two-sided t-distribution is
calculated by TINV (0.05; 10) is 2.23. Ergo, t ˃ tcrit → we accept the alternative hypothesis, 30.66≠16.05 and
there are no random deviations due to the selection of observed funds, in short, resluts are statistically
significant.
Figure 1: Illustration of the proportion of alternative assets
Source: Author’s analysis.
Figure 1 above shows that the measured value 30.66 is located inside the acceptable range and
therefore we accept the alternative hypothesis. To sum up, results using the formula show at a 95 percent
  












1
11
1
2
1
1
2
1 n
s
tx
n
s
tx
 





 1
10
16.20
76.266.30
10
16.20
76.266.30
  %9927.4806.13  
  %955.16
95.0
10
16.20
23.266.30
1
1
1
1















 


 
P
P
n
s
txP
n
s
x
t

 33.211
16.20
5.1666.30



x =30.66
48.27
 +2.76sx -2.76sx
0.490.49
0.01
f
0.01
13.06
=16.05
International Journal of Science Commerce and Humanities Volume No 3 No 2 March 2015
109
probability level that the proportion of alternative assets in asset allocations of observed SWFs is between
13.06 percent and 48.27 percent of the total portfolio and that by determining the left-hand interval we may
say it is more than 16.05 percent of the funds‘ portfolios.
3.2 Testing Hypothesis II.
We observe data of 13 asset allocations in 2013 as illustrated in Table 2 below. More to the point, we
determine the reliability of at a 99% probability level and we determine confidence interval of the proportion
of fixed income in observed asset allocation of SWFs. In this context, funds include: savings funds,
stabilization/savings funds, pension reserve funds and reserve investment funds.
Table 2: Variables, N=13
Z Fixed Income %
The Government Pension Fund Global -
Norway
37.7
Botswana - Pula Fund 25.77
Alberta Heritage Savings Trust Fund 20
Alaska Permanent Fund Corporation 20
Timor Leste Petroleum Fund 65
National Development Fund of Iran 16.6
Ireland, National Pensions Reserve Fund 14.7
Hong Kong Monetary Authority
Investment Portfolio
74
Australia Future Fund 11.8
New Zealand Superannuation Fund 9
China Investment Corporation 19.1
Government of Singapore Investment
Corporation
21
Korea Investment Corporation 38.8
AVERAGE 28.728
STDEV 20.166
TINV for /2 2.680
TINV for  1.782
MEDIAN 20
SKEW 1.470
KURT 1.296
Source: Author´s calculations, available data from SWFs websites, reports.
Notes: 1) Botswana - Pula Fund - 2Q 2013; Government Pension Fund Global - Norway - 1Q 2014; Alberta
Heritage; Savings Trust Fund - 1Q 2013; Ireland, National Pensions Reserve Fund - 1Q 2014;
Australia Future Fund - 1Q 2014; New Zealand Superannuation Fund - 2Q 2013; China Investment
Corporation – 2012; Korea Investment Corporation – 2012
However, we use the TINV function that returns the value of t Student's t-distribution as a function
of the probability and the degrees of freedom. Especially, the number of degrees of freedom = N-1 where N
is the number of values and probability α = 0.01. According to the what is mentioned above, we determine
the two-sided confidence interval using the following relationship:
International Journal of Science Commerce and Humanities Volume No 3 No 2 March 2015
110
(4)
Results using this formula show an acceptable range for levels of significance. On the other hand, it
explains at a 99 percent probability level that the proportion of fixed income in asset allocations of the
observed 13 SWFs is between 13.11 and 44.35 percent of the total portfolio. To determine the left-hand
interval, the average of fixed income, we use the following relationship:
(5)
According to the results using the formula above, the proportion of fixed income in the asset allocation of 13
SWFs will be more than 18.36 percent at 90 percent probability. We then formulate the hypothesis as
follows:
H0: These are random deviations due to the selection of elements in the file Z, m=  .
H1: These are NOT random deviations due to the selection of elements in the file Z, m≠  .
(6)
t crit = 1.78
The significance level of 0.10 and 12 degrees of freedom and the inverse two-sided t-distribution is
calculated using TINV (0,1; 12) is 1.78. Ergo, t ˃ tcrit → we accept the alternative hypothesis, 28.73≠18.36
and there are no random deviations due to the selection of observed funds, in short, results are statistically
significant.
Figure 2: Illustration of the proportion of fixed income
Source: Author’s analysis.
  












1
11
1
2
1
1
2
1 n
s
tx
n
s
tx
99.0
12
17.20
68.273.28
12
17.20
68.273.28 





 
  %9935.4411.13  
  %9036.18
90.0
12
16.20
78.173.28
1
1
1
1















 


 
P
P
n
s
txP
n
s
x
t

 85.113
16.20
36.1873.28



=18.36
x =28.73
44.35
 +2.68sx -2.68sx
0.490.49
0.01
f
0.01
13.11
International Journal of Science Commerce and Humanities Volume No 3 No 2 March 2015
111
As revealed by Figure 2 above, the measured value 28.73 is located inside the acceptable range and
therefore, we accept the alternative hypothesis. To sum up, results show that there is a 90 percent probability
that the proportion of fixed income in asset allocations of observed SWFs is supposed to be between 13.11
percent and 44.35 percent of the total portfolio and by determining the left-hand interval we may say that it
is supposed to be more than 18.36 percent of the funds‘ portfolios.
3.3 Testing Hypothesis III.
At this section, we observe data of 7 asset allocations of cash classes in 2013 as illustrated in Table 3
below. In other words, we determine the reliability at a 95% probability level and we want to determine
confidence interval of the proportion of cash in observed asset allocations of SWFs. Clearly, funds include:
savings funds, stabilization/savings funds, pension reserve funds and reserve investment funds.
Table 3: Variables, N=7
Z Cash %
Nigeria Sovereign Investment Authority 5
Botswana - Pula Fund 7.86
National Development Fund of Iran 5.8
Ireland, National Pensions Reserve Fund 39.7
Australia Future Fund 10.9
China Investment Corporation 3.8
Government of Singapore Investment
Corporation
7
AVERAGE 11.437
STDEV 10.669
TINV for /2 1.943
TINV for  1.446
MEDIAN 7
SKEW 2.472
KURT 6.277
Source: Author´s calculations, available data from SWFs websites, reports.
Notes: Nigeria Sovereign Investment Authority - 2012; Botswana - Pula Fund - 2Q 2013; Ireland, National
Pensions Reserve Fund - 1Q 2014; Australia Future Fund - 1Q 2014; China Investment Corporation - 2012
First of all, we use the TINV function that returns the value of t Student's t-distribution as a function
of the probability and the degrees of freedom. In other words, the number of degrees of freedom = N-1
where N is the number of values, and probability α = 0.05.
Secondly, we determine the two-sided confidence interval by using et sequentes relationship:
(7)
  












1
11
1
2
1
1
2
1 n
s
tx
n
s
tx
95.0
6
67.10
94.144.11
6
67.10
94.144.11 





 
  %9589.193  
International Journal of Science Commerce and Humanities Volume No 3 No 2 March 2015
112
As a result of the formula above, we see an acceptable range for levels of significance, more to the
point, that explain at a 95 percent probability level that the proportion of cash class in asset allocations of the
observed 7 SWFs is between 3.00 and 19.89 percent of the total portfolio. Thirdly, to determine the left-
hand interval, the average of the cash figure, we use the following relationship:
(8)
In short, results shows that the proportion of the cash figure in the asset allocation of 7 SWFs will be
more than 5.17 percent at a 95 percent probability level. At this point, we formulate another hypothesis as
follows:
H0: These are random deviations due to the selection of elements in the file Z, m=  .
H1: These are NOT random deviations due to the selection of elements in the file Z, m≠  .
(9)
t crit = 2.44
In this context, the significance level of 0.05 and 7 degrees of freedom and the inverse two-sided t-
distribution calculated using TINV (0.05; 6) is 2.44. Ergo, t < tcrit → we accept the null hypothesis,
11.44=5.17 and the deviation is caused by random selection of funds in file Z, which is not statistically
significant. The following Figure 3 presents the proportion of cash.
Figure 3: Illustration of the proportion of cash
Source: Author’s analysis.
Figure 3 above highlights that the measured value 11.44 is located inside the acceptable range and
therefore, we accept the null hypothesis. On the one hand, results show that there is a 95 percent probability
that the proportion of cash in asset allocations of observed SWFs is supposed to be between 3.00 percent and
19.89 percent of the total portfolio. Id est, determining the left-hand interval, we arrived at the result that the
figure of cash is more than 5.17 percent in the fund´s portfolios.
3.4 Testing Hypothesis IV.
At this point, data of observed 13 public equities of asset allocations in 2013 are presented in Table 4
below. Furthermore, we determine the reliability of 99 percent and we want to determine confidence interval
  %9517.5
95.0
6
67.10
44.144.11
1
1
1
1















 


 
P
P
n
s
txP
n
s
x
t

 31.17
67.12
17.544.11



=5.17
x =11.44
19.89
 +1.94sx -1.94sx
0.450.45
0.05
f
0.05
3.00
International Journal of Science Commerce and Humanities Volume No 3 No 2 March 2015
113
of proportion of public equties in observed asset allocations of SWFs. However, this data also includes five
types of funds as follows: savings funds, stabilization/savings funds, pension reserve funds, reserve
investment funds.
Table 4: Variables, N=13 (continued on the next page)
Z Public Equities
%
The Government Pension Fund Global -
Norway
61.1
Botswana - Pula Fund 66.37
Nigeria Sovereign Investment Authority 80
Alberta Heritage Savings Trust Fund 53
Alaska Permanent Fund Corporation 36
Timor Leste Petroleum Fund 35
Hong Kong Monetary Authority Investment
Portfolio
26
Ireland, National Pensions Reserve Fund 24.8
Australia Future Fund 42.6
New Zealand Superannuation Fund 61
China Investment Corporation 32
Government of Singapore Investment
Corporation
46
Korea Investment Corporation 45.2
AVERAGE 46.851
STDEV 16.688
TINV for /2 2.680
TINV for  2.178
MEDIAN 45.2
SKEW 0.502
KURT -0.473
Source: Author´s calculations, available data from SWFs websites, reports.
Notes: 1) Government Pension Fund Global - Norway - 1Q 2014; Botswana - Pula Fund - 2Q 2013; Nigeria
Sovereign Investment Authority – 2012; Alberta Heritage Savings Trust Fund - 1Q 2013; National Pensions
Reserve Fund - 1Q 2014; Australia Future Fund - 1Q 2014; New Zealand Superannuation Fund - 2Q 2013;
China Investment Corporation - 2012; Korea Investment Corporation - 2012
To begin, we use the TINV function that returns the value of t Student's t-distribution as a function of
the probability and the degrees of freedom. In other words, the number of degrees of freedom = N-1 where
N is the number of values and probability α = 0.01. Then, we determine the two-sided confidence interval
using following relationship:
(10)  












1
11
1
2
1
1
2
1 n
s
tx
n
s
tx
99.0
12
69.16
68.285.46
12
69.16
68,.285.46 





 
  %9978.5993.33  
International Journal of Science Commerce and Humanities Volume No 3 No 2 March 2015
114
According to the results mentioned above, we see an acceptable range for levels of significance, in
this context, explaining at a 99 percent probability level that the proportion of public equties in asset
allocations of observed 13 SWFs is between 33.93 and 59.78 percent of the total portfolio. Consequently, we
determine the left-hand interval, the average of cash figure we use the et sequentes relationship:
(11)
To sum up, results show that the proportion of public equities in asset allocation of 13 SWFs will be
more than 36.38 percent at 95 percent probability.
At this point, we decided to formulate another hypothesis as follows:
H0: These are random deviations due to the selection of elements in the file Z, m=  .
H1: These are NOT random deviations due to the selection of elements in the file Z, m≠  .
(12)
t crit = 2.17
In fact, the significance level of 0.05 and 12 degrees of freedom and the inverse two-sided t-
distribution is calculated using TINV (0.05; 12) is 2.17. Ergo, t ˃ tcrit → we accept allternative hypothesis,
46.85≠36.38 and there are no random deviations due to the selection of observed funds, in short, results are
statistically significant. For better understanding, we provide the following Figure 4 below that illustrates the
proportion of public equities.
Figure 4: Illustration of the proportion of public equities
Source: Author’s analysis.
  %9538.36
95.0
12
69.16
17.285.46
1
1
1
1















 


 
P
P
n
s
txP
n
s
x
t

 26.213
69.16
38.3685.46



=36.38
x =46.85
59.78
19,89
 +2.68sx -2.68sx
0.490.49
0.01
f
0.01
33.93
International Journal of Science Commerce and Humanities Volume No 3 No 2 March 2015
115
However, Figure 4, representing the measured value 46.85, is located inside the acceptable range and
therefore, we accept the allternative hypothesis. Firstly, results show that there is a 99 percent probability
that the proportion of public equities in asset allocations of observed SWFs is between 33.93 percent and
59.78 percent of the total portfolio. Secondly, determining the left-hand interval, we arrived to the result that
the figure of public equities is more than 36.38 percent of the funds‘ portfolios.
4 Conclusion
First, we observed data of alternative assets in 2013. We identified that at a 99 percent probability
level the proportion of alternative assets in asset allocations of the observed 11 SWFs is between 13.06 and
48.27 percent of the total portfolio. Then, we determined the left-hand interval and that the proportion of
alternative assets will be more than 16.5 percent at a 95 percent probability level. To sum up, at significance
level of 0.05 and 10 degrees of freedom, the inverse two-sided t-distribution is calculated using TINV (0.05;
10) is 2.23. Therefore, t ˃ tcrit → we accepted the alternative hypothesis, 30.66≠16.05 and there are no
random deviations due to the selection of observed funds, in short, results are statistically significant.
Second, we observed data of fixed income in 2013. We examined that at a 99 percent probability
level the proportion of fixed income in asset allocations of observed 13 SWFs is between 13.11 and 44.35
percent of the total portfolio. Afterwards, we determined that the left-hand interval, the proportion of fixed
income in asset allocation, will be more than 18.36 percent at a 90 percent probability level. In short, at a
significance level of 0.10 and 12 degrees of freedom, the inverse two-sided t-distribution is calculated using
TINV (0.1; 12) is 1.78. Therefore, t ˃ tcrit → we accepted the alternative hypothesis, 28.73≠18.36 and there
are no random deviations due to the selection of observed funds, more to the point, results are statistically
significant.
Third, we observed data of cash figures in 2013. We presented that at a 95 percent probability level
the proportion of cash class in asset allocations of the observed 7 SWFs is between 3.00 and 19.89 percent
of the total portfolio. On the other hand, by determination of the left-hand interval, the proportion of cash
figure in asset allocation will be more than 5.17 percent at a 95 percent probability level. In this context, at a
significance level of 0.05 and 7 degrees of freedom, the inverse two-sided t-distribution is calculated using
TINV (0.05; 6) is 2.44. Ergo, t < tcrit → we accept the null hypothesis, 11.44=5.17 and the deviation is
caused by a random selection of funds in file Z, which are not statistically significant.
Fourth, we observed data of public equities in 2013. We described that at a 99 percent probability
level the proportion of public equties in asset allocations of observed 13 SWFs is between 33.93 and 59.78
percent of the total portfolio. Then, according to the determination of the left-hand interval, the proportion of
public equities in asset allocation will be more than 36.38 percent at a 95 percent probability level. In fact,
at a significance level of 0.05 and 12 degrees of freedom, the inverse two-sided t-distribution is calculated
using TINV (0.05; 12) is 2.17. Ergo, t ˃ tcrit → we accept the alternative hypothesis, 46.85≠36.38 and there
are no random deviations due to the selection of observed funds, in short, results are statistically significant.
However, since the financial crisis, as investments turned out to have certain effects on fund
performance, SWF managers were considerably questioned about their investment decisions and monitoring
activities. Id est, changes in SWFs‘ asset allocations will increasingly involve ethical responsibilities in the
future.
5 References
1. Al-Hassan, A. - Papaioannou, M. G. - Skancke, M. - Sung, Ch. Ch., (2013). Sovereign Wealth
Funds: Aspects of Governance Structures and Investment Management. IMF Working Paper No.
13/231
2. Al-Kharusi, Q. A - Dixon, A.D. - Monk, A. H. B., (2014). Getting Closer to the Action: Why
Pension and Sovereign Funds are Expanding Geographically
3. Balding, Ch. (2008). A Portfolio Analysis Of Sovereign Wealth Funds Sovereign Wealth Funds.
University of California, Irvine
International Journal of Science Commerce and Humanities Volume No 3 No 2 March 2015
116
4. Baptista, A.M., (2008). Optimal delegated portfolio management with background risk. In:
Journal of Banking & Finance, vol. 32, pp. 977-985
5. Beck, R. - Fidora, M. (2008). The impact of sovereign wealth funds on global financial markets.
ECB Occasional paper series No 91/July 2008
6. Bernstein, S., Lerner, J. and A. Schoar, (2009). The Investment Strategies of Sovereign Wealth
Funds. Harvard Business School Working Paper
7. Blundell-Wignall, A., Yu-Wei Hu - Yermo, J., (2008). Sovereign Wealth and Pension Fund
Issues
8. Bodie, Z. - Briere, M., (2013). Optimal Asset Allocation for Sovereign Wealth Funds: Theory
and Practice. Boston U. School of Management Research Paper No. 2013-11
9. Bortolotti, B., Fotak, V., Megginson, W.L. and W. Miracky, (2010). Sovereign Wealth Fund
Investment Patterns and Performance. FEEM Working Paper No. 22.2009
10. Brown, A. - Papaioannou, M. - Petrova, I. (2010). Macrofinancial Linkages of the Strategic Asset
Allocation of Commodity-Based SWF´s. IMF Working Paper WP/10/9:32
11. Gelb, A. - Tordo, S. - Halland, H. - Arfaa, N.- Smith, G., (2014). Sovereign Wealth Funds and
Long-Term Development Finance: Risks and Opportunities. World Bank Policy Research
Working Paper No. 6776.
12. Gilligan, G. - O'Brien, J. - Bowman, M., (2014). Sovereign Wealth Funds: The Good Guy
Investment Actors? CIFR Paper No. 021/2014
13. Johan, S., Knill, A. and N. Mauck, (2013). Determinants of Sovereign Wealth Fund Investment
in Private Equity vs Public Equity. In: Journal of International Business Studies, vol. 44, pp. 155-
172
14. Kunzel, P.- Lu, Y. - Petrova, I. - Pihlman, J. (2011). Investment Objectives of Sovereign Wealth
Funds - A Shifting Paradigm. IMF, Working Papers, WP/11/19:17
15. Lee, B. S. - In, F. H., (2013). Do Sovereign Wealth Funds Make Informed Investment Decisions?
16. Miracky, W.- Bortolotti, B. (2009). Weathering the Storm. Fondazione Eni Enrico Mattei,
Monitor Group, SWF Annual Report 2008
17. Monk, A.H.B. (2009). Recasting the Sovereign Wealth Fund Debate: Trust, Legitimacy, and
Governance. University of Oxford

More Related Content

What's hot

Myanmar Migrant Workers Remittance Data Analysis
Myanmar Migrant Workers Remittance Data AnalysisMyanmar Migrant Workers Remittance Data Analysis
Myanmar Migrant Workers Remittance Data AnalysisMYO AUNG Myanmar
 
Opportunity to Foreign Investor in Kosovo
Opportunity to Foreign Investor in KosovoOpportunity to Foreign Investor in Kosovo
Opportunity to Foreign Investor in Kosovonakije.kida
 
Funding working capital requirements
Funding working capital requirementsFunding working capital requirements
Funding working capital requirementssambar52
 
Dynamics of mutual funds in relation to stock market
Dynamics of mutual funds in relation to stock marketDynamics of mutual funds in relation to stock market
Dynamics of mutual funds in relation to stock marketAlexander Decker
 
Impact Of Usd Credit Interest Rates, Libor Rates, Net Sales, Turkey’s Tourism...
Impact Of Usd Credit Interest Rates, Libor Rates, Net Sales, Turkey’s Tourism...Impact Of Usd Credit Interest Rates, Libor Rates, Net Sales, Turkey’s Tourism...
Impact Of Usd Credit Interest Rates, Libor Rates, Net Sales, Turkey’s Tourism...inventionjournals
 
Migration of capital, transnationalization of the world economy jung boram
Migration of capital, transnationalization of the world economy jung boramMigration of capital, transnationalization of the world economy jung boram
Migration of capital, transnationalization of the world economy jung boramiriotas
 
Taking the Investor Perspective with SenseMaker®
Taking the Investor Perspective with SenseMaker® Taking the Investor Perspective with SenseMaker®
Taking the Investor Perspective with SenseMaker® Marcus Guest
 
Mechanisms for Financing Investment Projects through Commercial Bank Loans
Mechanisms for Financing Investment Projects through Commercial Bank LoansMechanisms for Financing Investment Projects through Commercial Bank Loans
Mechanisms for Financing Investment Projects through Commercial Bank LoansYogeshIJTSRD
 
An empirical study on the relationship between stock market index and the nat...
An empirical study on the relationship between stock market index and the nat...An empirical study on the relationship between stock market index and the nat...
An empirical study on the relationship between stock market index and the nat...Alexander Decker
 
Fic en it-chart book presentation_14-jan-13
Fic en it-chart book presentation_14-jan-13Fic en it-chart book presentation_14-jan-13
Fic en it-chart book presentation_14-jan-13Franco Fornasari
 
Final paper ppt mridul arora banking & finance
Final paper ppt mridul arora banking & finance Final paper ppt mridul arora banking & finance
Final paper ppt mridul arora banking & finance Mridul Arora
 
Enhancing financial connectivity between Asia and Europe
Enhancing financial connectivity between Asia and EuropeEnhancing financial connectivity between Asia and Europe
Enhancing financial connectivity between Asia and EuropeJohn Smith
 
A first analysis and profiling of social enterprises in Sweden prepared by th...
A first analysis and profiling of social enterprises in Sweden prepared by th...A first analysis and profiling of social enterprises in Sweden prepared by th...
A first analysis and profiling of social enterprises in Sweden prepared by th...Stockholm Institute of Transition Economics
 
INTERNATIONAL EQUITY ANALYSIS UNDER IFRS_A CASE STUDY OF LONDON BASED SELL-SI...
INTERNATIONAL EQUITY ANALYSIS UNDER IFRS_A CASE STUDY OF LONDON BASED SELL-SI...INTERNATIONAL EQUITY ANALYSIS UNDER IFRS_A CASE STUDY OF LONDON BASED SELL-SI...
INTERNATIONAL EQUITY ANALYSIS UNDER IFRS_A CASE STUDY OF LONDON BASED SELL-SI...Randolph Perry
 

What's hot (20)

Myanmar Migrant Workers Remittance Data Analysis
Myanmar Migrant Workers Remittance Data AnalysisMyanmar Migrant Workers Remittance Data Analysis
Myanmar Migrant Workers Remittance Data Analysis
 
Opportunity to Foreign Investor in Kosovo
Opportunity to Foreign Investor in KosovoOpportunity to Foreign Investor in Kosovo
Opportunity to Foreign Investor in Kosovo
 
Funding working capital requirements
Funding working capital requirementsFunding working capital requirements
Funding working capital requirements
 
Dynamics of mutual funds in relation to stock market
Dynamics of mutual funds in relation to stock marketDynamics of mutual funds in relation to stock market
Dynamics of mutual funds in relation to stock market
 
Impact Of Usd Credit Interest Rates, Libor Rates, Net Sales, Turkey’s Tourism...
Impact Of Usd Credit Interest Rates, Libor Rates, Net Sales, Turkey’s Tourism...Impact Of Usd Credit Interest Rates, Libor Rates, Net Sales, Turkey’s Tourism...
Impact Of Usd Credit Interest Rates, Libor Rates, Net Sales, Turkey’s Tourism...
 
Migration of capital, transnationalization of the world economy jung boram
Migration of capital, transnationalization of the world economy jung boramMigration of capital, transnationalization of the world economy jung boram
Migration of capital, transnationalization of the world economy jung boram
 
Ito_Clower
Ito_ClowerIto_Clower
Ito_Clower
 
Taking the Investor Perspective with SenseMaker®
Taking the Investor Perspective with SenseMaker® Taking the Investor Perspective with SenseMaker®
Taking the Investor Perspective with SenseMaker®
 
Mechanisms for Financing Investment Projects through Commercial Bank Loans
Mechanisms for Financing Investment Projects through Commercial Bank LoansMechanisms for Financing Investment Projects through Commercial Bank Loans
Mechanisms for Financing Investment Projects through Commercial Bank Loans
 
IMDADECTHESIS290902
IMDADECTHESIS290902IMDADECTHESIS290902
IMDADECTHESIS290902
 
AAUWorkingPaperSerie (1)
AAUWorkingPaperSerie (1)AAUWorkingPaperSerie (1)
AAUWorkingPaperSerie (1)
 
An empirical study on the relationship between stock market index and the nat...
An empirical study on the relationship between stock market index and the nat...An empirical study on the relationship between stock market index and the nat...
An empirical study on the relationship between stock market index and the nat...
 
CASE Network Studies and Analyses 330 - Rethinking balance-of-payments constr...
CASE Network Studies and Analyses 330 - Rethinking balance-of-payments constr...CASE Network Studies and Analyses 330 - Rethinking balance-of-payments constr...
CASE Network Studies and Analyses 330 - Rethinking balance-of-payments constr...
 
International Capital Flows and Inclusive Growth in Nigeria
International Capital Flows and Inclusive Growth in NigeriaInternational Capital Flows and Inclusive Growth in Nigeria
International Capital Flows and Inclusive Growth in Nigeria
 
Fic en it-chart book presentation_14-jan-13
Fic en it-chart book presentation_14-jan-13Fic en it-chart book presentation_14-jan-13
Fic en it-chart book presentation_14-jan-13
 
Final paper ppt mridul arora banking & finance
Final paper ppt mridul arora banking & finance Final paper ppt mridul arora banking & finance
Final paper ppt mridul arora banking & finance
 
Enhancing financial connectivity between Asia and Europe
Enhancing financial connectivity between Asia and EuropeEnhancing financial connectivity between Asia and Europe
Enhancing financial connectivity between Asia and Europe
 
A first analysis and profiling of social enterprises in Sweden prepared by th...
A first analysis and profiling of social enterprises in Sweden prepared by th...A first analysis and profiling of social enterprises in Sweden prepared by th...
A first analysis and profiling of social enterprises in Sweden prepared by th...
 
Cfpl
CfplCfpl
Cfpl
 
INTERNATIONAL EQUITY ANALYSIS UNDER IFRS_A CASE STUDY OF LONDON BASED SELL-SI...
INTERNATIONAL EQUITY ANALYSIS UNDER IFRS_A CASE STUDY OF LONDON BASED SELL-SI...INTERNATIONAL EQUITY ANALYSIS UNDER IFRS_A CASE STUDY OF LONDON BASED SELL-SI...
INTERNATIONAL EQUITY ANALYSIS UNDER IFRS_A CASE STUDY OF LONDON BASED SELL-SI...
 

Similar to IJSCH_SWFs

Transitory and Permanent Effects of Capital Market Development on Capital For...
Transitory and Permanent Effects of Capital Market Development on Capital For...Transitory and Permanent Effects of Capital Market Development on Capital For...
Transitory and Permanent Effects of Capital Market Development on Capital For...AJHSSR Journal
 
Final review arm manan
Final review arm mananFinal review arm manan
Final review arm mananfarsh_ghs
 
institutional investment in infrastructure development in developing countries
institutional investment in infrastructure development in developing countriesinstitutional investment in infrastructure development in developing countries
institutional investment in infrastructure development in developing countriesArslan Shani
 
Measuring the Dynamics of Financial Deepening and Economic Growth in Nigeria,...
Measuring the Dynamics of Financial Deepening and Economic Growth in Nigeria,...Measuring the Dynamics of Financial Deepening and Economic Growth in Nigeria,...
Measuring the Dynamics of Financial Deepening and Economic Growth in Nigeria,...iosrjce
 
Evaluation of the Development and Performance of Selected GCC and Non-GCC St...
Evaluation of the Development and Performance  of Selected GCC and Non-GCC St...Evaluation of the Development and Performance  of Selected GCC and Non-GCC St...
Evaluation of the Development and Performance of Selected GCC and Non-GCC St...Mace Abdullah
 
Writing Sample
Writing SampleWriting Sample
Writing SampleHang Pham
 
Using The ECM Approach between Growth of the Current Account Balance and Fore...
Using The ECM Approach between Growth of the Current Account Balance and Fore...Using The ECM Approach between Growth of the Current Account Balance and Fore...
Using The ECM Approach between Growth of the Current Account Balance and Fore...AJHSSR Journal
 
The Need for Financial Stability in Zimbabwe: Use of Derivatives Securities
The Need for Financial Stability in Zimbabwe: Use of Derivatives SecuritiesThe Need for Financial Stability in Zimbabwe: Use of Derivatives Securities
The Need for Financial Stability in Zimbabwe: Use of Derivatives Securitiesiosrjce
 
The Soundness of Financial Institutions In The Fragile Five Countries
The Soundness of Financial Institutions In The Fragile Five CountriesThe Soundness of Financial Institutions In The Fragile Five Countries
The Soundness of Financial Institutions In The Fragile Five CountriesCSCJournals
 
Financial Innovation Landscape Research: Testing the Feasibility of Financial...
Financial Innovation Landscape Research: Testing the Feasibility of Financial...Financial Innovation Landscape Research: Testing the Feasibility of Financial...
Financial Innovation Landscape Research: Testing the Feasibility of Financial...EveryWomanEveryChild
 
WORKING PAPER (ESADEgeo): More Layers than an Onion: Looking For a Definition...
WORKING PAPER (ESADEgeo): More Layers than an Onion: Looking For a Definition...WORKING PAPER (ESADEgeo): More Layers than an Onion: Looking For a Definition...
WORKING PAPER (ESADEgeo): More Layers than an Onion: Looking For a Definition...ESADE
 
A causality analysis of financial deepening and performance of
A causality analysis of financial deepening and  performance ofA causality analysis of financial deepening and  performance of
A causality analysis of financial deepening and performance ofAlexander Decker
 
A causality analysis of financial deepening and performance of
A causality analysis of financial deepening and  performance ofA causality analysis of financial deepening and  performance of
A causality analysis of financial deepening and performance ofAlexander Decker
 

Similar to IJSCH_SWFs (20)

Transitory and Permanent Effects of Capital Market Development on Capital For...
Transitory and Permanent Effects of Capital Market Development on Capital For...Transitory and Permanent Effects of Capital Market Development on Capital For...
Transitory and Permanent Effects of Capital Market Development on Capital For...
 
Final review arm manan
Final review arm mananFinal review arm manan
Final review arm manan
 
A4120113.pdf
A4120113.pdfA4120113.pdf
A4120113.pdf
 
Lemna wp 2015-14
Lemna wp 2015-14Lemna wp 2015-14
Lemna wp 2015-14
 
institutional investment in infrastructure development in developing countries
institutional investment in infrastructure development in developing countriesinstitutional investment in infrastructure development in developing countries
institutional investment in infrastructure development in developing countries
 
Mendel_University_Brno_Conference_2014
Mendel_University_Brno_Conference_2014Mendel_University_Brno_Conference_2014
Mendel_University_Brno_Conference_2014
 
Measuring the Dynamics of Financial Deepening and Economic Growth in Nigeria,...
Measuring the Dynamics of Financial Deepening and Economic Growth in Nigeria,...Measuring the Dynamics of Financial Deepening and Economic Growth in Nigeria,...
Measuring the Dynamics of Financial Deepening and Economic Growth in Nigeria,...
 
Measuring the Dynamics of Financial Deepening and Economic Growth in Nigeria,...
Measuring the Dynamics of Financial Deepening and Economic Growth in Nigeria,...Measuring the Dynamics of Financial Deepening and Economic Growth in Nigeria,...
Measuring the Dynamics of Financial Deepening and Economic Growth in Nigeria,...
 
Paper tigers: Chinese and Indian capital markets
Paper tigers: Chinese and Indian capital marketsPaper tigers: Chinese and Indian capital markets
Paper tigers: Chinese and Indian capital markets
 
Role of Sovereign Wealth Funds
Role of Sovereign Wealth FundsRole of Sovereign Wealth Funds
Role of Sovereign Wealth Funds
 
Evaluation of the Development and Performance of Selected GCC and Non-GCC St...
Evaluation of the Development and Performance  of Selected GCC and Non-GCC St...Evaluation of the Development and Performance  of Selected GCC and Non-GCC St...
Evaluation of the Development and Performance of Selected GCC and Non-GCC St...
 
Writing Sample
Writing SampleWriting Sample
Writing Sample
 
Using The ECM Approach between Growth of the Current Account Balance and Fore...
Using The ECM Approach between Growth of the Current Account Balance and Fore...Using The ECM Approach between Growth of the Current Account Balance and Fore...
Using The ECM Approach between Growth of the Current Account Balance and Fore...
 
The Need for Financial Stability in Zimbabwe: Use of Derivatives Securities
The Need for Financial Stability in Zimbabwe: Use of Derivatives SecuritiesThe Need for Financial Stability in Zimbabwe: Use of Derivatives Securities
The Need for Financial Stability in Zimbabwe: Use of Derivatives Securities
 
Wps6175
Wps6175Wps6175
Wps6175
 
The Soundness of Financial Institutions In The Fragile Five Countries
The Soundness of Financial Institutions In The Fragile Five CountriesThe Soundness of Financial Institutions In The Fragile Five Countries
The Soundness of Financial Institutions In The Fragile Five Countries
 
Financial Innovation Landscape Research: Testing the Feasibility of Financial...
Financial Innovation Landscape Research: Testing the Feasibility of Financial...Financial Innovation Landscape Research: Testing the Feasibility of Financial...
Financial Innovation Landscape Research: Testing the Feasibility of Financial...
 
WORKING PAPER (ESADEgeo): More Layers than an Onion: Looking For a Definition...
WORKING PAPER (ESADEgeo): More Layers than an Onion: Looking For a Definition...WORKING PAPER (ESADEgeo): More Layers than an Onion: Looking For a Definition...
WORKING PAPER (ESADEgeo): More Layers than an Onion: Looking For a Definition...
 
A causality analysis of financial deepening and performance of
A causality analysis of financial deepening and  performance ofA causality analysis of financial deepening and  performance of
A causality analysis of financial deepening and performance of
 
A causality analysis of financial deepening and performance of
A causality analysis of financial deepening and  performance ofA causality analysis of financial deepening and  performance of
A causality analysis of financial deepening and performance of
 

More from Miss. Antónia FICOVÁ, Engineer. (Not yet Dr.)

More from Miss. Antónia FICOVÁ, Engineer. (Not yet Dr.) (20)

Yandex.disk1
Yandex.disk1Yandex.disk1
Yandex.disk1
 
Yandex.disk 3
Yandex.disk 3Yandex.disk 3
Yandex.disk 3
 
My profile1
My profile1My profile1
My profile1
 
Image ban.ru news3
Image ban.ru   news3Image ban.ru   news3
Image ban.ru news3
 
Image ban.ru my albums1
Image ban.ru   my albums1Image ban.ru   my albums1
Image ban.ru my albums1
 
Hubi c ovh-antonia_ficova
Hubi c   ovh-antonia_ficovaHubi c   ovh-antonia_ficova
Hubi c ovh-antonia_ficova
 
History my drive - your swiss online storage4
History   my drive - your swiss online storage4History   my drive - your swiss online storage4
History my drive - your swiss online storage4
 
history internet banking_part_2
history internet banking_part_2history internet banking_part_2
history internet banking_part_2
 
Macikova
MacikovaMacikova
Macikova
 
Yasar 1
Yasar 1Yasar 1
Yasar 1
 
Sipko vii
Sipko viiSipko vii
Sipko vii
 
Phd 1
Phd 1Phd 1
Phd 1
 
Acreditation
AcreditationAcreditation
Acreditation
 
Academic senat ii
Academic senat iiAcademic senat ii
Academic senat ii
 
Zoznam zamestnancov uis
Zoznam zamestnancov uisZoznam zamestnancov uis
Zoznam zamestnancov uis
 
View recorded transactions
View recorded transactionsView recorded transactions
View recorded transactions
 
View recorded transactions ii
View recorded transactions iiView recorded transactions ii
View recorded transactions ii
 
Personal data check
Personal data checkPersonal data check
Personal data check
 
Personal administration
Personal administrationPersonal administration
Personal administration
 
Telephone directory ii.
Telephone directory ii.Telephone directory ii.
Telephone directory ii.
 

IJSCH_SWFs

  • 1. International Journal of Science Commerce and Humanities Volume No 3 No 2 March 2015 104 SOVEREIGN WEALTH FUNDS: STATISTICAL ANALYSIS OF ASSET ALLOCATIONS IN 2013 ANTONIA FICOVA PhD Student at Faculty of Economics and Business Pan European University, Bratislava antoniaficova@zoho.com* +421 918 216 381 *Corresponding Author JURAJ SIPKO Institute of Economic Research, Slovak Academy of Science, Šancova 56, 811 05 Bratislava, Slovakia Assoc. Prof. at Faculty of Economics and Business, Pan-European University, 851 05 Bratislava, Slovakia, juraj.sipko@gmail.com, +421 918 664 613 Abstract: The paper explores the proportions of asset allocations of observed Sovereign Wealth Funds in 2013. Portfolios include: savings funds, stabilization/savings funds, pension reserve funds and reserve investment funds. First, we determine confidence interval of the proportion of alternative assets in 11 observed portfolios at a 99 percent probability level. Second, we determine confidence interval of the proportion of fixed income in 13 observed asset allocation of SWFs at a 99 percent probability level. Third, we determine determine confidence interval of proportion of cash figure in 7 observed portfolios at 95 percent probability. Finally, we determine confidence interval of the proportion of public equities in 13 observed asset allocations at a 99 percent probability level. In this context, proportions of each of these classes are provided through statistical analysis and illustrations. Keywords: Sovereign Wealth Fund, Portfolio, Asset Allocations. JEL classification: C12, F21, G11. 1 Introduction Sovereign Wealth Funds (SWFs) are long-term investments that follow either a strategic approach to ensure the supply of natural resources and technology or that transfer wealth to future generations through transformation or accumulation of assets. Fundamentally, SWFs are seeking four things. First, high returns, motivated by the opportunity cost of excess official reserves invested in risk-free assets. Second, the funds save wealth for future generations, when the natural sources will be exhausted, meaning no surplus revenues for the country. Third, countries dependent on commodity exports set up funds for absorbing the shock of fluctuations in global market prices of oil, indicating a stabilization function. Fourth, these funds promote domestic industries through their investments. Viewed in this light, SWF activities can be summarized in the following two points. First, SWF motives can be strategic rather than purely financial as SWFs may seek to gather ownership rights in sensitive sectors such as telecommunications, media, energy, seaport, financial services and dual use industries and later use these assets to support the domestic economy in the case of war. Second, SWFs may acquire proprietary information only available to corporate insiders and transfer this corporate intelligence to
  • 2. International Journal of Science Commerce and Humanities Volume No 3 No 2 March 2015 105 a rival company in their own country. As a result, SWF´s investments have received increasing attention due to the drastic increase in their size and visibility and due to their potential to threaten the stability of firms. Exempli gratia, according to International Monetary Fund (IMF) estimates, SWFs are growing at a rate of USD 800–900 billion p.a. In other words, since 2008, assets under management of SWFs rose by 76 percent to USD 5.4 trillion in October 2013. This is as a result of the investment activities of these funds. Moreover, the sheer size of SWF is also obvious from the comparison with top stock exchanges worldwide. According to the International Sovereign Wealth Fund Institute 2012 report, comparing the assets under management of these funds with the market capitalization of the top 16 stock exchanges of the world suggests that the AUM of SWFs are more than that of all the exchanges except NYSE Euronext (US) with the market capitalization of USD 12.6 trillion. On the other hand, the USD 5.4 trillion of AUM of SWFs is more than twice the market capitalization of the Indian National Stock Exchange (NSE) and the Bombay Stock Exchange (BSE) put together according to the data of the World Federation of Exchanges in 2012. It is important to mention a number of studies on the subject of SWFs since 2007. In particular, Beck, R. and Fidora, M. (2008) provided a background on the impact of sovereign wealth funds (SWFs) on the global financial markets and the impact of a transfer of traditional foreign exchange reserves to SWFs on global capital flows. Baptista, A. M. (2008) presented that portfolios lie away from the mean–variance frontier under fairly general conditions. More to the point, he found that the composition and location of such portfolios can differ notably from those on the mean–variance frontier. Miracky et. al. (2009) studied investment patterns and performance of SWFs. Bernstein, S., Lerner, J. and A. Schoar (2009) provide the direct private equity investment strategies across SWFs and their relationship to the funds’ organizational structures. Brown, A., Papaioannou, M. and Petrova, I. (2010) examined some basic macrofinancial linkages of an SWF's strategic asset allocation (SAA) strategies with regard to the government budget, monetary policy and exchange rate movements. Kunzel, P., Lu, Y., Petrova, I. and Pihlman, J. (2011) argued for the continued importance of SWFs as a stabilizer in international capital markets for regular macro-risk assessments of the sovereign. Johan, S., Knill, A.M. and Mauck, N. (2013) examined the investments of 19 SWFs around the world from 1991 through 2010. They found that investments are similar to other institutional investors and are less likely to invest in private equity versus public equity internationally. Al-Hassan, A., Papaioannou, M., Skancke, M. and Chih Sung, Ch. (2013) described in a systematic (normative) manner the salient features of a SWF’s governance structure in relation to its objectives and investment management that can ensure its efficient operation and enhance its financial performance. Bodie, Z. and Briere, M. (2013) addressed the management of sovereign wealth from the perspective of the theory of contingent claims; moreover, in the sovereign’s balance sheet, they framed sovereign fund management as an asset-liability management (ALM) problem. Lee, B. S. and In, F. H. (2013) investigated that sovereign wealth funds’ poor performance is partly due to their poor information about the target firms. They applied Granger-causality tests. Gilligan, G., O'Brien, J. and Bowman, M. (2014) focused on the role that they might play in domestic investment in order to stimulate the growth of social capital and nation building in their home country as well as progress made by SWFs themselves in the improvement of the standards and processes of governance. Gelb, A., Tordo, S., Halland, H., Arfaa, N. and Smith, G. (2014) proposed some basic elements of a conceptual framework to create a system of checks and balances to help ensure that the SWFs do not undermine macroeconomic management. Al-Kharusi, Q. A, Dixon, A. D. and Monk, A. H. B. (2014) pointed out that SWFs are expanding geographically, moving their organizations into the markets they found appealing, rather than waiting for intermediaries to come to them, reflecting a broader trend towards the professionalization of pension and sovereign fund investment organizations. The research objectives of this paper are presented as follows: What are the current proportions of each asset allocation of SWFs? What is the mean of reliability of the following classes: alternative assets, fixed income, cash and public equties in portfolios of SWFs?
  • 3. International Journal of Science Commerce and Humanities Volume No 3 No 2 March 2015 106 1.2 Data and Methodology This paper examines the proportion of each class of portfolio of SWFs. We provide statistical analysis of 11 observed alternative assets, analysis of 13 observed fixed income, analysis of 7 observed cash figures and finally we analyze public equties of 13 observed portfolios in 2013. Observed portfolios of SWFs include savings, stabilization/savings, pension reserve and reserve investment funds. This has been done by illustrations using available data from official websites of funds and over fifty annual and quarterly reports and author´s calculations due the fact that most of the funds do not provide data to the public. In addition, we present the estimates using the ‘Student’ t-test distribution with (N−1) degrees of freedom and determination of the left-hand interval. The methods to be deployed in this paper are qualitative and quantitative analysis and comparative research that requires active intervention by the researcher. 2 Literature Review There are many different definitions of a SWF. On the one hand, the EU Commission (2008) describes SWFs as state-owned investment vehicles which manage a diversified portfolio of domestic and international financial assets. On the other hand, McKinsey & Company (2007) presents that SWFs are funded by the Central Bank’s reserves, aimed to maximize the returns within manageable risk bands. The technical definition of SWFs is that they are government-owned and controlled (directly or indirectly), have no outside beneficiaries or liabilities and that they invest their assets, either in the short or long-term, according to the interests and objectives of the sovereign sponsor, argued Monk (2009). 2.1 Asset Allocations More to the point, strategic asset allocation is based on long-term risk and return objectives as well as investor expectations regarding asset class returns, volatility and correlations. In addition to this, the principal factors driving these allocation are as follows. First, Asset Class Diversification, meaning allocations to a wide range of asset classes, which diversifies away the risk to the portfolio of individual asset classes that underperform. Second, Geographic Diversification, meaning allocations to a wide range of different geographic regions, which diversifies away the risk to the portfolio of different regions and countries that underperform. Third, illiquidity premium, meaning allocations to asset classes that are illiquid in nature but are expected to generate superior returns over a long-term horizon. Fourth, growth, meaning allocations to asset classes expected to capture economic growth including emerging markets equity, small cap equity and private equity. Fifth, inflation protection, meaning allocations to assets that are more likely to protect against longer term inflation including inflation-linked bonds, commodities and infrastructure. In the case of strategic investment, the SWFs‘ strategy will be very opportunistic and will also involve opaque transactions using Sovereign Wealth Enterprises. On the other hand, asset management for wealth accumulating SWFs is more comparable to that of endowment funds. More to the point, both investor types share some common characteristics such as the long-term perspective and the obligation to increase or at least to preserve the capital stock. Nevertheless, SWFs differ in terms of their exposure to funding risk, stemming from the price uncertainty of natural resources. To sum up, to account for this dependency, the SWF sponsor has two options: hedging or diversification. However, the portfolio shall be diversified in order to reduce concentration risk among government money market funds and managed accounts. The question is: What is the purpose of diversification? More to the point, diversification is to provide reasonable assurance that no single fund has a disproportionate exposure to the SWFs‘ assets that may adversely impact the aggregate results of the SWF or impede its liquidity. Viewed in this light, diversification is an important tool of risk management and can mitigate the volatility and uncertainty inherent in substantial exposure to risk assets and as such, the SWF will seek to be diversified. If we look at determinants in the setting up of an appropriate investment, the first determinant is the objective of the SWF and the second determinant is the risk-bearing capacity of the SWF. In this regard, the longer a fund‘s investment horizon is, the higher its capacity to take on investment risks. On the other hand, a short investment horizon signals a lower scope for exposure to risky assets. To sum up, investment funds with a strong intergenerational savings orientation tend to view their long horizon and ability to ride through
  • 4. International Journal of Science Commerce and Humanities Volume No 3 No 2 March 2015 107 market downturns as a key competitive advantage. For instance, risk objectives are typically determined by the owner or the governing body of the SWF. 3 Hypotheses Based on data analyzed for the paper, we developed four main hypotheses and preliminary results are demonstrated in this section. Presented calculations are the author´s best estimation. 3.1 Testing Hypothesis I. First, we use data of 11 observed asset allocations, especially allternative assets, in 2013 as illustrated in Table 1 below. Second, we determine the reliability at a 99% confidence level and determine confidence interval of proportion of alternative assets in observed asset allocations of SWFs. Third, funds include: savings funds, stabilization/savings funds, pension reserve funds and reserve investment funds. Table 1: Variables, N=11 Z Alternative Assets % The Government Pension Fund Global - Norway 1.2 Nigeria Sovereign Investment Authority 15 Alberta Heritage Savings Trust Fund 27 Alaska Permanent Fund Corporation 44 National Development Fund of Iran 77.6 Ireland, National Pensions Reserve Fund 20.8 Australia Future Fund 34.7 New Zealand Superannuation Fund 30 China Investment Corporation 45 Government of Singapore Investment Corporation 26 Korea Investment Corporation 16 AVERAGE 30.663 STDEV 20.159 TINV for α/2 2.763 TINV for α 2.228 MEDIAN 27 SKEW 1.120 KURT 2.268 Source: Author´s calculations, available data from SWFs websites, reports. Notes: 1) Alternative assets includes private equity, infrastructure, real estate, return; 2) Government Pension Fund Global - Norway - 1Q 2014; Alberta Heritage Savings Trust Fund - 1Q 2013; Alaska Permanent Fund Corporation – 2013; Nigeria Sovereign Investment Authority - 2012; National Development Fund of Iran – 2013; Ireland, National Pensions Reserve Fund - 1Q 2014; Australia Future Fund - 1Q 2014; New Zealand Superannuation Fund - 2Q 2013; China Investment Corporation - 2012; Government of Singapore Investment Corporation - 2013; Korea Investment Corporation - 2012 We use the TINV function that returns the value of t Student's t-distribution as a function of the probability and the degrees of freedom; in our case the number of degrees of freedom = N-1 where N is the number of values, and probability α = 0.01. The two-sided confidence interval can be determined from the relation:
  • 5. International Journal of Science Commerce and Humanities Volume No 3 No 2 March 2015 108 (1) Results of this formula show an acceptable range for levels of significance. On the other hand, it explains with at 99 percent probability level that the proportion of alternative assets in asset allocations of the 11 observed SWFs is between 13.06 and 48.27 percent of the total portfolio. To determine the left-hand interval, confidence interval of alternative assets, we use the following relationship: (2) According to the results of this formula, the proportion of alternative assets in asset allocation of 11 SWFs will be more than 16.5 percent at a 95 probability probability level. We then formulate the hypothesis as follows: H0: These are random deviations due to the selection of elements in the file Z, m=  . H1: These are NOT random deviations due to the selection of elements in the file Z, m≠  . (3) t crit = 2.23 The significance level of 0.05 and 10 degrees of freedom, the inverse two-sided t-distribution is calculated by TINV (0.05; 10) is 2.23. Ergo, t ˃ tcrit → we accept the alternative hypothesis, 30.66≠16.05 and there are no random deviations due to the selection of observed funds, in short, resluts are statistically significant. Figure 1: Illustration of the proportion of alternative assets Source: Author’s analysis. Figure 1 above shows that the measured value 30.66 is located inside the acceptable range and therefore we accept the alternative hypothesis. To sum up, results using the formula show at a 95 percent                1 11 1 2 1 1 2 1 n s tx n s tx         1 10 16.20 76.266.30 10 16.20 76.266.30   %9927.4806.13     %955.16 95.0 10 16.20 23.266.30 1 1 1 1                      P P n s txP n s x t   33.211 16.20 5.1666.30    x =30.66 48.27  +2.76sx -2.76sx 0.490.49 0.01 f 0.01 13.06 =16.05
  • 6. International Journal of Science Commerce and Humanities Volume No 3 No 2 March 2015 109 probability level that the proportion of alternative assets in asset allocations of observed SWFs is between 13.06 percent and 48.27 percent of the total portfolio and that by determining the left-hand interval we may say it is more than 16.05 percent of the funds‘ portfolios. 3.2 Testing Hypothesis II. We observe data of 13 asset allocations in 2013 as illustrated in Table 2 below. More to the point, we determine the reliability of at a 99% probability level and we determine confidence interval of the proportion of fixed income in observed asset allocation of SWFs. In this context, funds include: savings funds, stabilization/savings funds, pension reserve funds and reserve investment funds. Table 2: Variables, N=13 Z Fixed Income % The Government Pension Fund Global - Norway 37.7 Botswana - Pula Fund 25.77 Alberta Heritage Savings Trust Fund 20 Alaska Permanent Fund Corporation 20 Timor Leste Petroleum Fund 65 National Development Fund of Iran 16.6 Ireland, National Pensions Reserve Fund 14.7 Hong Kong Monetary Authority Investment Portfolio 74 Australia Future Fund 11.8 New Zealand Superannuation Fund 9 China Investment Corporation 19.1 Government of Singapore Investment Corporation 21 Korea Investment Corporation 38.8 AVERAGE 28.728 STDEV 20.166 TINV for /2 2.680 TINV for  1.782 MEDIAN 20 SKEW 1.470 KURT 1.296 Source: Author´s calculations, available data from SWFs websites, reports. Notes: 1) Botswana - Pula Fund - 2Q 2013; Government Pension Fund Global - Norway - 1Q 2014; Alberta Heritage; Savings Trust Fund - 1Q 2013; Ireland, National Pensions Reserve Fund - 1Q 2014; Australia Future Fund - 1Q 2014; New Zealand Superannuation Fund - 2Q 2013; China Investment Corporation – 2012; Korea Investment Corporation – 2012 However, we use the TINV function that returns the value of t Student's t-distribution as a function of the probability and the degrees of freedom. Especially, the number of degrees of freedom = N-1 where N is the number of values and probability α = 0.01. According to the what is mentioned above, we determine the two-sided confidence interval using the following relationship:
  • 7. International Journal of Science Commerce and Humanities Volume No 3 No 2 March 2015 110 (4) Results using this formula show an acceptable range for levels of significance. On the other hand, it explains at a 99 percent probability level that the proportion of fixed income in asset allocations of the observed 13 SWFs is between 13.11 and 44.35 percent of the total portfolio. To determine the left-hand interval, the average of fixed income, we use the following relationship: (5) According to the results using the formula above, the proportion of fixed income in the asset allocation of 13 SWFs will be more than 18.36 percent at 90 percent probability. We then formulate the hypothesis as follows: H0: These are random deviations due to the selection of elements in the file Z, m=  . H1: These are NOT random deviations due to the selection of elements in the file Z, m≠  . (6) t crit = 1.78 The significance level of 0.10 and 12 degrees of freedom and the inverse two-sided t-distribution is calculated using TINV (0,1; 12) is 1.78. Ergo, t ˃ tcrit → we accept the alternative hypothesis, 28.73≠18.36 and there are no random deviations due to the selection of observed funds, in short, results are statistically significant. Figure 2: Illustration of the proportion of fixed income Source: Author’s analysis.                1 11 1 2 1 1 2 1 n s tx n s tx 99.0 12 17.20 68.273.28 12 17.20 68.273.28           %9935.4411.13     %9036.18 90.0 12 16.20 78.173.28 1 1 1 1                      P P n s txP n s x t   85.113 16.20 36.1873.28    =18.36 x =28.73 44.35  +2.68sx -2.68sx 0.490.49 0.01 f 0.01 13.11
  • 8. International Journal of Science Commerce and Humanities Volume No 3 No 2 March 2015 111 As revealed by Figure 2 above, the measured value 28.73 is located inside the acceptable range and therefore, we accept the alternative hypothesis. To sum up, results show that there is a 90 percent probability that the proportion of fixed income in asset allocations of observed SWFs is supposed to be between 13.11 percent and 44.35 percent of the total portfolio and by determining the left-hand interval we may say that it is supposed to be more than 18.36 percent of the funds‘ portfolios. 3.3 Testing Hypothesis III. At this section, we observe data of 7 asset allocations of cash classes in 2013 as illustrated in Table 3 below. In other words, we determine the reliability at a 95% probability level and we want to determine confidence interval of the proportion of cash in observed asset allocations of SWFs. Clearly, funds include: savings funds, stabilization/savings funds, pension reserve funds and reserve investment funds. Table 3: Variables, N=7 Z Cash % Nigeria Sovereign Investment Authority 5 Botswana - Pula Fund 7.86 National Development Fund of Iran 5.8 Ireland, National Pensions Reserve Fund 39.7 Australia Future Fund 10.9 China Investment Corporation 3.8 Government of Singapore Investment Corporation 7 AVERAGE 11.437 STDEV 10.669 TINV for /2 1.943 TINV for  1.446 MEDIAN 7 SKEW 2.472 KURT 6.277 Source: Author´s calculations, available data from SWFs websites, reports. Notes: Nigeria Sovereign Investment Authority - 2012; Botswana - Pula Fund - 2Q 2013; Ireland, National Pensions Reserve Fund - 1Q 2014; Australia Future Fund - 1Q 2014; China Investment Corporation - 2012 First of all, we use the TINV function that returns the value of t Student's t-distribution as a function of the probability and the degrees of freedom. In other words, the number of degrees of freedom = N-1 where N is the number of values, and probability α = 0.05. Secondly, we determine the two-sided confidence interval by using et sequentes relationship: (7)                1 11 1 2 1 1 2 1 n s tx n s tx 95.0 6 67.10 94.144.11 6 67.10 94.144.11           %9589.193  
  • 9. International Journal of Science Commerce and Humanities Volume No 3 No 2 March 2015 112 As a result of the formula above, we see an acceptable range for levels of significance, more to the point, that explain at a 95 percent probability level that the proportion of cash class in asset allocations of the observed 7 SWFs is between 3.00 and 19.89 percent of the total portfolio. Thirdly, to determine the left- hand interval, the average of the cash figure, we use the following relationship: (8) In short, results shows that the proportion of the cash figure in the asset allocation of 7 SWFs will be more than 5.17 percent at a 95 percent probability level. At this point, we formulate another hypothesis as follows: H0: These are random deviations due to the selection of elements in the file Z, m=  . H1: These are NOT random deviations due to the selection of elements in the file Z, m≠  . (9) t crit = 2.44 In this context, the significance level of 0.05 and 7 degrees of freedom and the inverse two-sided t- distribution calculated using TINV (0.05; 6) is 2.44. Ergo, t < tcrit → we accept the null hypothesis, 11.44=5.17 and the deviation is caused by random selection of funds in file Z, which is not statistically significant. The following Figure 3 presents the proportion of cash. Figure 3: Illustration of the proportion of cash Source: Author’s analysis. Figure 3 above highlights that the measured value 11.44 is located inside the acceptable range and therefore, we accept the null hypothesis. On the one hand, results show that there is a 95 percent probability that the proportion of cash in asset allocations of observed SWFs is supposed to be between 3.00 percent and 19.89 percent of the total portfolio. Id est, determining the left-hand interval, we arrived at the result that the figure of cash is more than 5.17 percent in the fund´s portfolios. 3.4 Testing Hypothesis IV. At this point, data of observed 13 public equities of asset allocations in 2013 are presented in Table 4 below. Furthermore, we determine the reliability of 99 percent and we want to determine confidence interval   %9517.5 95.0 6 67.10 44.144.11 1 1 1 1                      P P n s txP n s x t   31.17 67.12 17.544.11    =5.17 x =11.44 19.89  +1.94sx -1.94sx 0.450.45 0.05 f 0.05 3.00
  • 10. International Journal of Science Commerce and Humanities Volume No 3 No 2 March 2015 113 of proportion of public equties in observed asset allocations of SWFs. However, this data also includes five types of funds as follows: savings funds, stabilization/savings funds, pension reserve funds, reserve investment funds. Table 4: Variables, N=13 (continued on the next page) Z Public Equities % The Government Pension Fund Global - Norway 61.1 Botswana - Pula Fund 66.37 Nigeria Sovereign Investment Authority 80 Alberta Heritage Savings Trust Fund 53 Alaska Permanent Fund Corporation 36 Timor Leste Petroleum Fund 35 Hong Kong Monetary Authority Investment Portfolio 26 Ireland, National Pensions Reserve Fund 24.8 Australia Future Fund 42.6 New Zealand Superannuation Fund 61 China Investment Corporation 32 Government of Singapore Investment Corporation 46 Korea Investment Corporation 45.2 AVERAGE 46.851 STDEV 16.688 TINV for /2 2.680 TINV for  2.178 MEDIAN 45.2 SKEW 0.502 KURT -0.473 Source: Author´s calculations, available data from SWFs websites, reports. Notes: 1) Government Pension Fund Global - Norway - 1Q 2014; Botswana - Pula Fund - 2Q 2013; Nigeria Sovereign Investment Authority – 2012; Alberta Heritage Savings Trust Fund - 1Q 2013; National Pensions Reserve Fund - 1Q 2014; Australia Future Fund - 1Q 2014; New Zealand Superannuation Fund - 2Q 2013; China Investment Corporation - 2012; Korea Investment Corporation - 2012 To begin, we use the TINV function that returns the value of t Student's t-distribution as a function of the probability and the degrees of freedom. In other words, the number of degrees of freedom = N-1 where N is the number of values and probability α = 0.01. Then, we determine the two-sided confidence interval using following relationship: (10)               1 11 1 2 1 1 2 1 n s tx n s tx 99.0 12 69.16 68.285.46 12 69.16 68,.285.46           %9978.5993.33  
  • 11. International Journal of Science Commerce and Humanities Volume No 3 No 2 March 2015 114 According to the results mentioned above, we see an acceptable range for levels of significance, in this context, explaining at a 99 percent probability level that the proportion of public equties in asset allocations of observed 13 SWFs is between 33.93 and 59.78 percent of the total portfolio. Consequently, we determine the left-hand interval, the average of cash figure we use the et sequentes relationship: (11) To sum up, results show that the proportion of public equities in asset allocation of 13 SWFs will be more than 36.38 percent at 95 percent probability. At this point, we decided to formulate another hypothesis as follows: H0: These are random deviations due to the selection of elements in the file Z, m=  . H1: These are NOT random deviations due to the selection of elements in the file Z, m≠  . (12) t crit = 2.17 In fact, the significance level of 0.05 and 12 degrees of freedom and the inverse two-sided t- distribution is calculated using TINV (0.05; 12) is 2.17. Ergo, t ˃ tcrit → we accept allternative hypothesis, 46.85≠36.38 and there are no random deviations due to the selection of observed funds, in short, results are statistically significant. For better understanding, we provide the following Figure 4 below that illustrates the proportion of public equities. Figure 4: Illustration of the proportion of public equities Source: Author’s analysis.   %9538.36 95.0 12 69.16 17.285.46 1 1 1 1                      P P n s txP n s x t   26.213 69.16 38.3685.46    =36.38 x =46.85 59.78 19,89  +2.68sx -2.68sx 0.490.49 0.01 f 0.01 33.93
  • 12. International Journal of Science Commerce and Humanities Volume No 3 No 2 March 2015 115 However, Figure 4, representing the measured value 46.85, is located inside the acceptable range and therefore, we accept the allternative hypothesis. Firstly, results show that there is a 99 percent probability that the proportion of public equities in asset allocations of observed SWFs is between 33.93 percent and 59.78 percent of the total portfolio. Secondly, determining the left-hand interval, we arrived to the result that the figure of public equities is more than 36.38 percent of the funds‘ portfolios. 4 Conclusion First, we observed data of alternative assets in 2013. We identified that at a 99 percent probability level the proportion of alternative assets in asset allocations of the observed 11 SWFs is between 13.06 and 48.27 percent of the total portfolio. Then, we determined the left-hand interval and that the proportion of alternative assets will be more than 16.5 percent at a 95 percent probability level. To sum up, at significance level of 0.05 and 10 degrees of freedom, the inverse two-sided t-distribution is calculated using TINV (0.05; 10) is 2.23. Therefore, t ˃ tcrit → we accepted the alternative hypothesis, 30.66≠16.05 and there are no random deviations due to the selection of observed funds, in short, results are statistically significant. Second, we observed data of fixed income in 2013. We examined that at a 99 percent probability level the proportion of fixed income in asset allocations of observed 13 SWFs is between 13.11 and 44.35 percent of the total portfolio. Afterwards, we determined that the left-hand interval, the proportion of fixed income in asset allocation, will be more than 18.36 percent at a 90 percent probability level. In short, at a significance level of 0.10 and 12 degrees of freedom, the inverse two-sided t-distribution is calculated using TINV (0.1; 12) is 1.78. Therefore, t ˃ tcrit → we accepted the alternative hypothesis, 28.73≠18.36 and there are no random deviations due to the selection of observed funds, more to the point, results are statistically significant. Third, we observed data of cash figures in 2013. We presented that at a 95 percent probability level the proportion of cash class in asset allocations of the observed 7 SWFs is between 3.00 and 19.89 percent of the total portfolio. On the other hand, by determination of the left-hand interval, the proportion of cash figure in asset allocation will be more than 5.17 percent at a 95 percent probability level. In this context, at a significance level of 0.05 and 7 degrees of freedom, the inverse two-sided t-distribution is calculated using TINV (0.05; 6) is 2.44. Ergo, t < tcrit → we accept the null hypothesis, 11.44=5.17 and the deviation is caused by a random selection of funds in file Z, which are not statistically significant. Fourth, we observed data of public equities in 2013. We described that at a 99 percent probability level the proportion of public equties in asset allocations of observed 13 SWFs is between 33.93 and 59.78 percent of the total portfolio. Then, according to the determination of the left-hand interval, the proportion of public equities in asset allocation will be more than 36.38 percent at a 95 percent probability level. In fact, at a significance level of 0.05 and 12 degrees of freedom, the inverse two-sided t-distribution is calculated using TINV (0.05; 12) is 2.17. Ergo, t ˃ tcrit → we accept the alternative hypothesis, 46.85≠36.38 and there are no random deviations due to the selection of observed funds, in short, results are statistically significant. However, since the financial crisis, as investments turned out to have certain effects on fund performance, SWF managers were considerably questioned about their investment decisions and monitoring activities. Id est, changes in SWFs‘ asset allocations will increasingly involve ethical responsibilities in the future. 5 References 1. Al-Hassan, A. - Papaioannou, M. G. - Skancke, M. - Sung, Ch. Ch., (2013). Sovereign Wealth Funds: Aspects of Governance Structures and Investment Management. IMF Working Paper No. 13/231 2. Al-Kharusi, Q. A - Dixon, A.D. - Monk, A. H. B., (2014). Getting Closer to the Action: Why Pension and Sovereign Funds are Expanding Geographically 3. Balding, Ch. (2008). A Portfolio Analysis Of Sovereign Wealth Funds Sovereign Wealth Funds. University of California, Irvine
  • 13. International Journal of Science Commerce and Humanities Volume No 3 No 2 March 2015 116 4. Baptista, A.M., (2008). Optimal delegated portfolio management with background risk. In: Journal of Banking & Finance, vol. 32, pp. 977-985 5. Beck, R. - Fidora, M. (2008). The impact of sovereign wealth funds on global financial markets. ECB Occasional paper series No 91/July 2008 6. Bernstein, S., Lerner, J. and A. Schoar, (2009). The Investment Strategies of Sovereign Wealth Funds. Harvard Business School Working Paper 7. Blundell-Wignall, A., Yu-Wei Hu - Yermo, J., (2008). Sovereign Wealth and Pension Fund Issues 8. Bodie, Z. - Briere, M., (2013). Optimal Asset Allocation for Sovereign Wealth Funds: Theory and Practice. Boston U. School of Management Research Paper No. 2013-11 9. Bortolotti, B., Fotak, V., Megginson, W.L. and W. Miracky, (2010). Sovereign Wealth Fund Investment Patterns and Performance. FEEM Working Paper No. 22.2009 10. Brown, A. - Papaioannou, M. - Petrova, I. (2010). Macrofinancial Linkages of the Strategic Asset Allocation of Commodity-Based SWF´s. IMF Working Paper WP/10/9:32 11. Gelb, A. - Tordo, S. - Halland, H. - Arfaa, N.- Smith, G., (2014). Sovereign Wealth Funds and Long-Term Development Finance: Risks and Opportunities. World Bank Policy Research Working Paper No. 6776. 12. Gilligan, G. - O'Brien, J. - Bowman, M., (2014). Sovereign Wealth Funds: The Good Guy Investment Actors? CIFR Paper No. 021/2014 13. Johan, S., Knill, A. and N. Mauck, (2013). Determinants of Sovereign Wealth Fund Investment in Private Equity vs Public Equity. In: Journal of International Business Studies, vol. 44, pp. 155- 172 14. Kunzel, P.- Lu, Y. - Petrova, I. - Pihlman, J. (2011). Investment Objectives of Sovereign Wealth Funds - A Shifting Paradigm. IMF, Working Papers, WP/11/19:17 15. Lee, B. S. - In, F. H., (2013). Do Sovereign Wealth Funds Make Informed Investment Decisions? 16. Miracky, W.- Bortolotti, B. (2009). Weathering the Storm. Fondazione Eni Enrico Mattei, Monitor Group, SWF Annual Report 2008 17. Monk, A.H.B. (2009). Recasting the Sovereign Wealth Fund Debate: Trust, Legitimacy, and Governance. University of Oxford