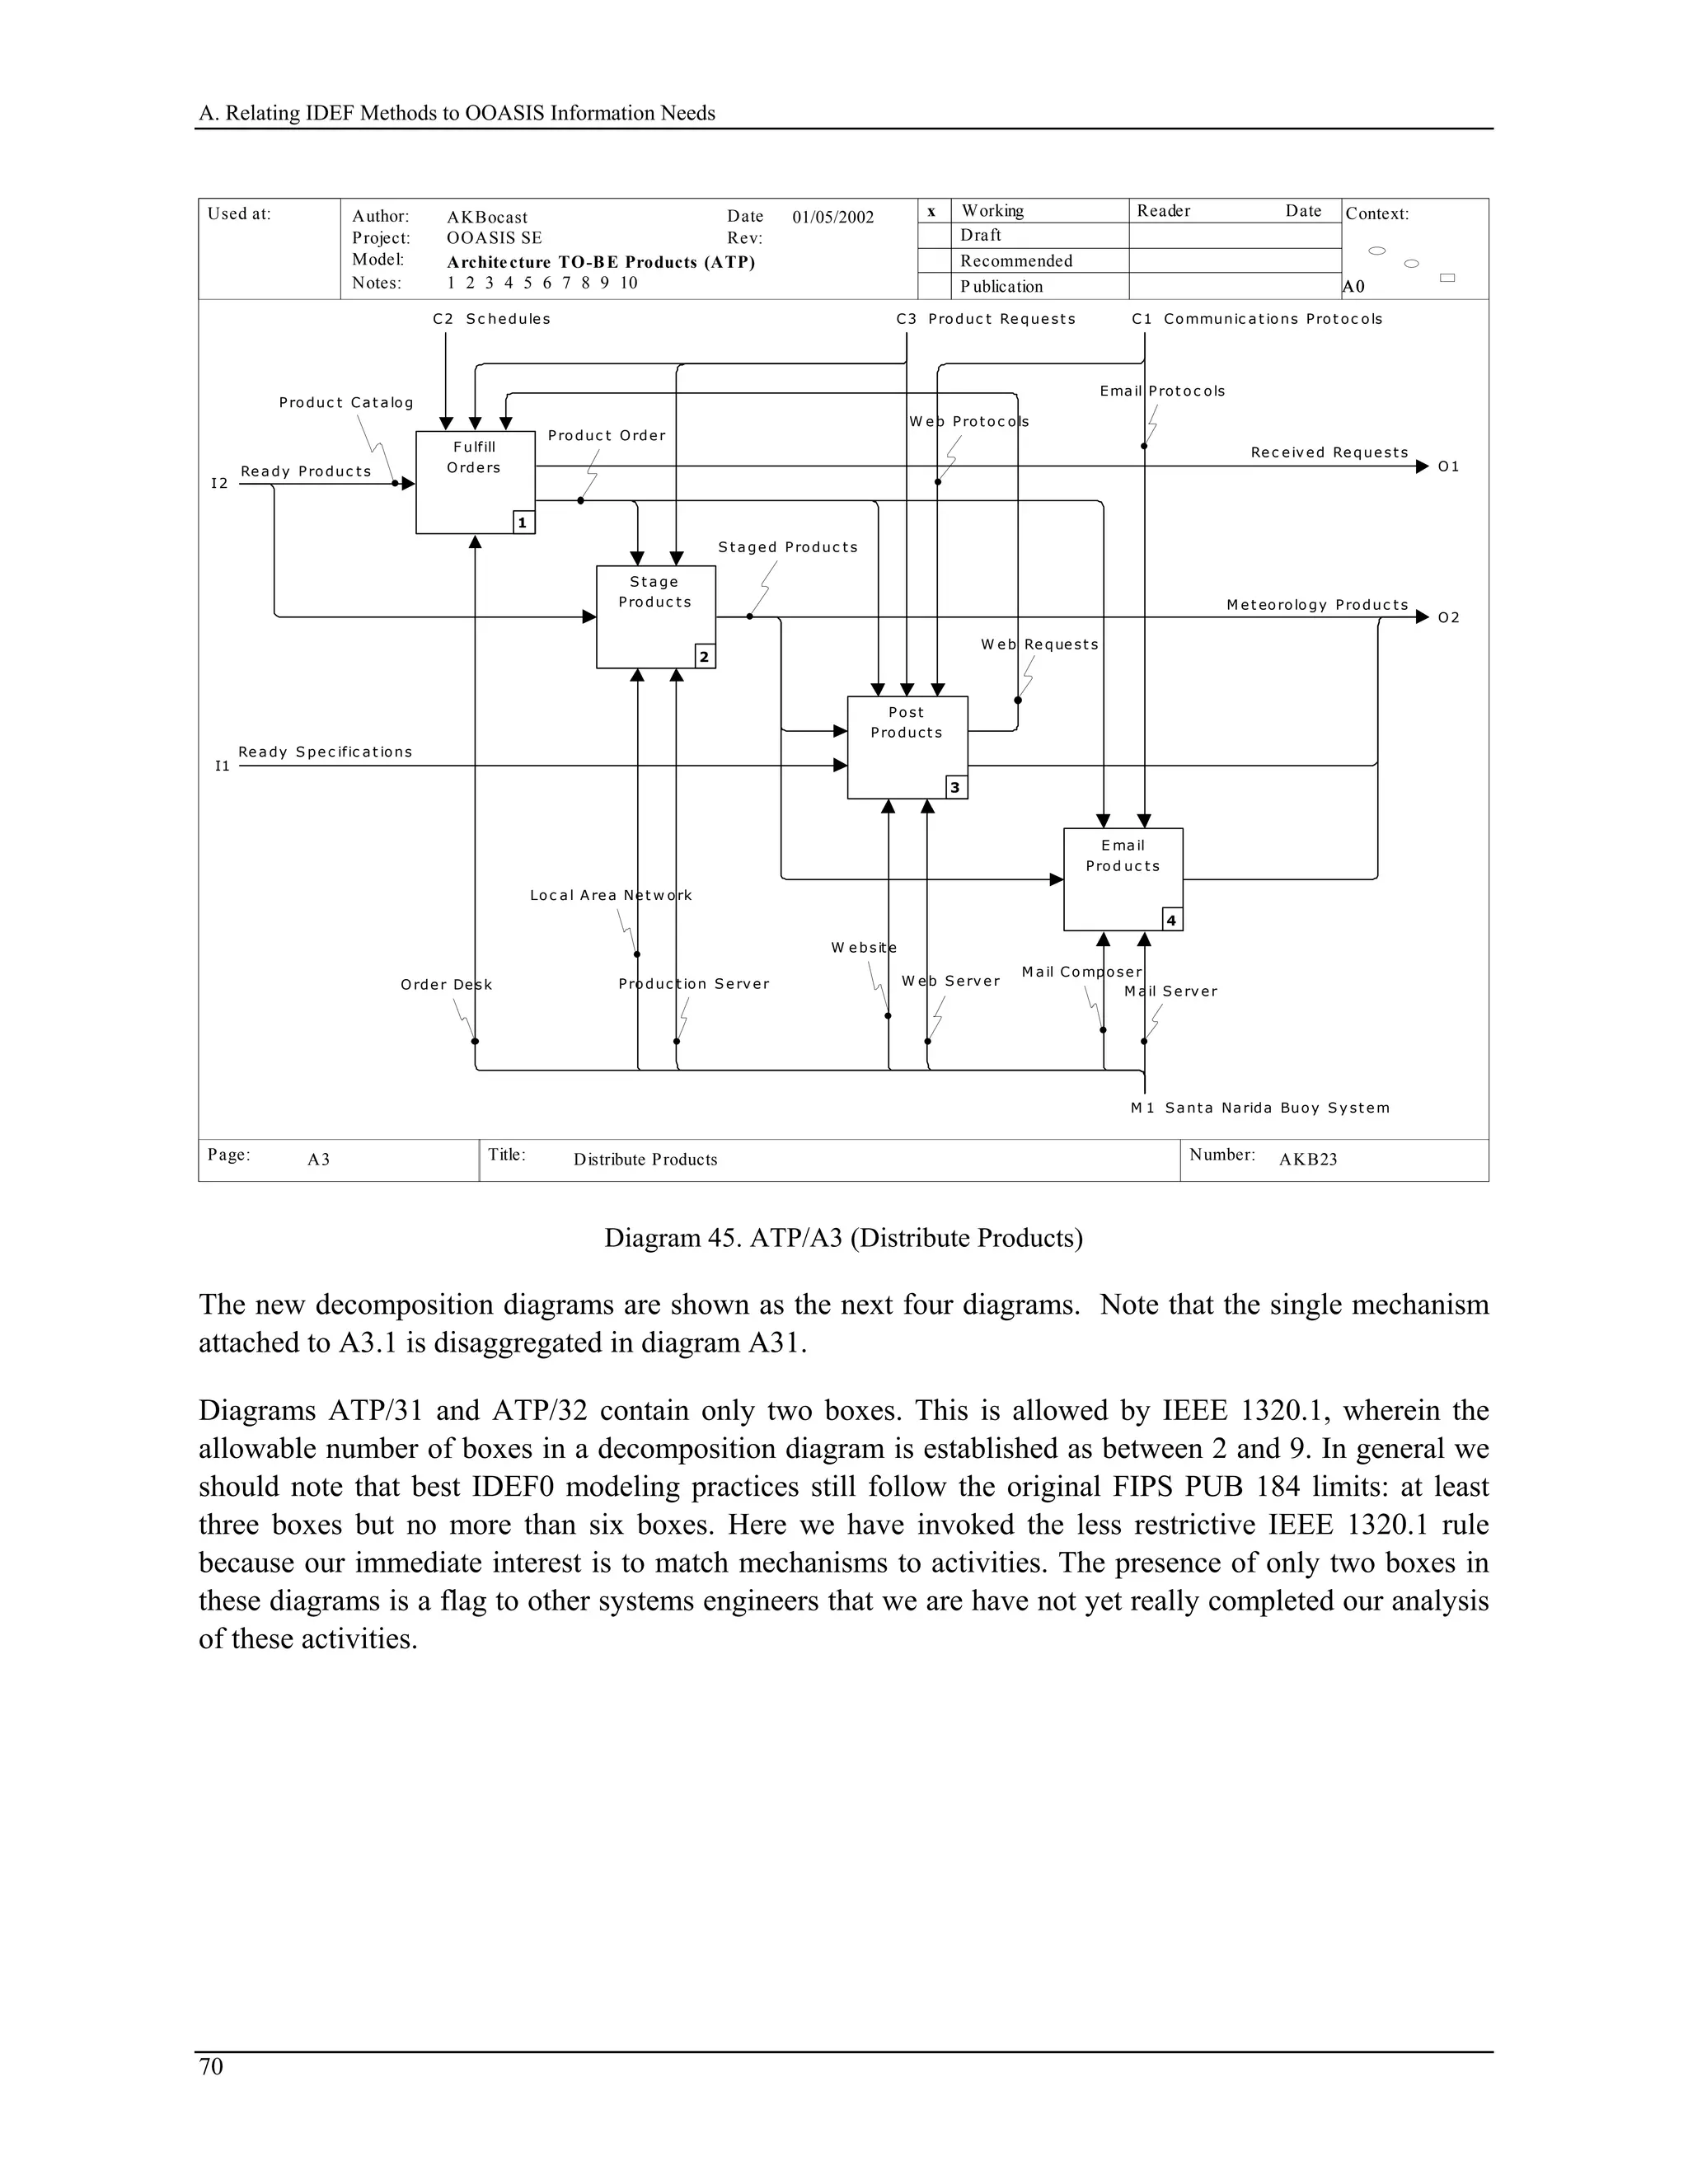
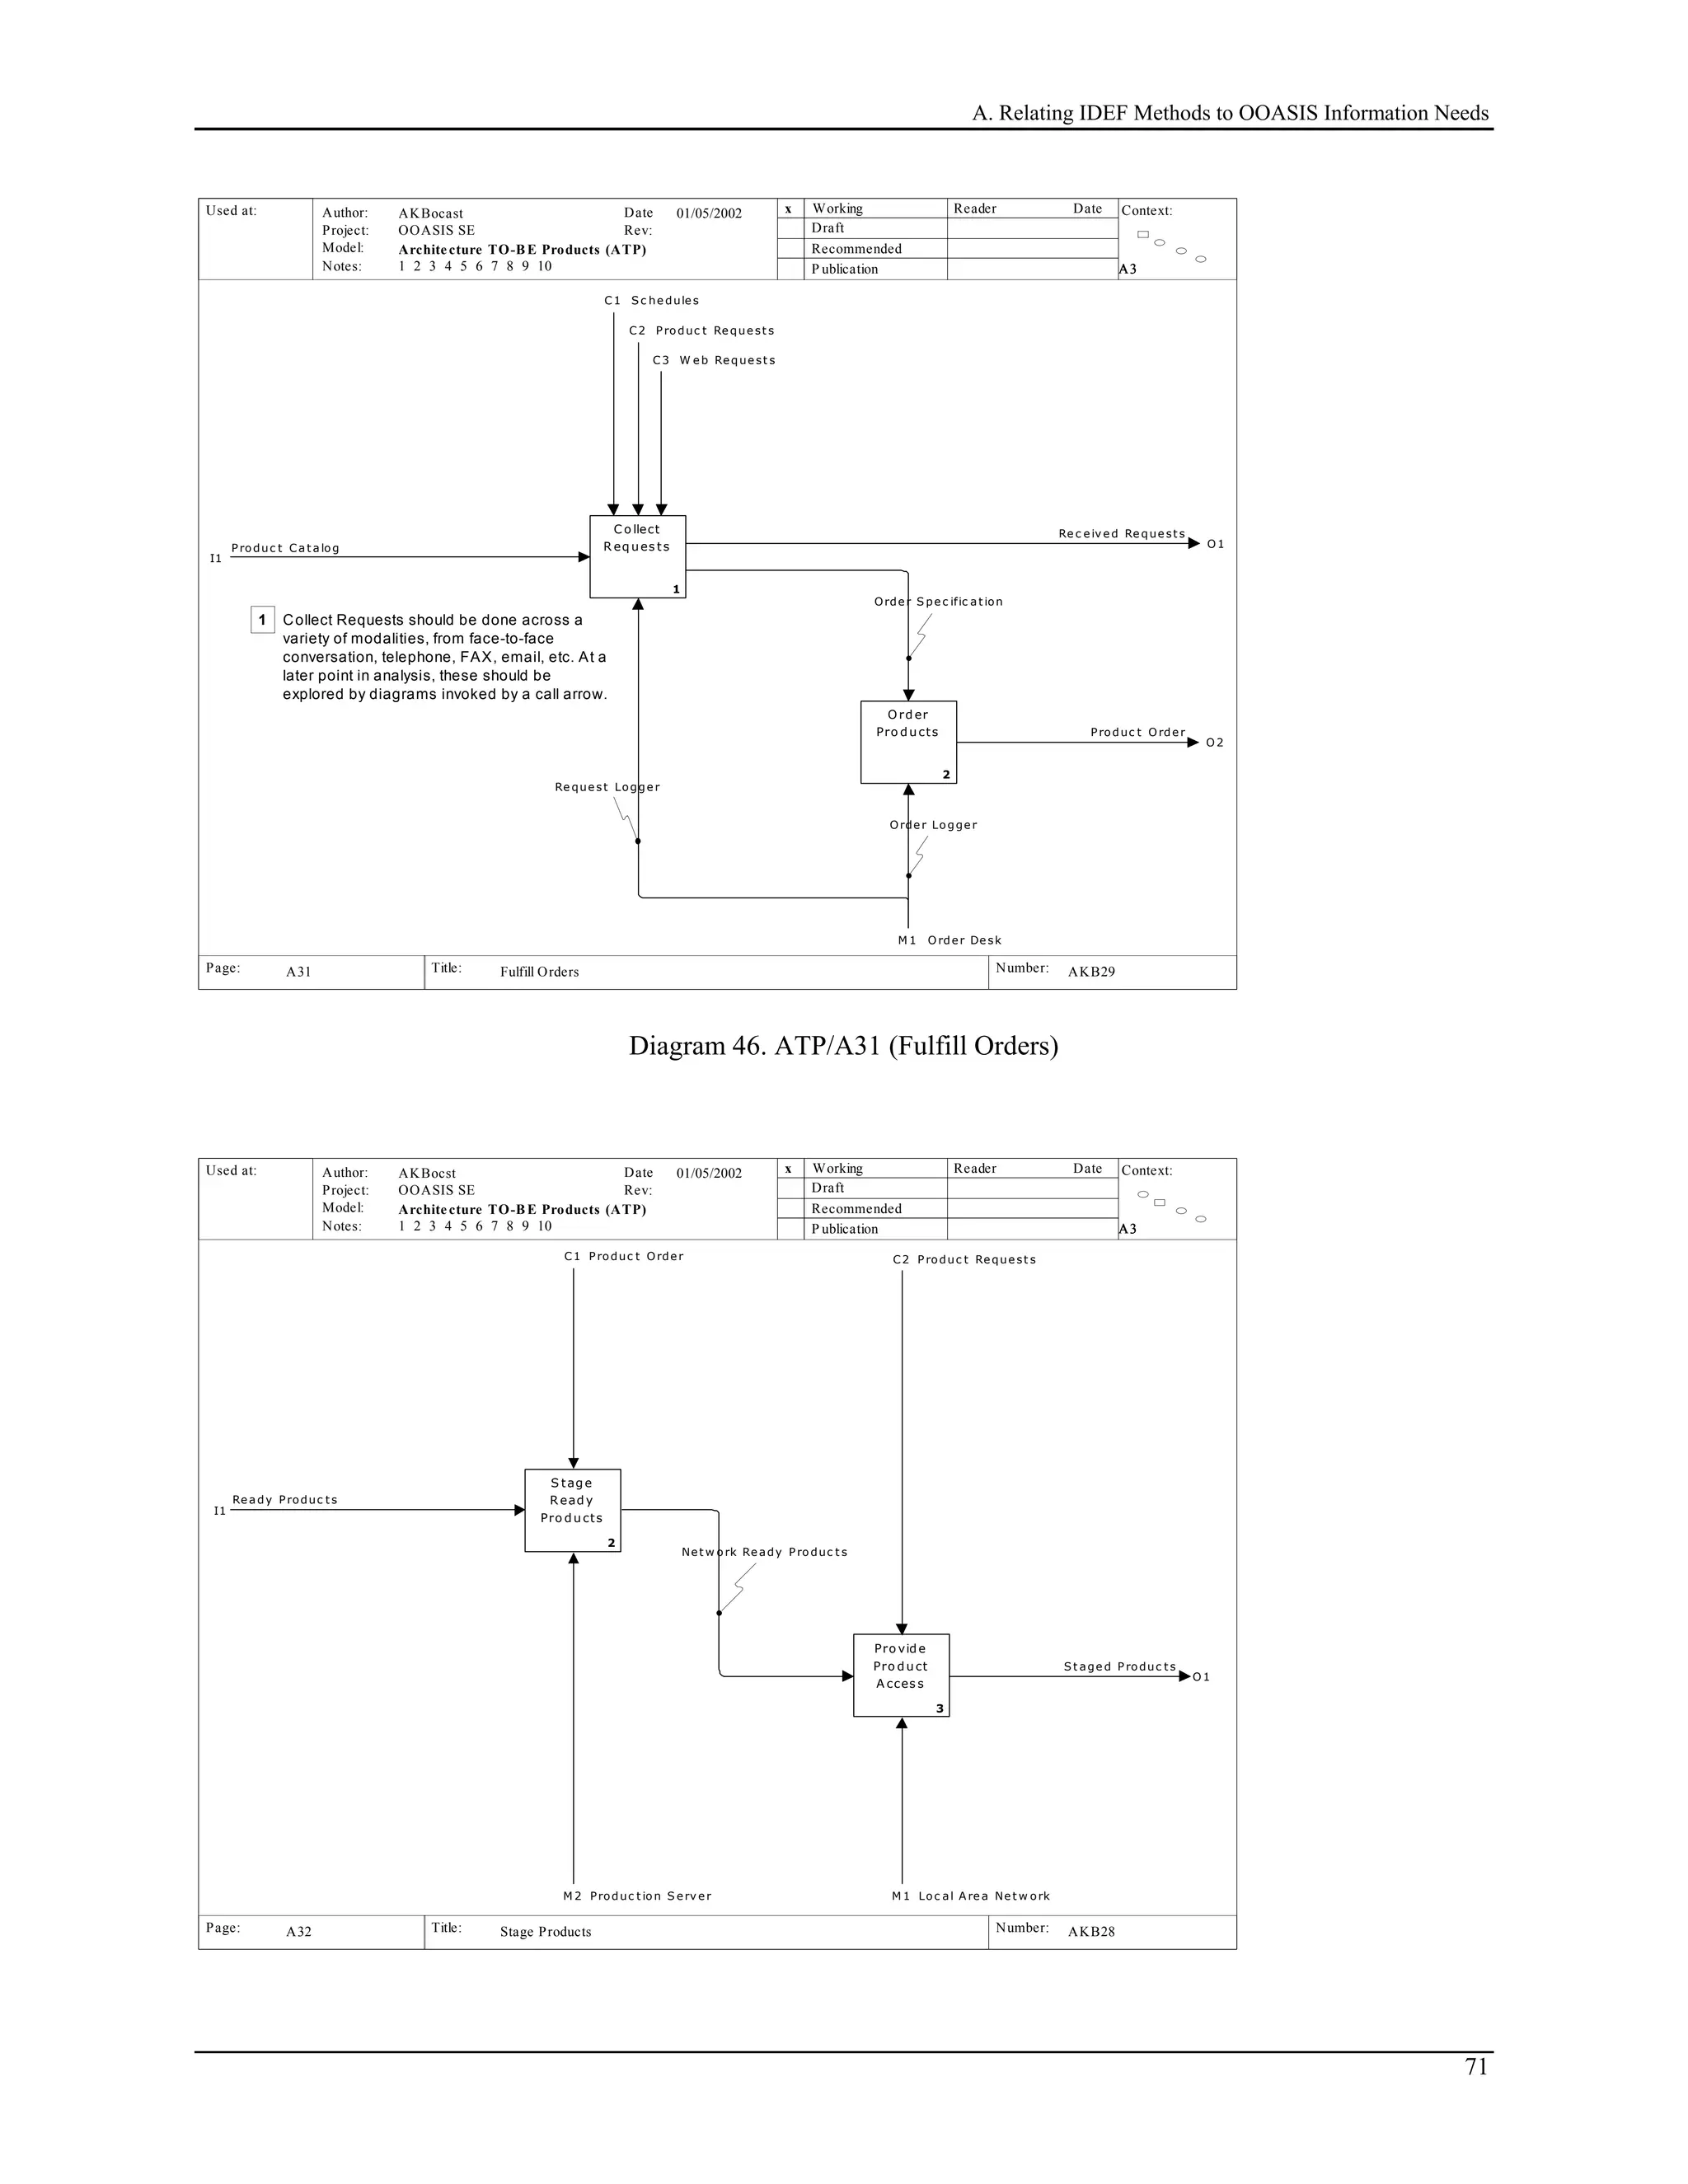
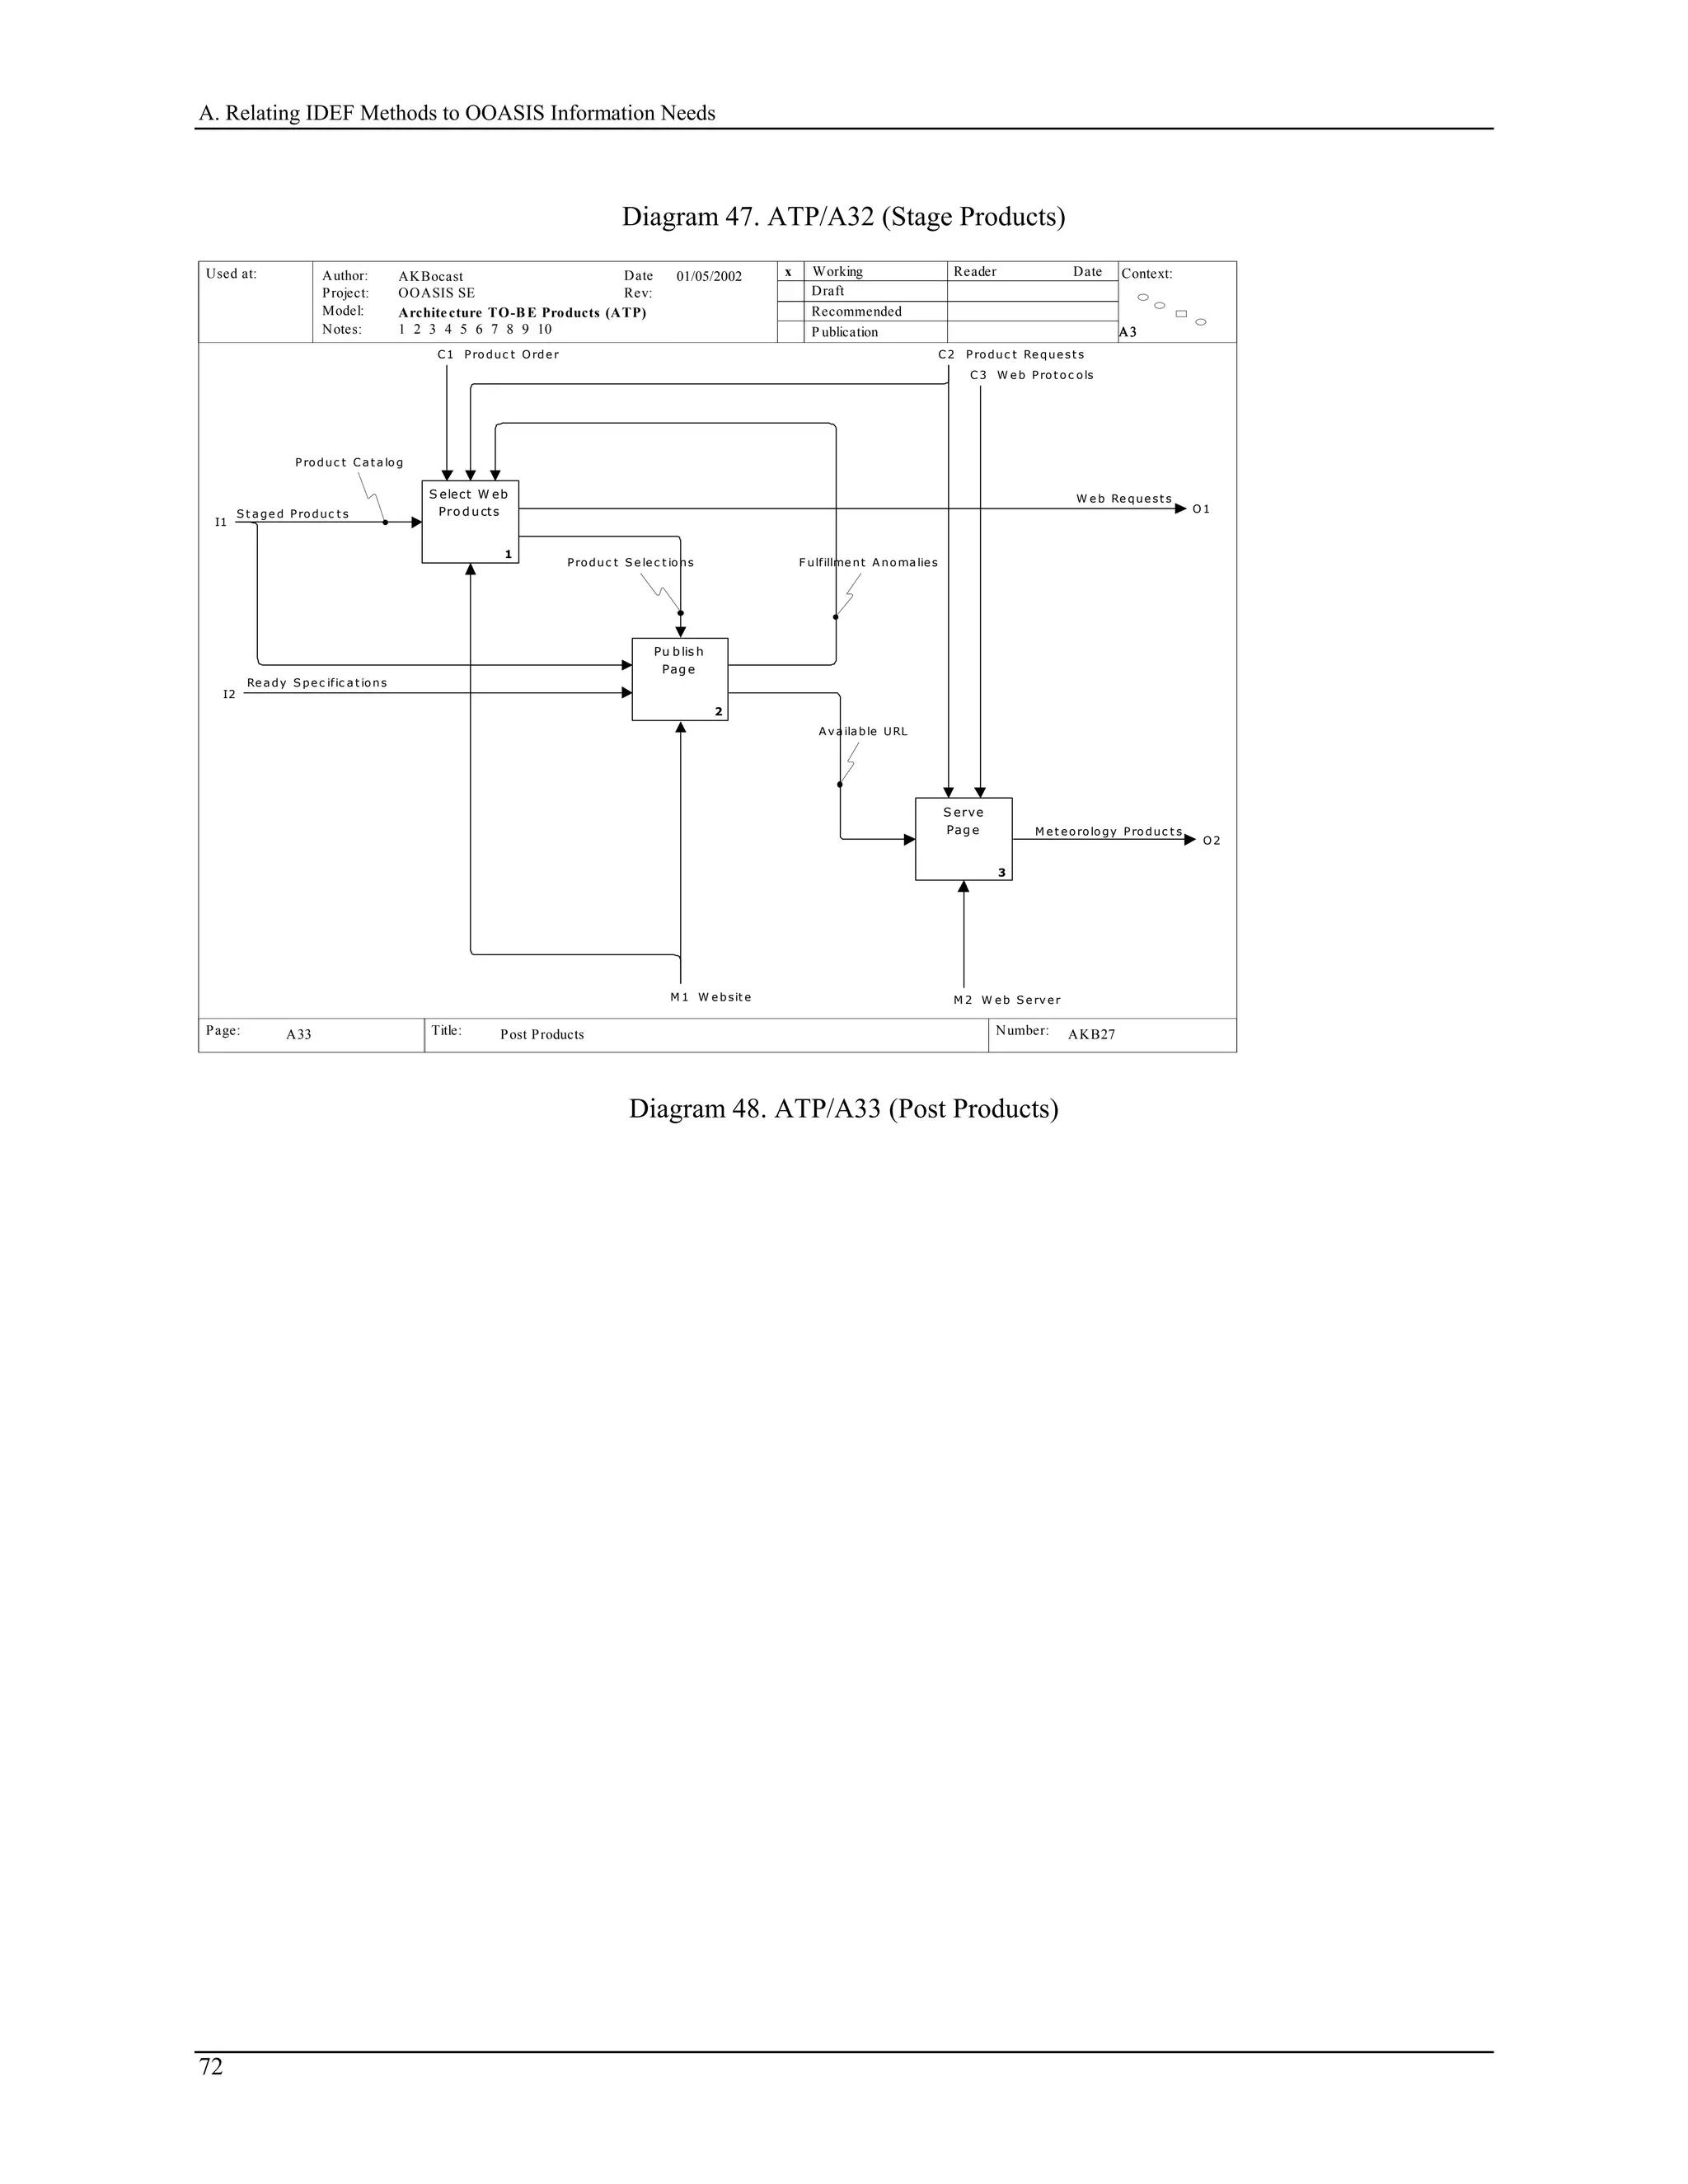
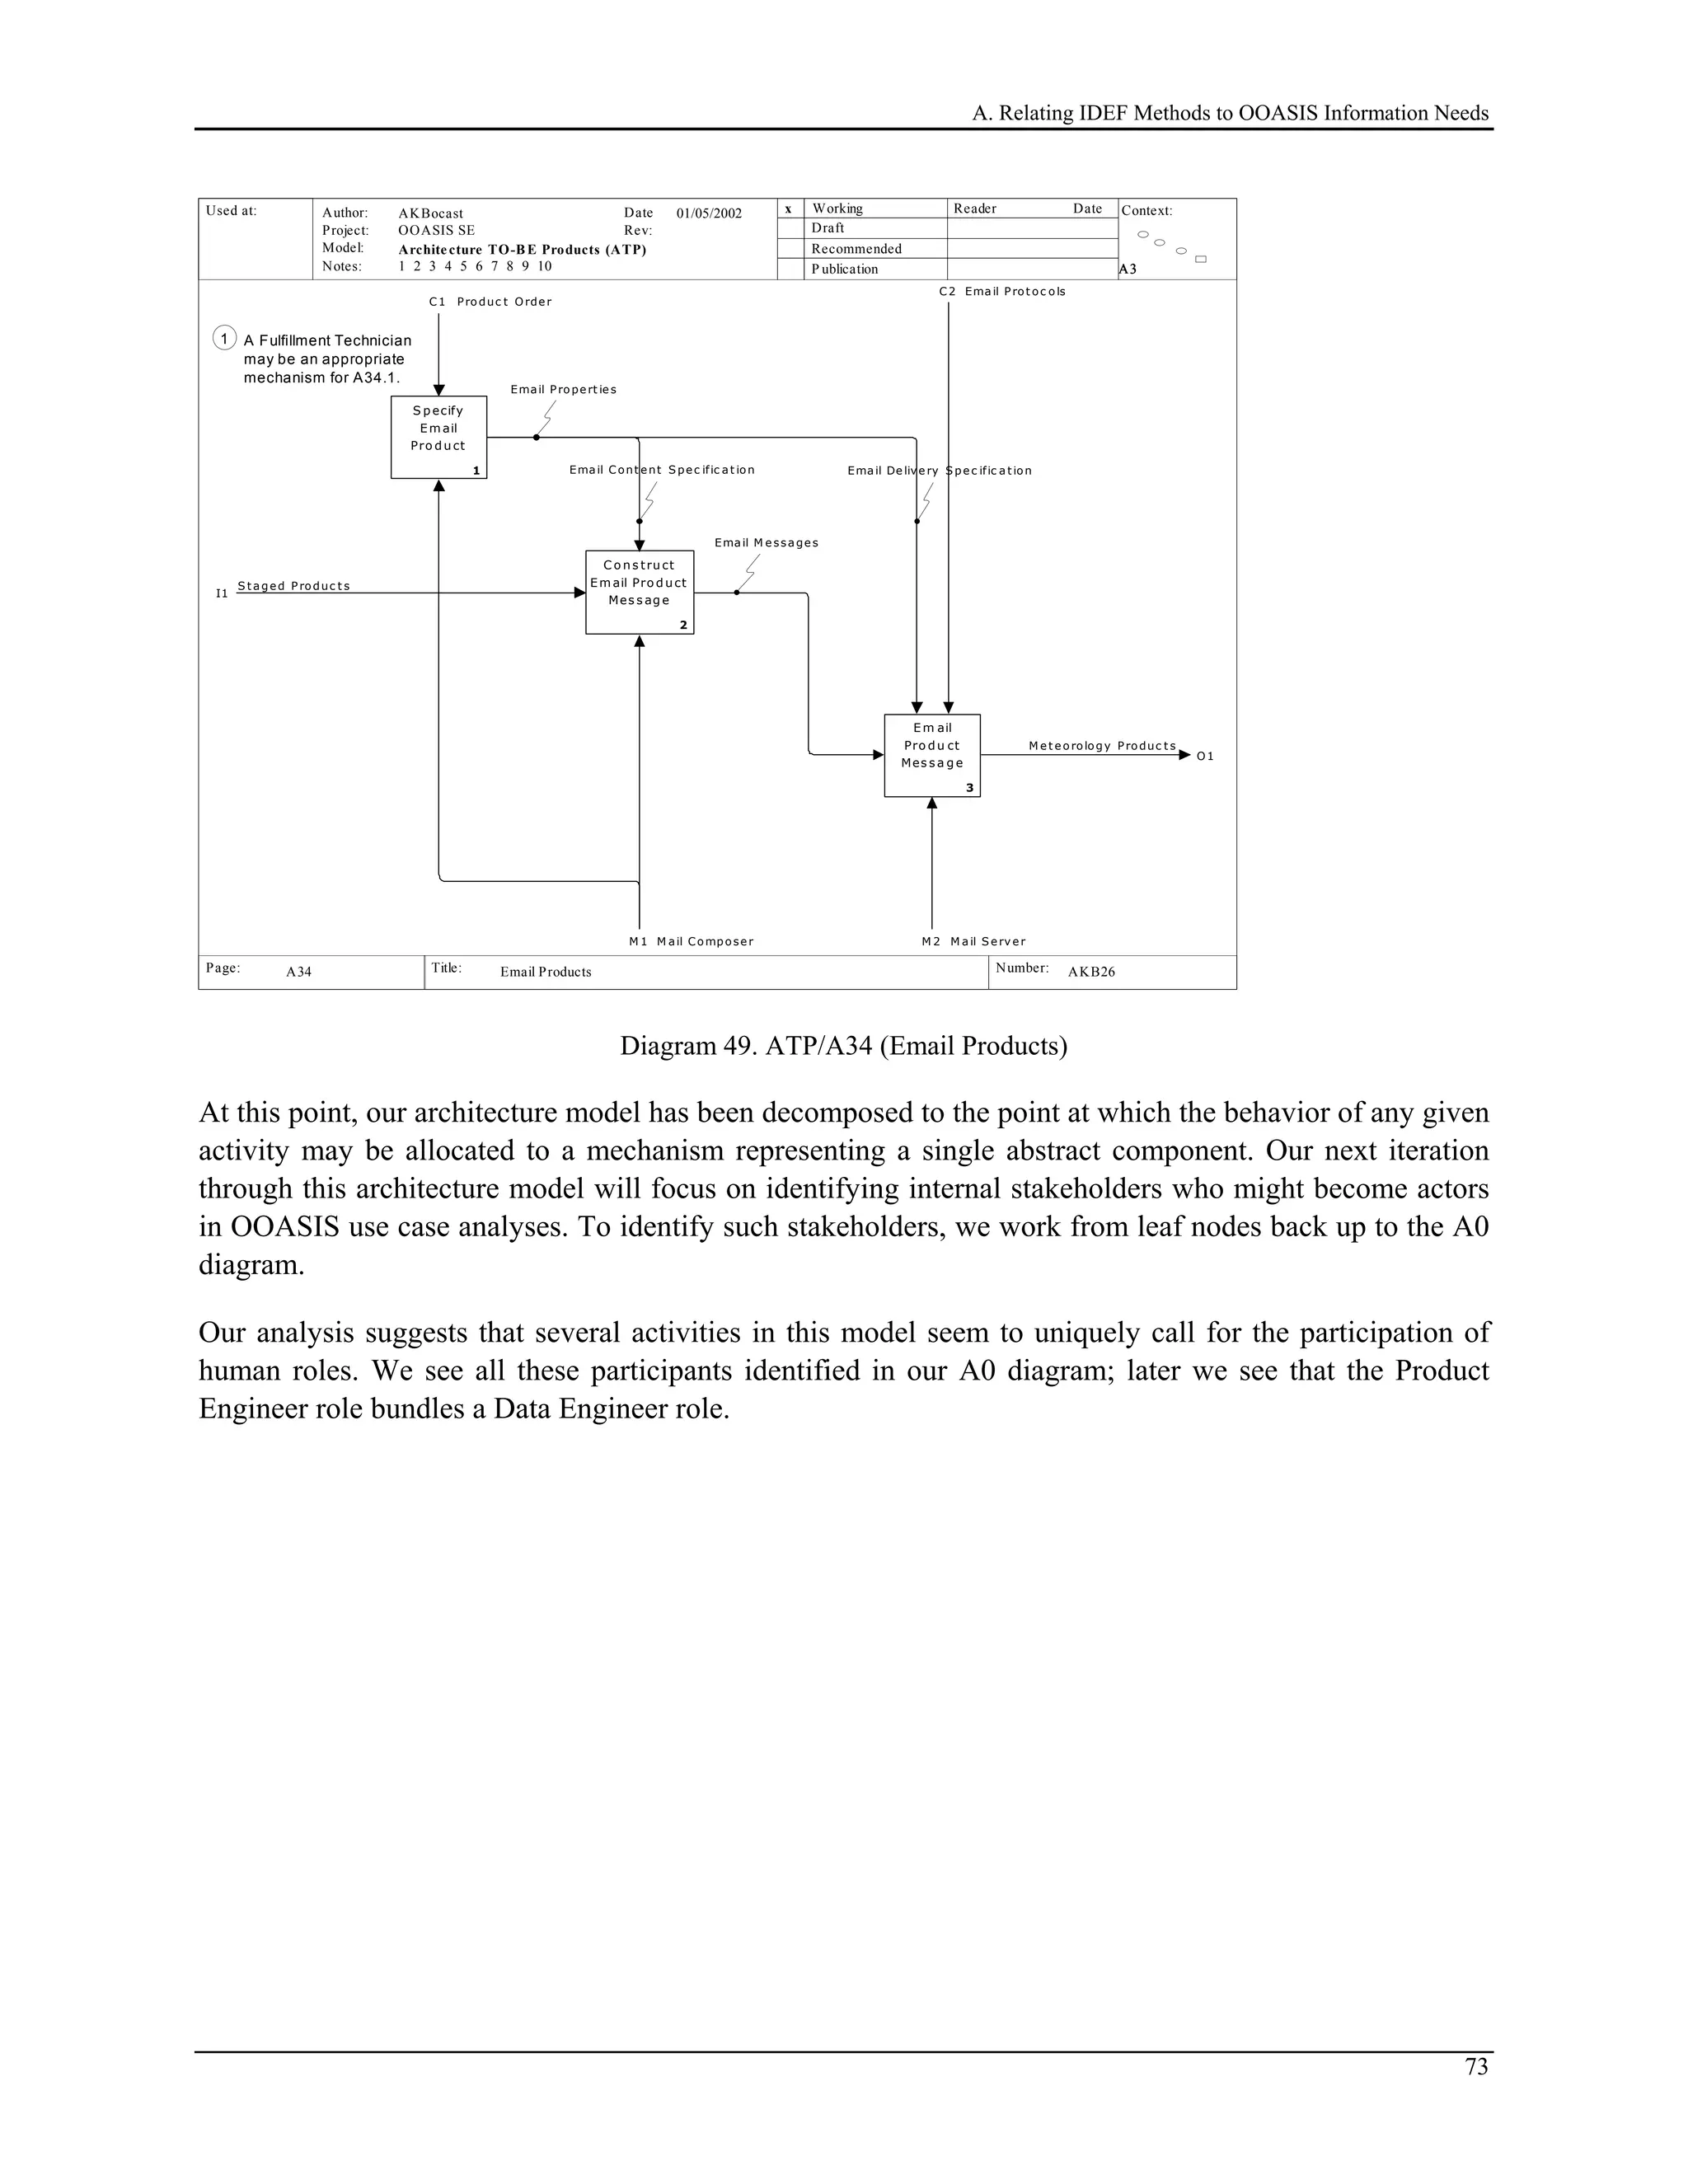
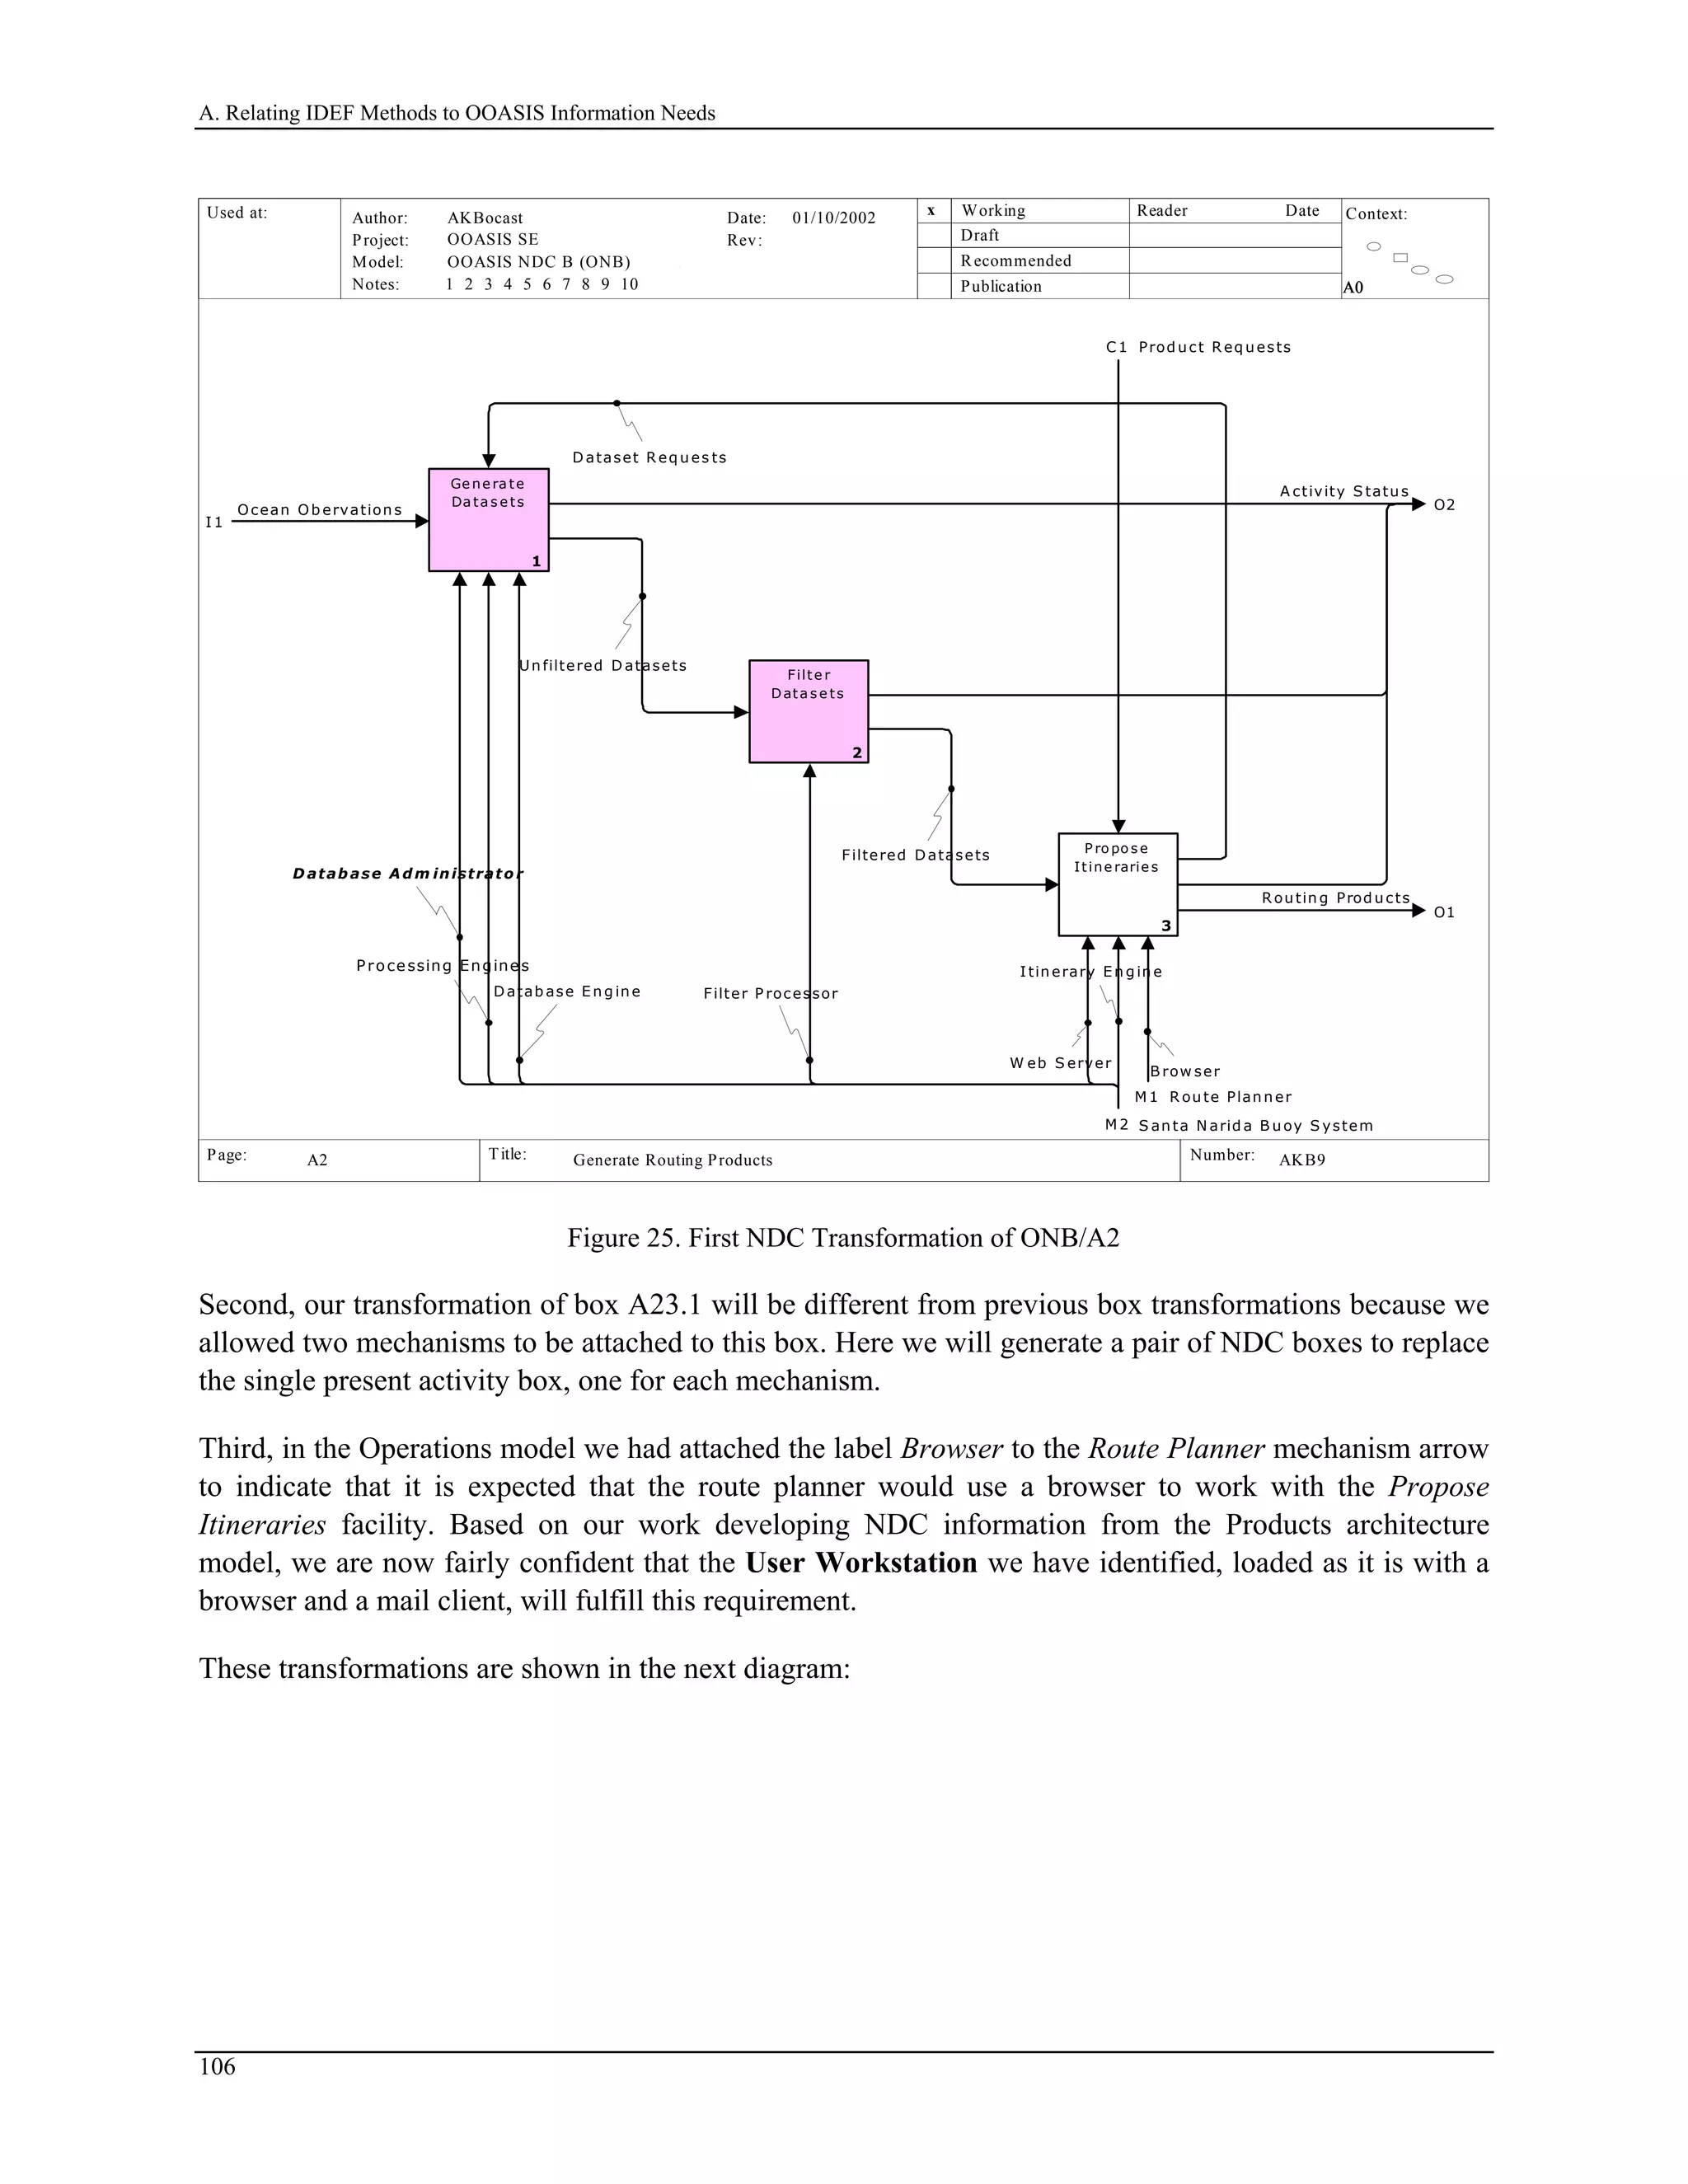
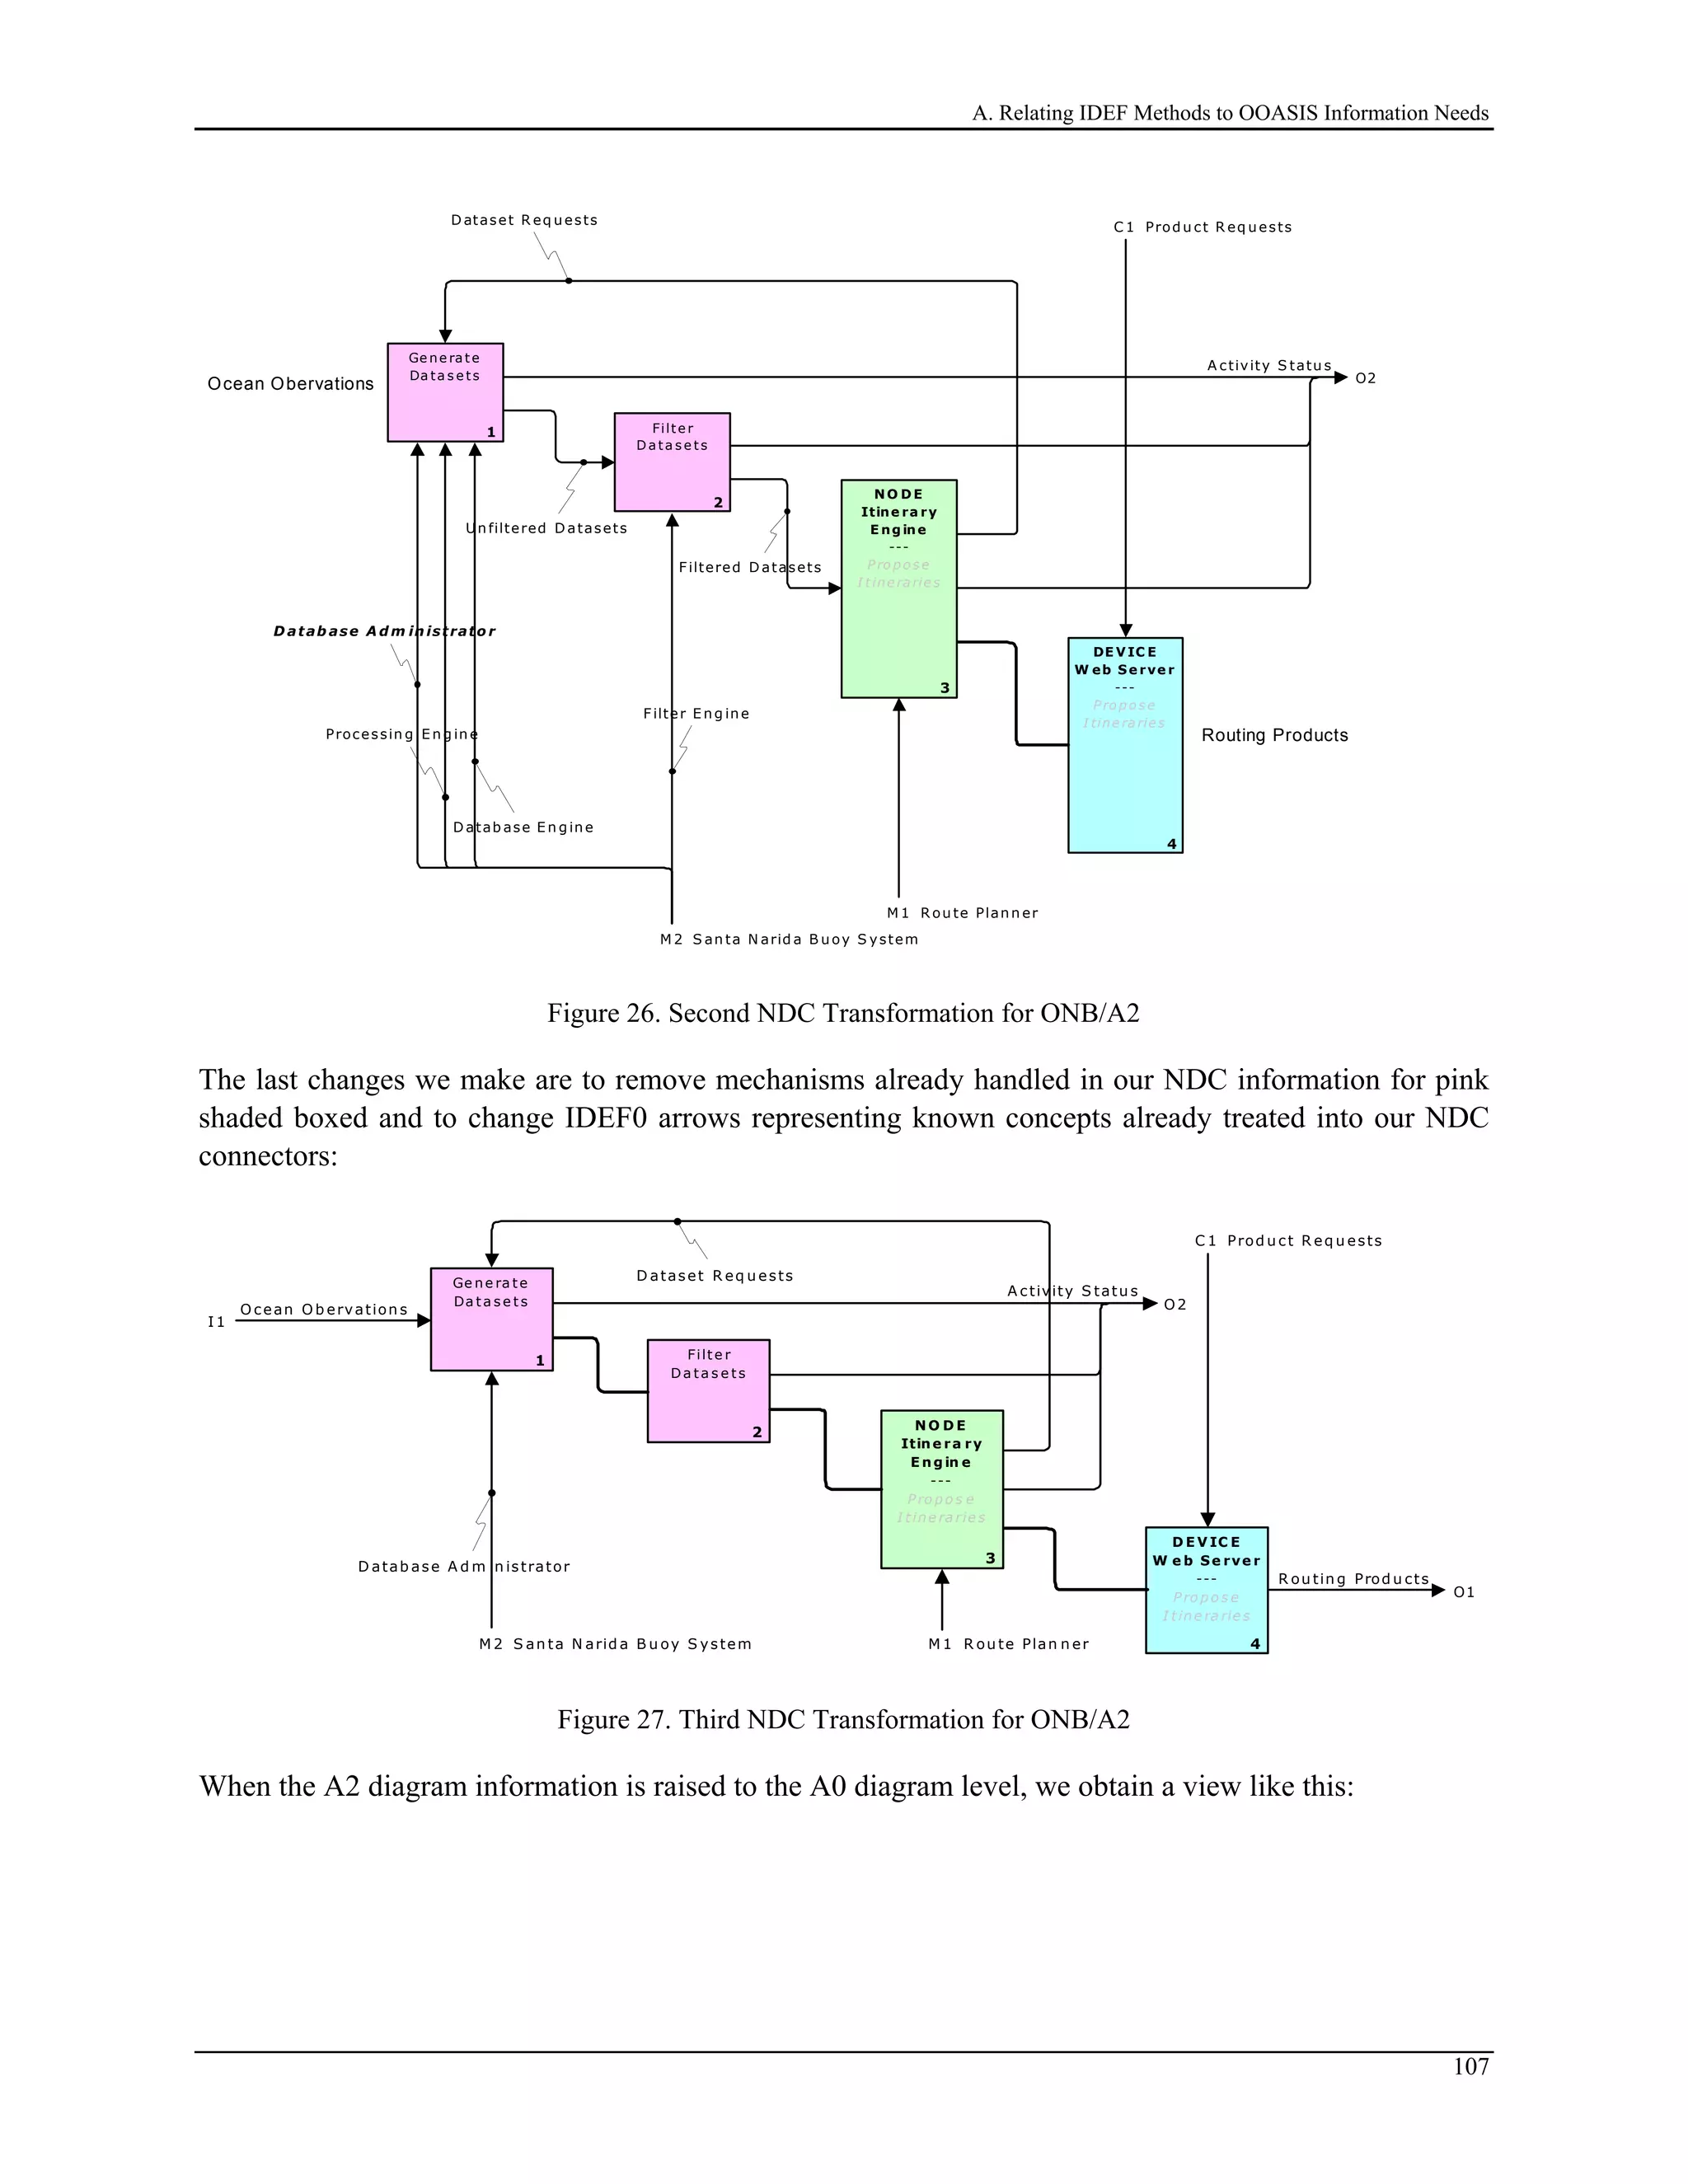
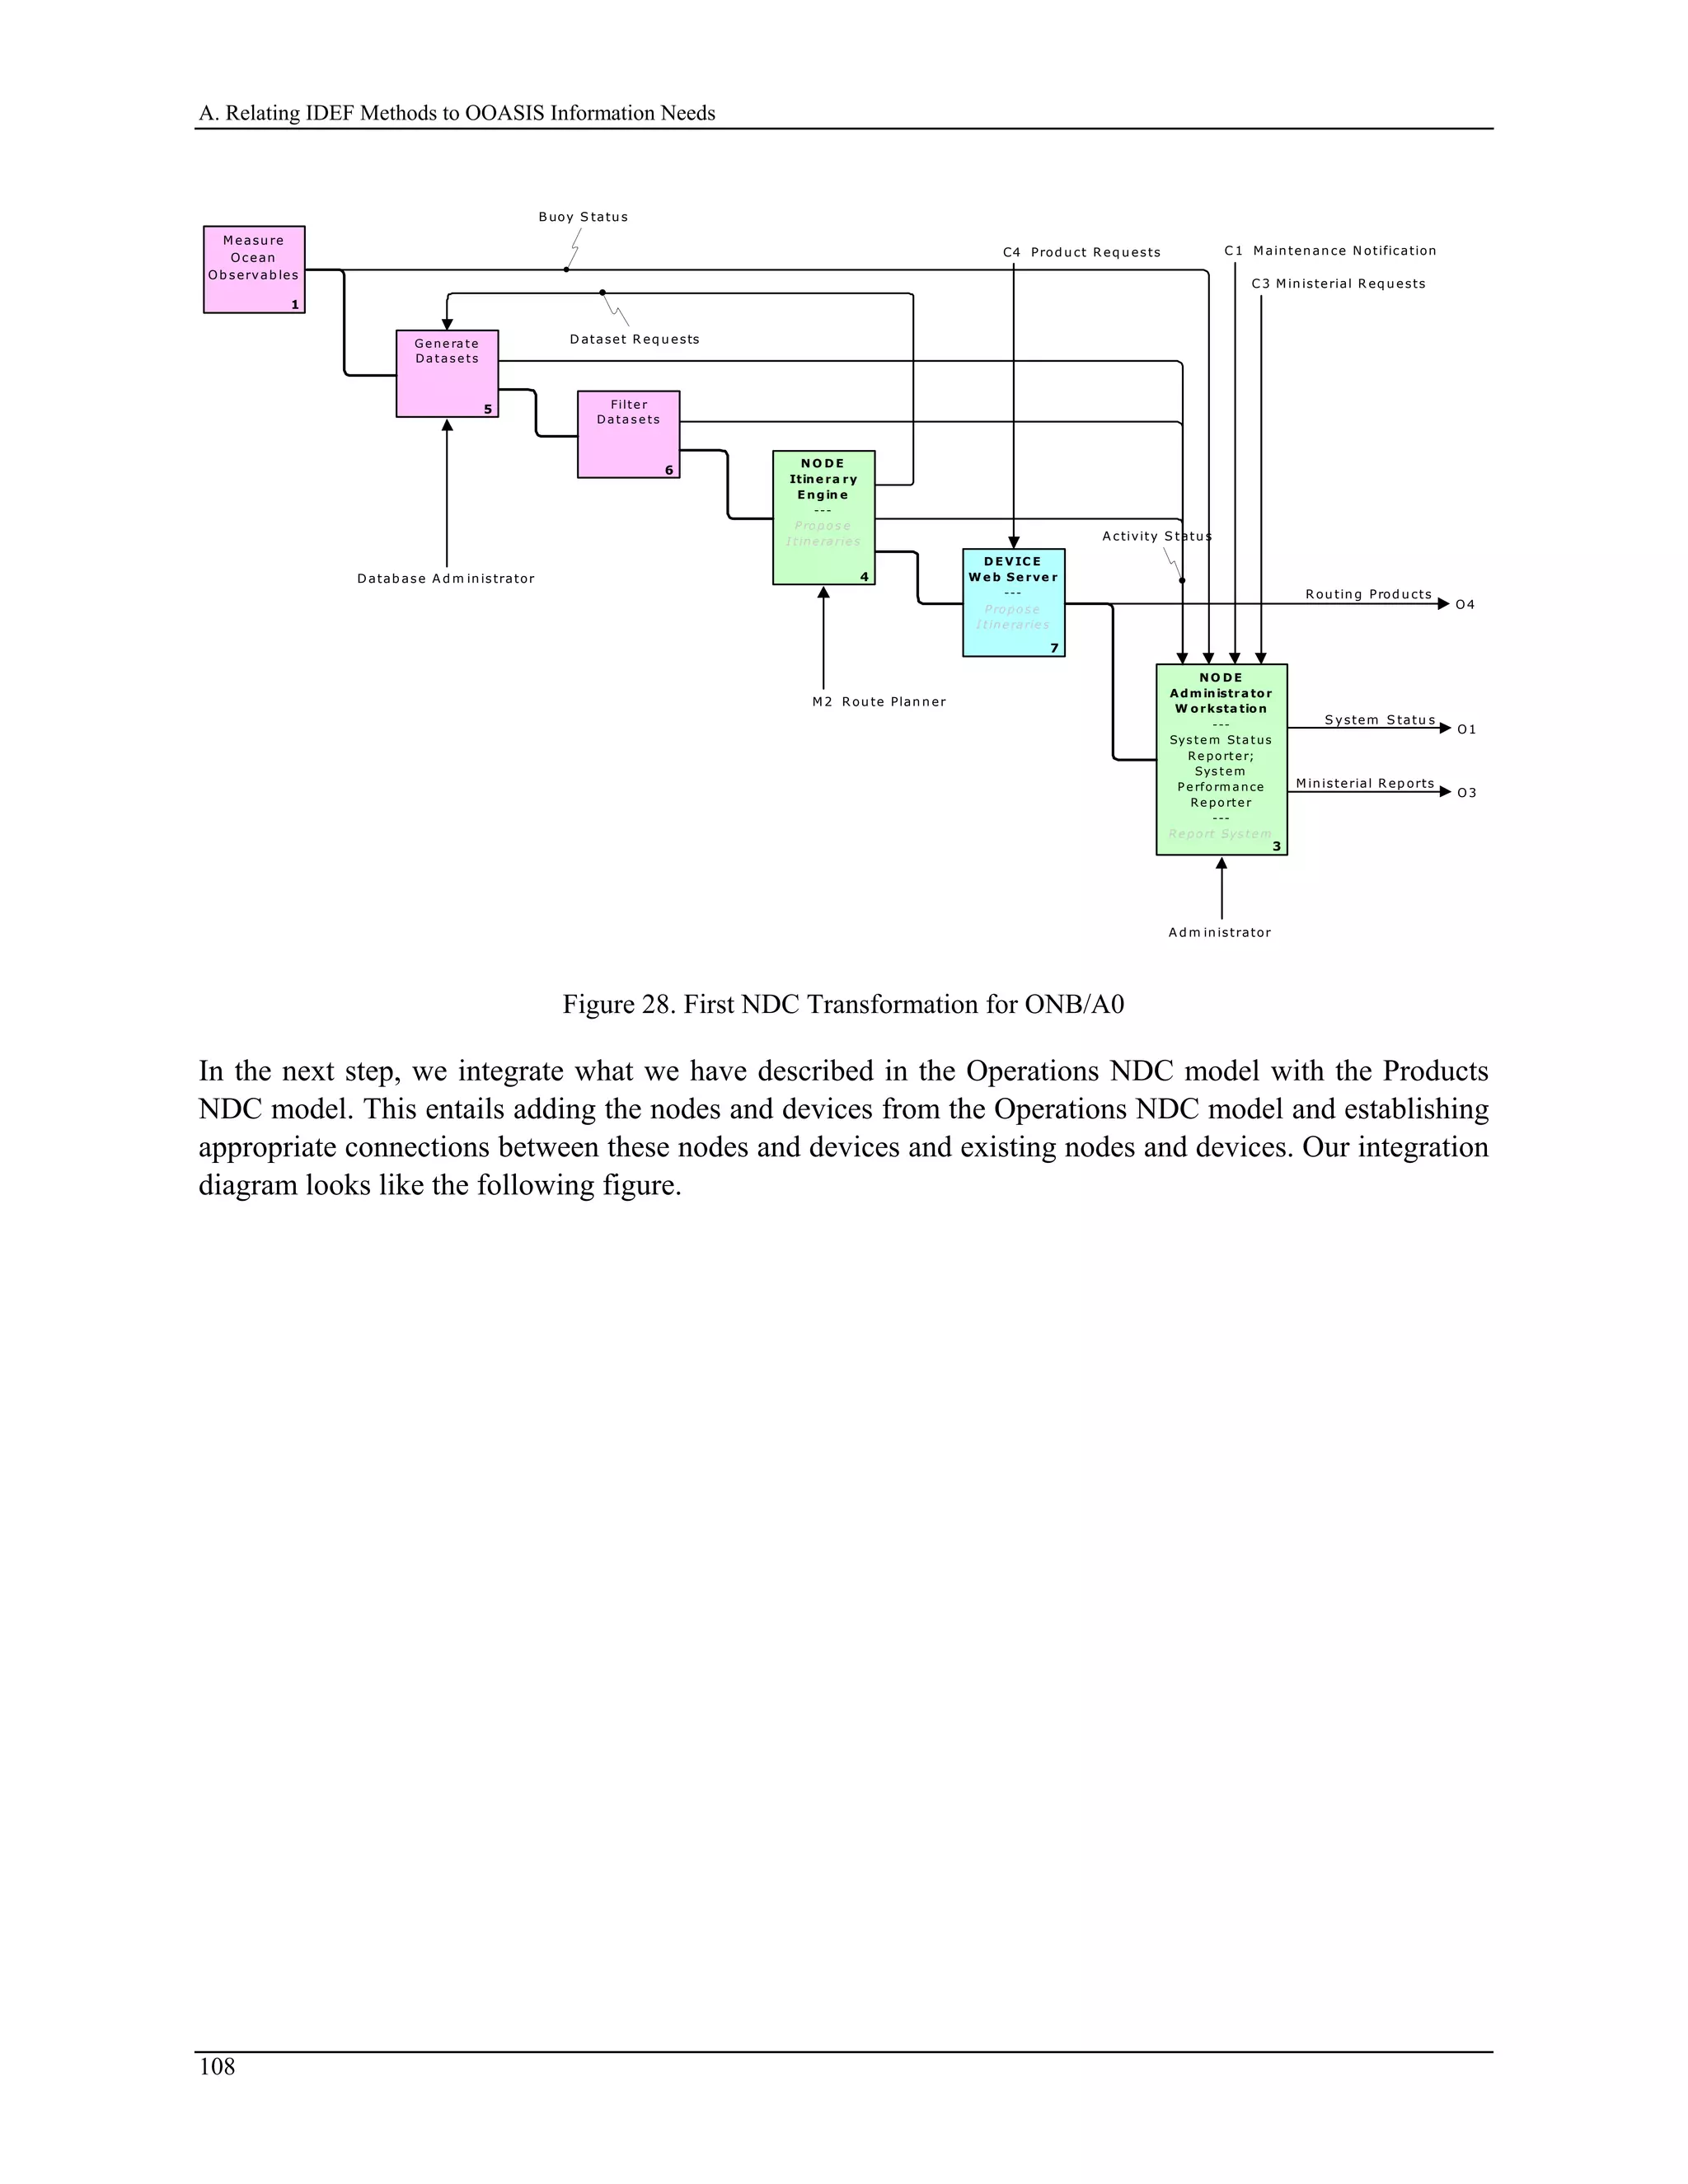
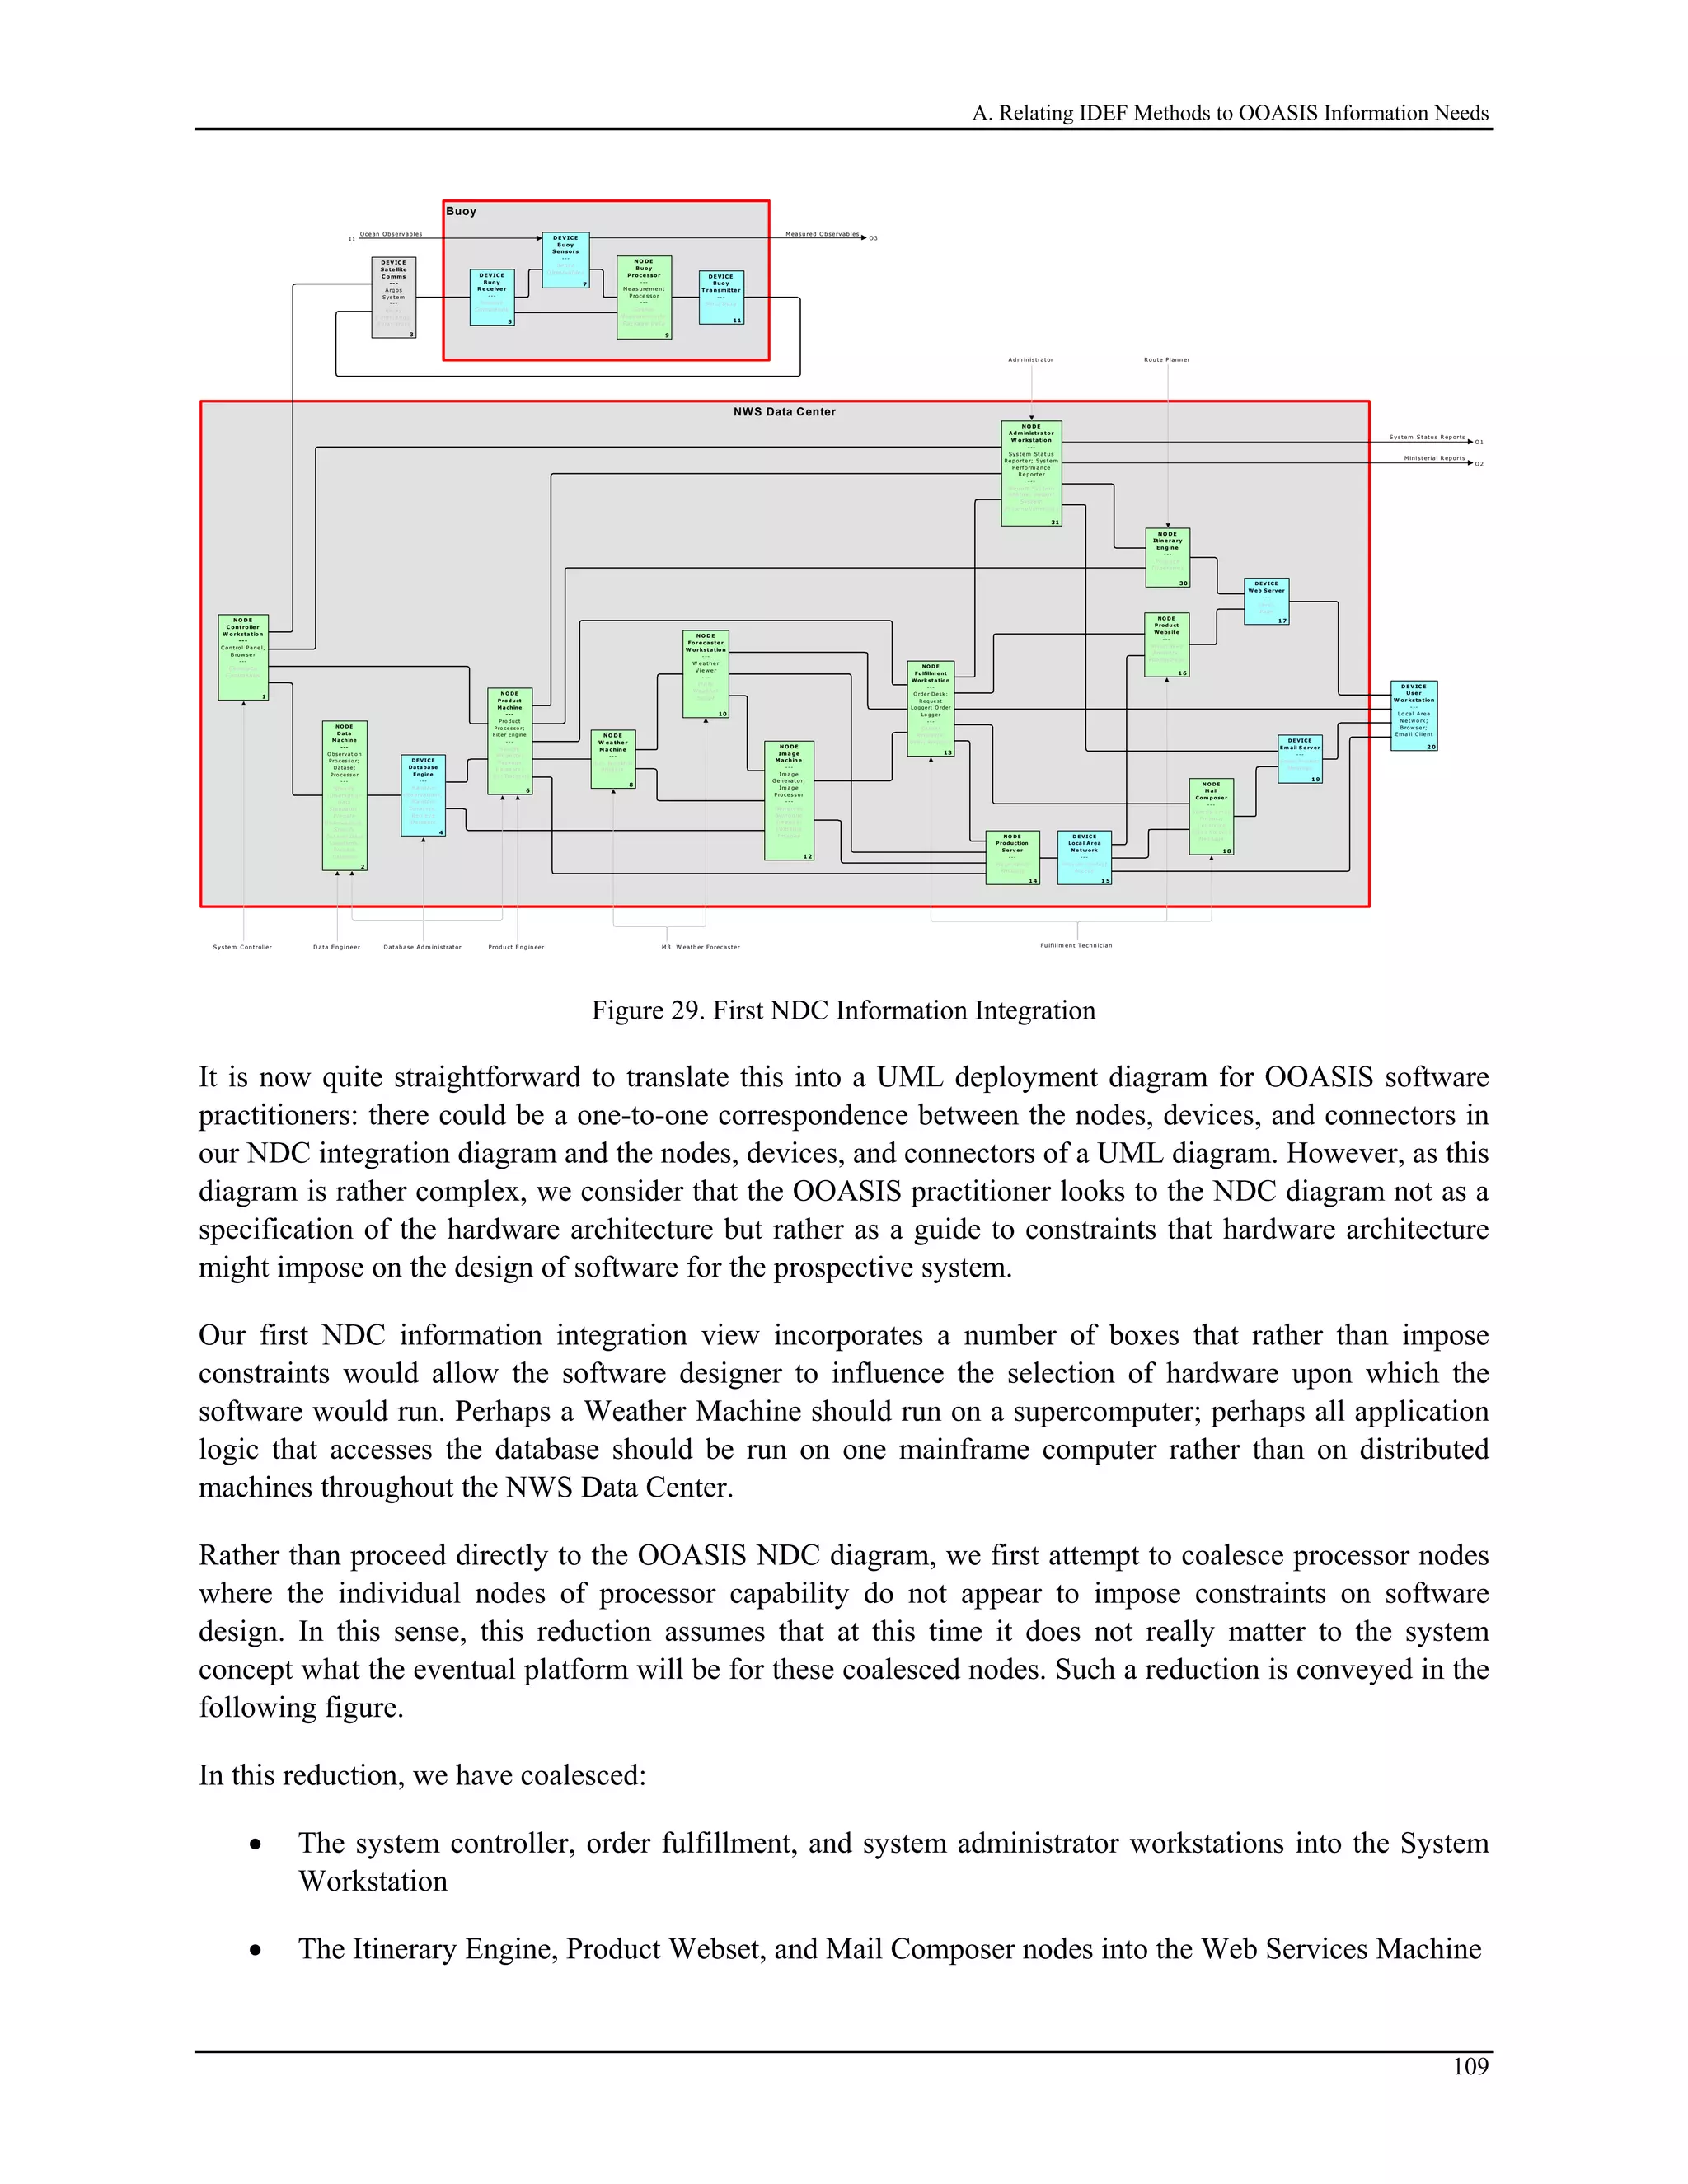
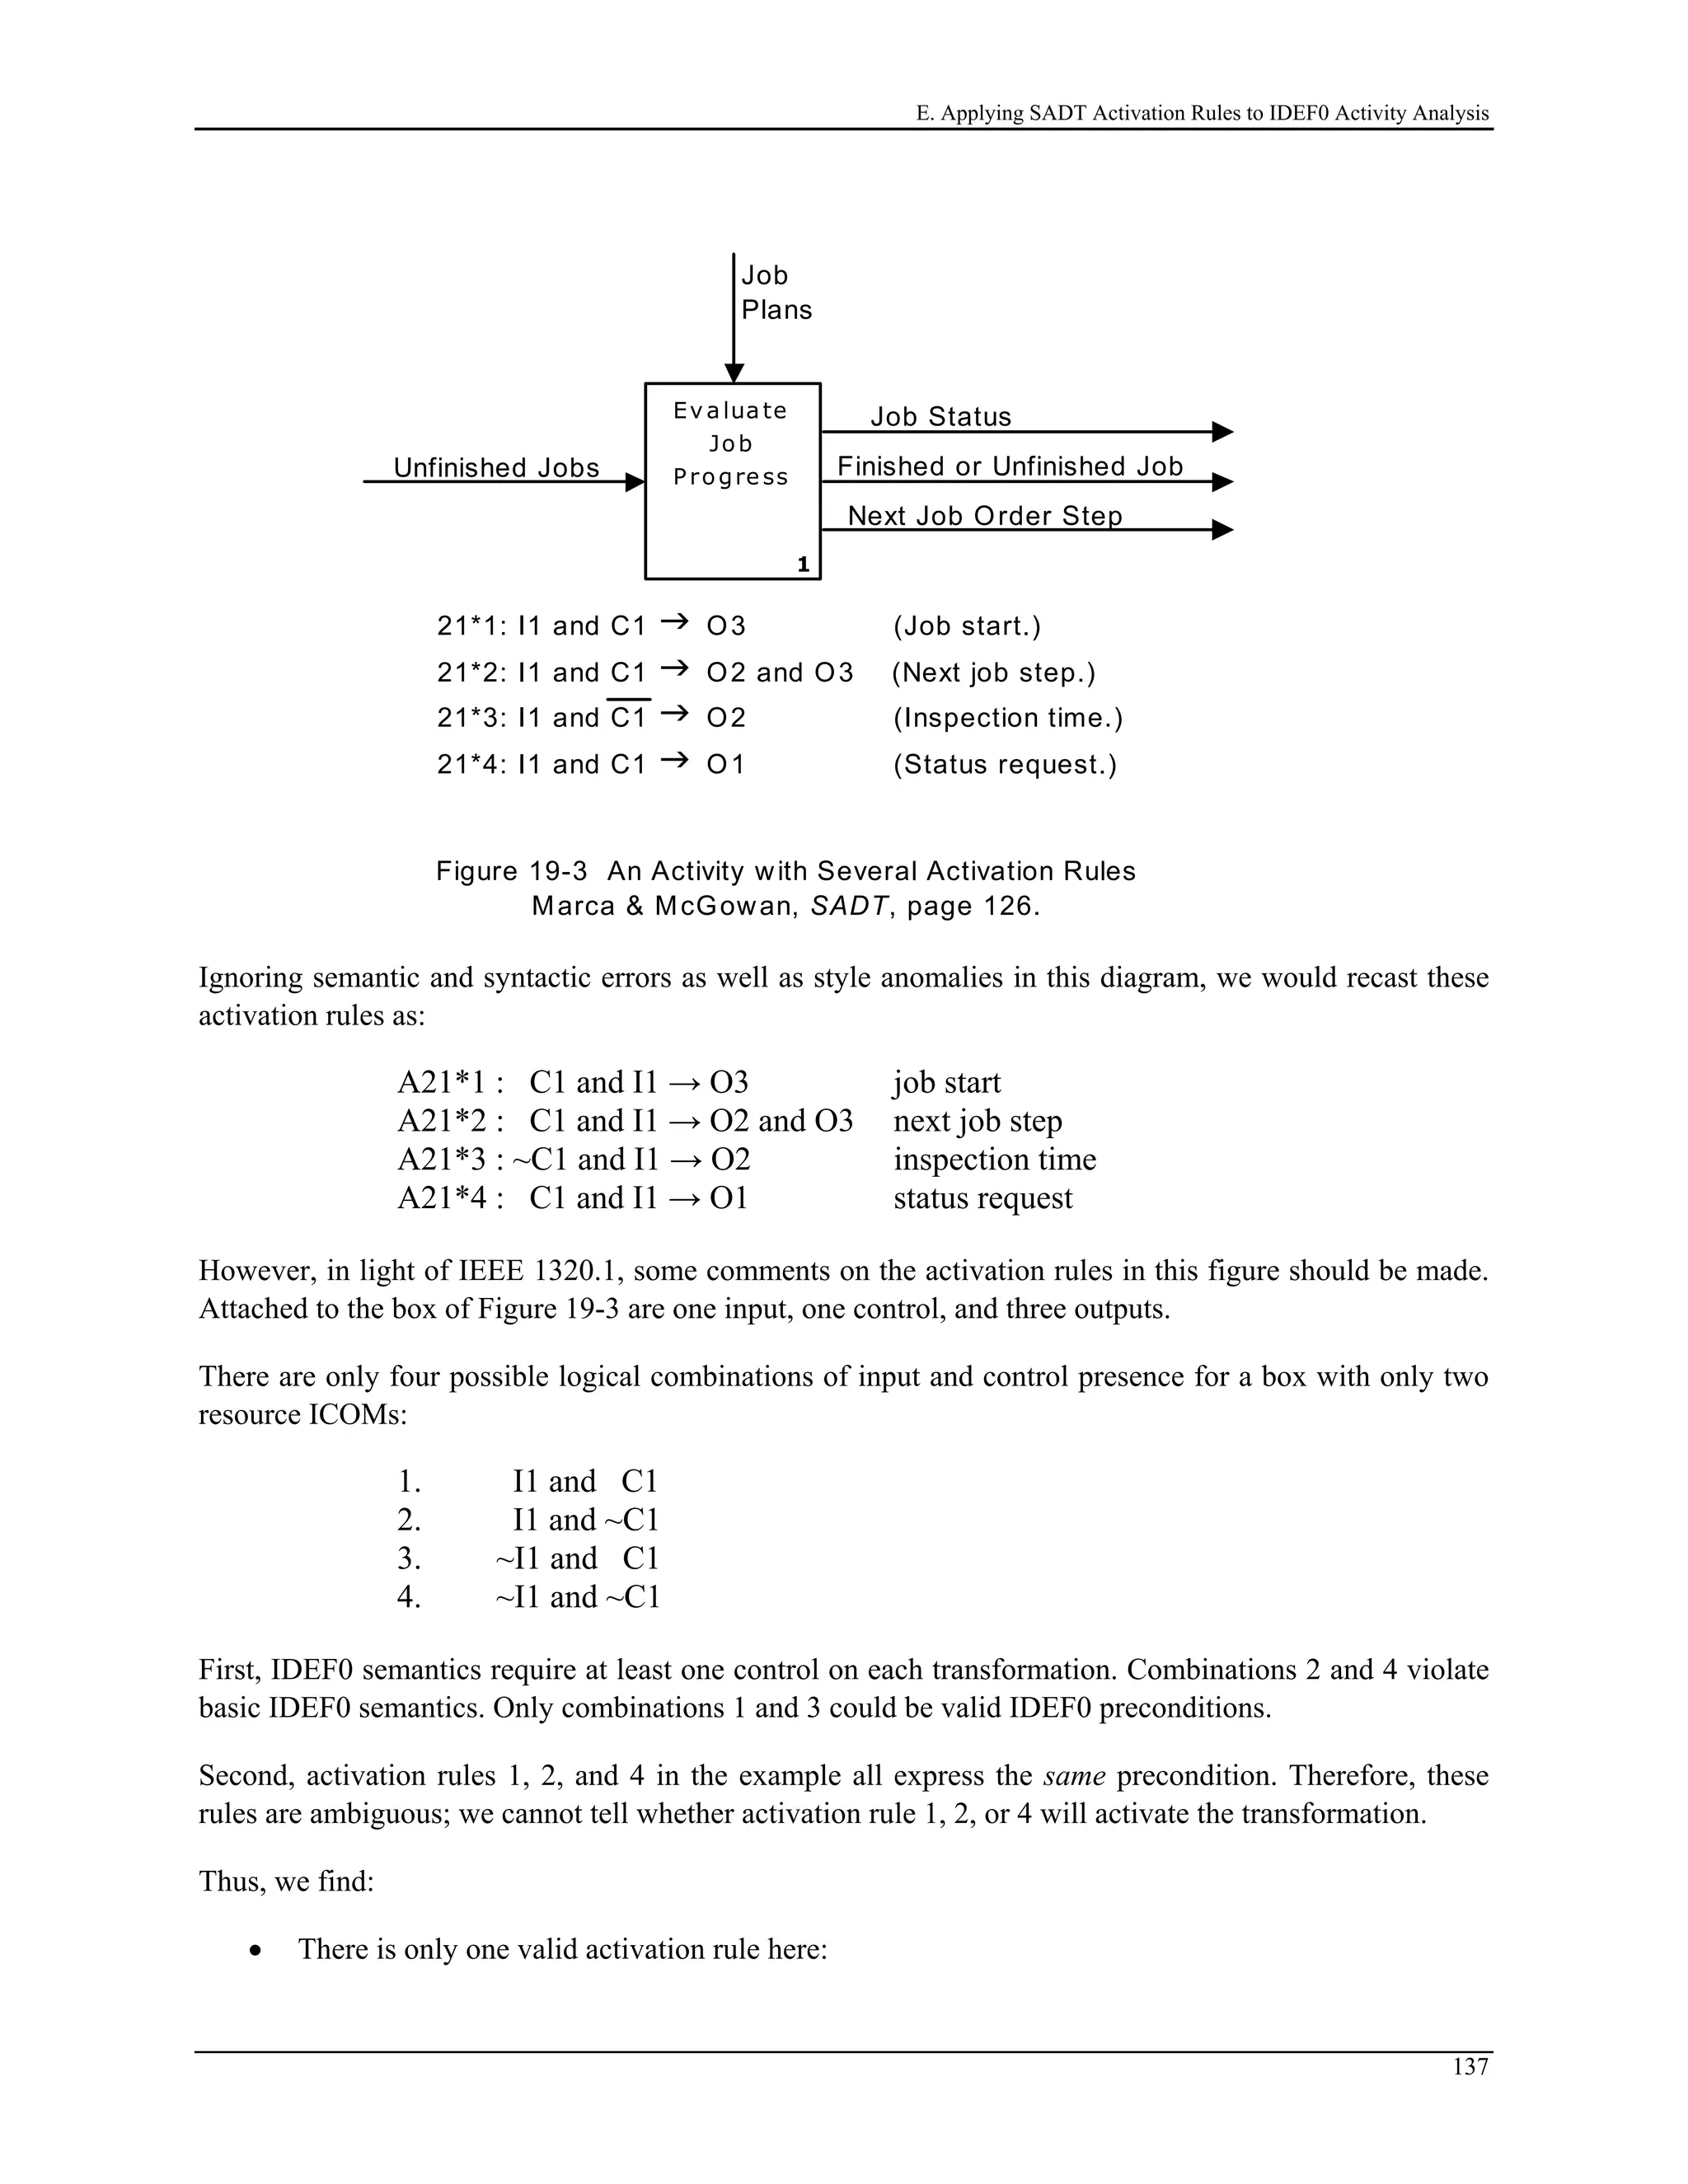
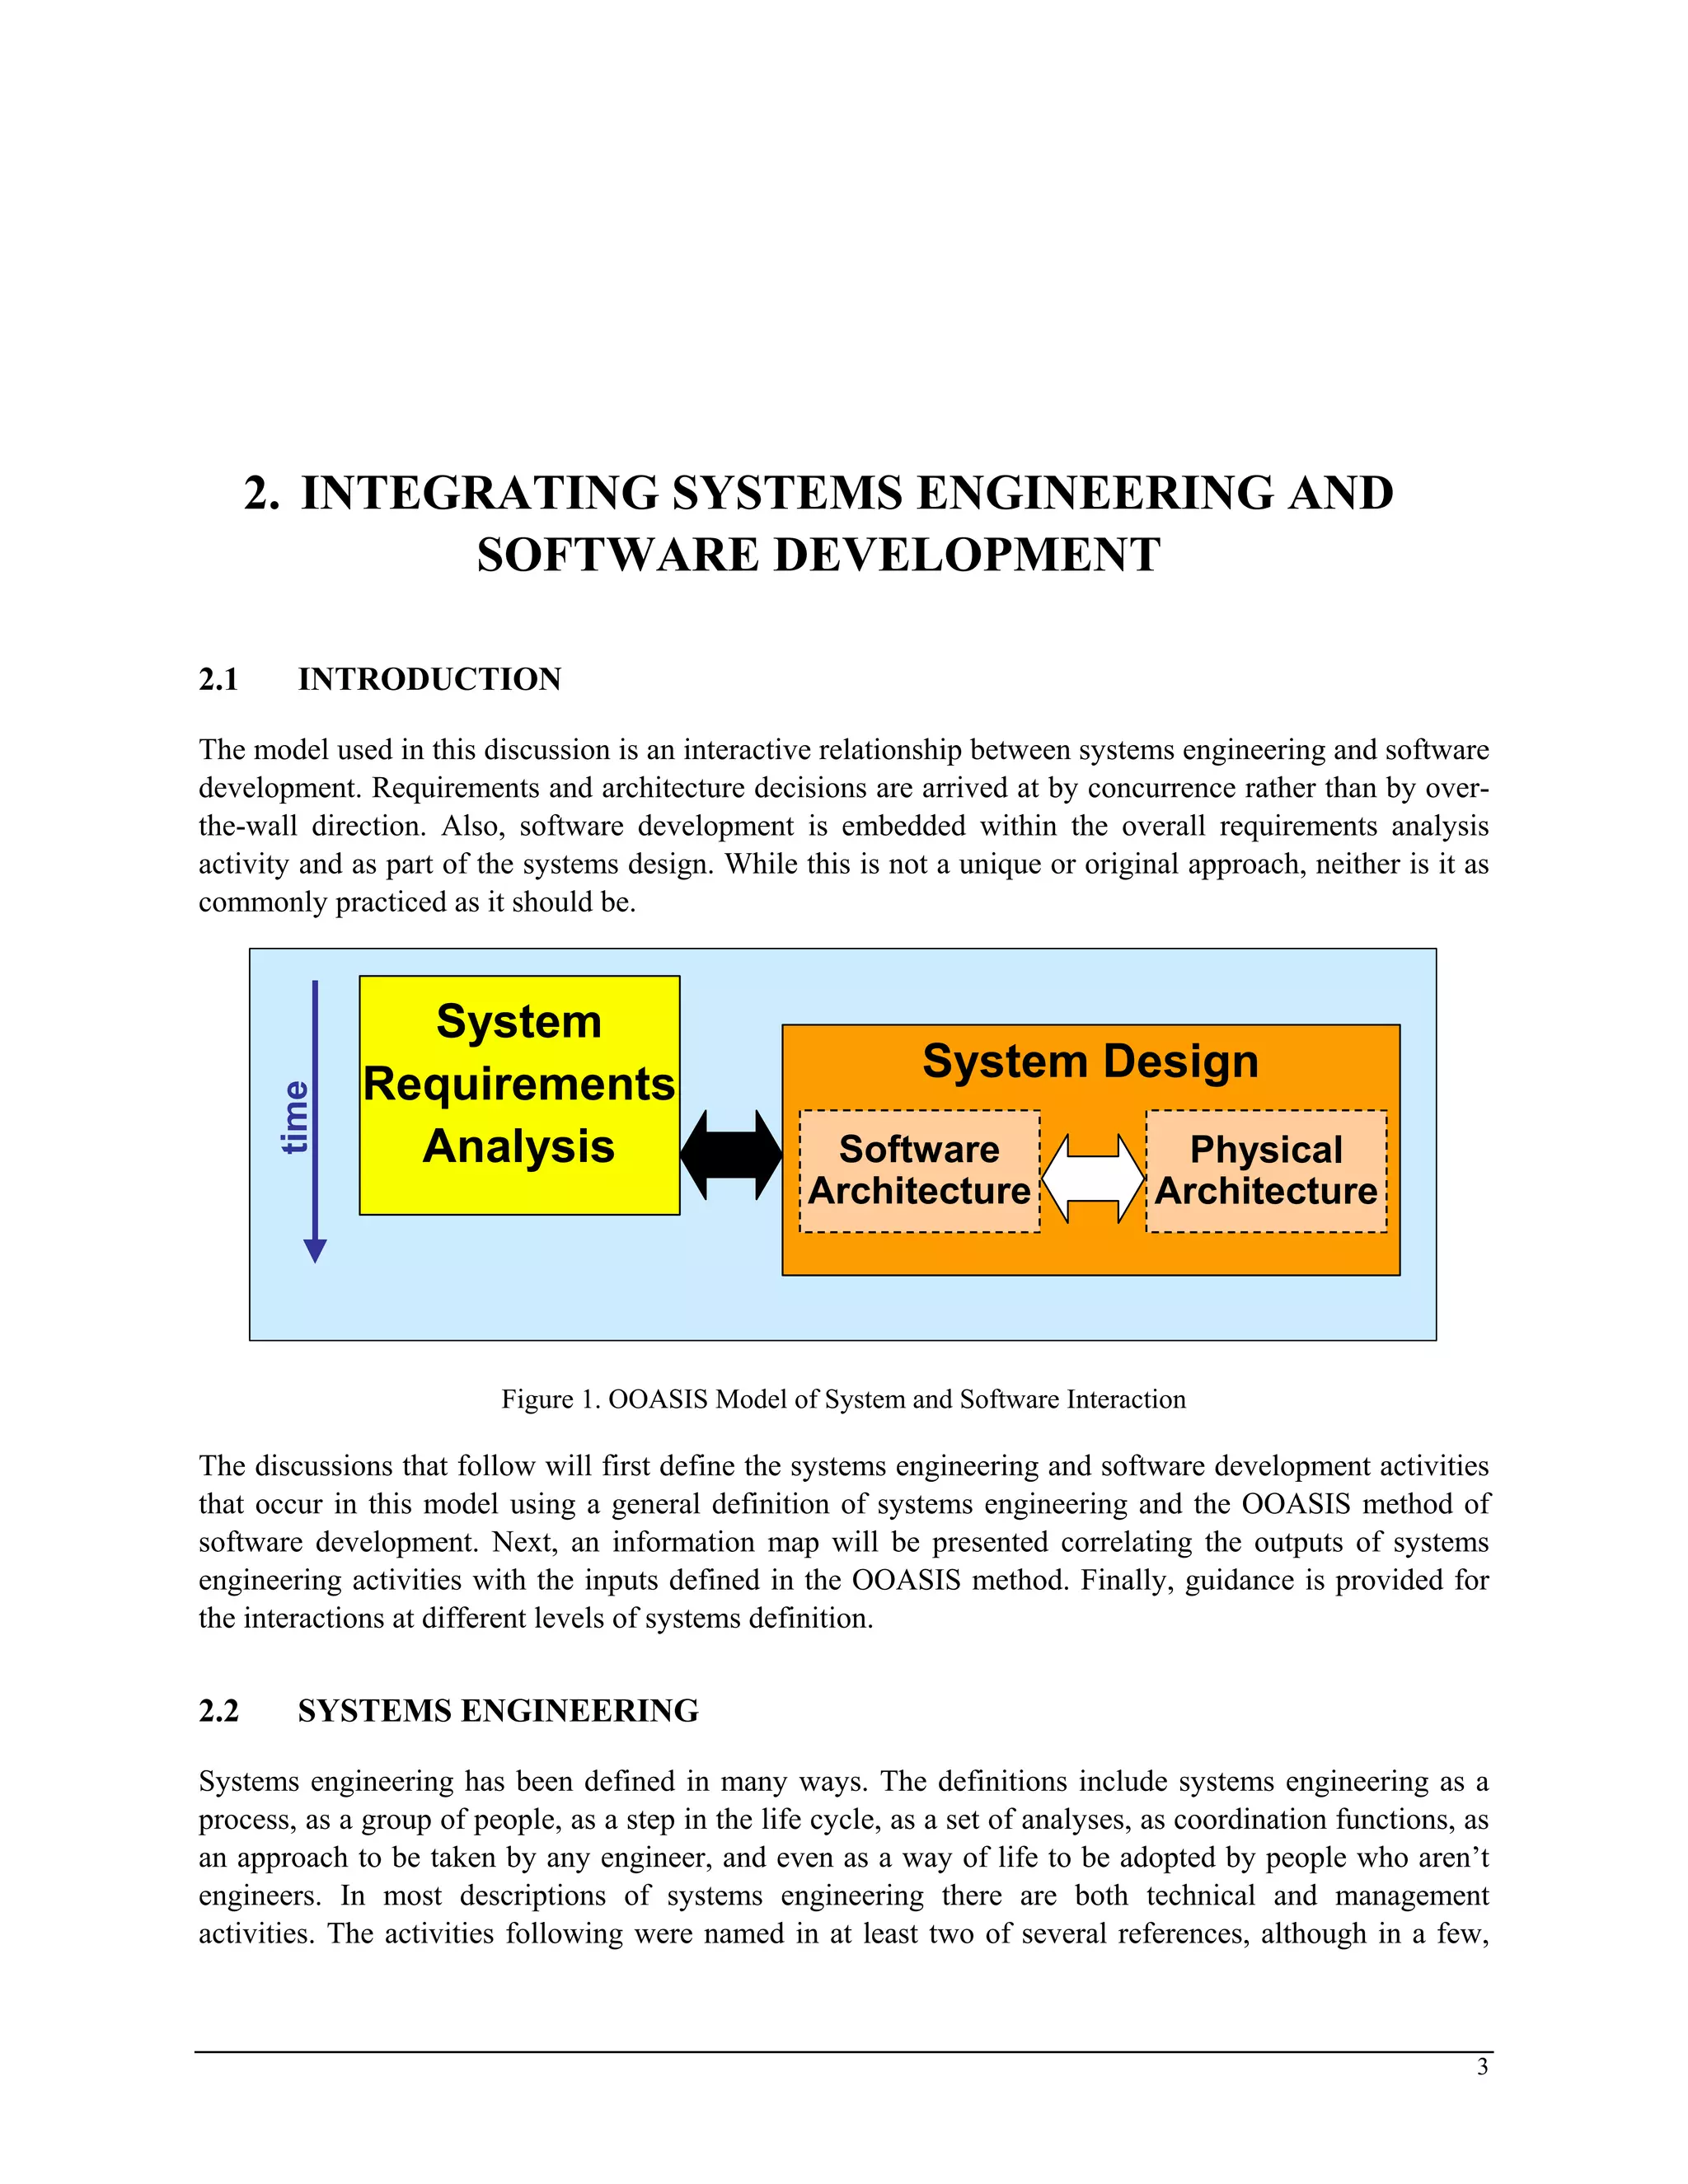
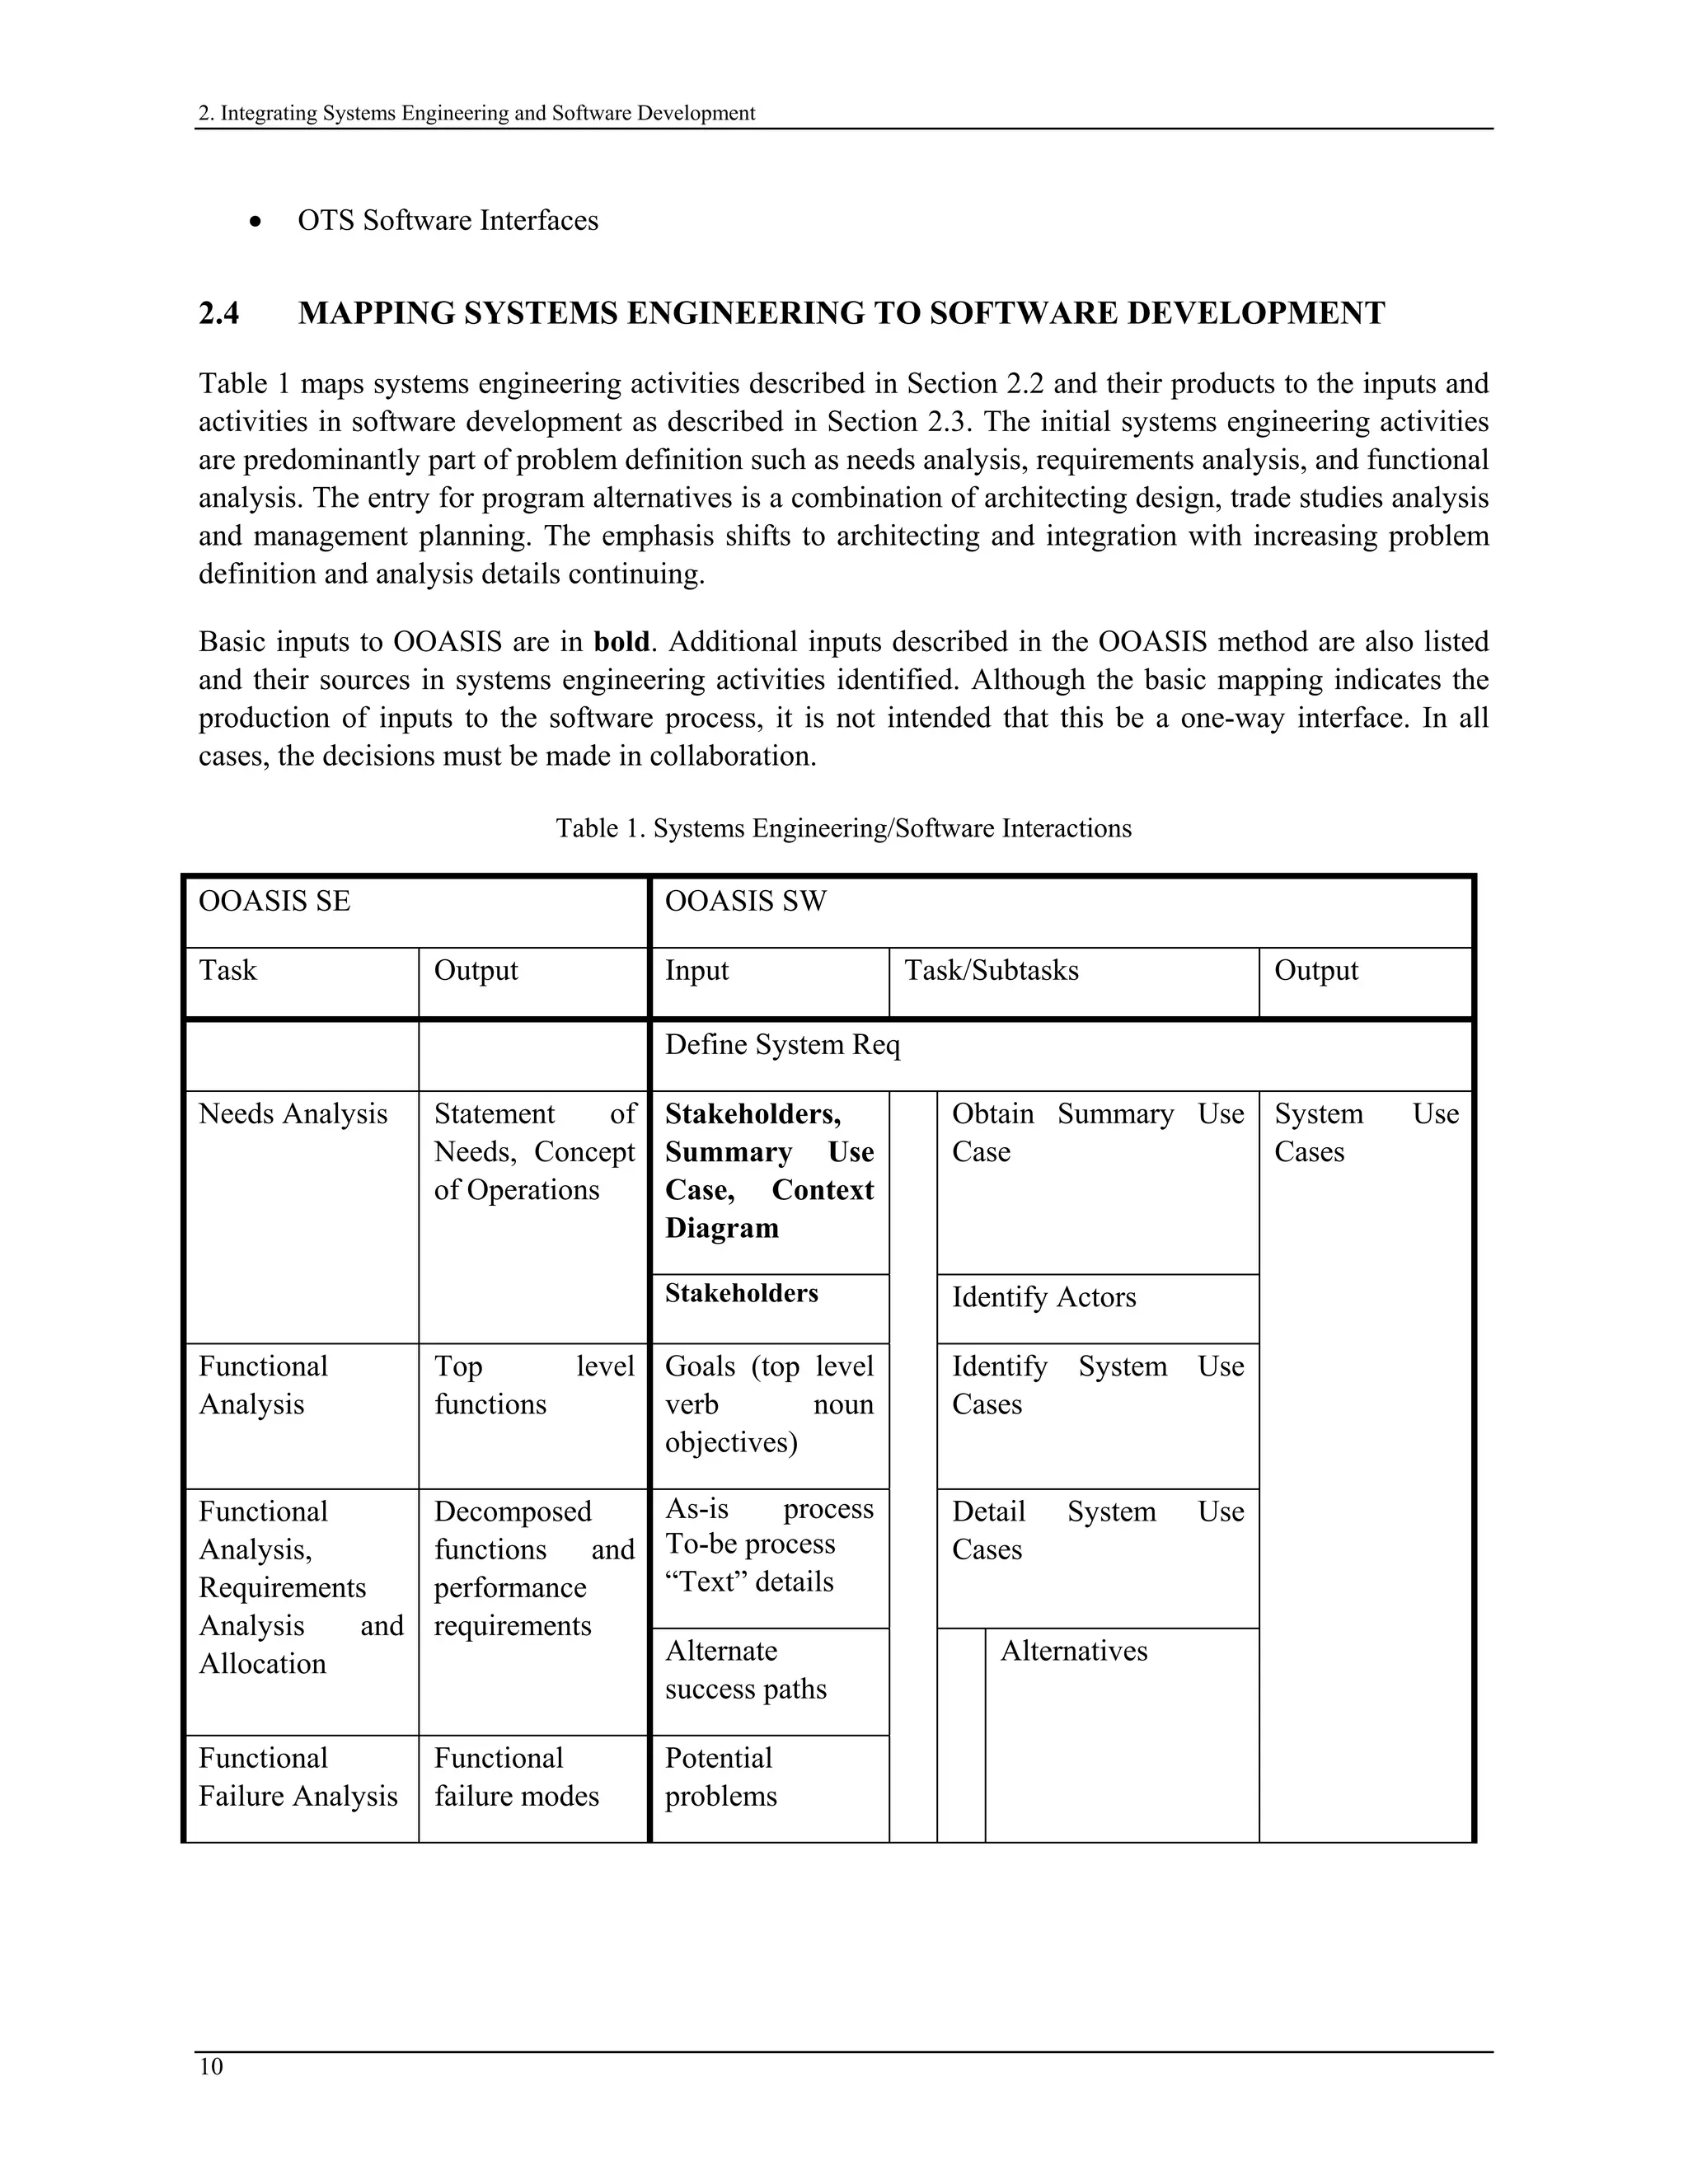
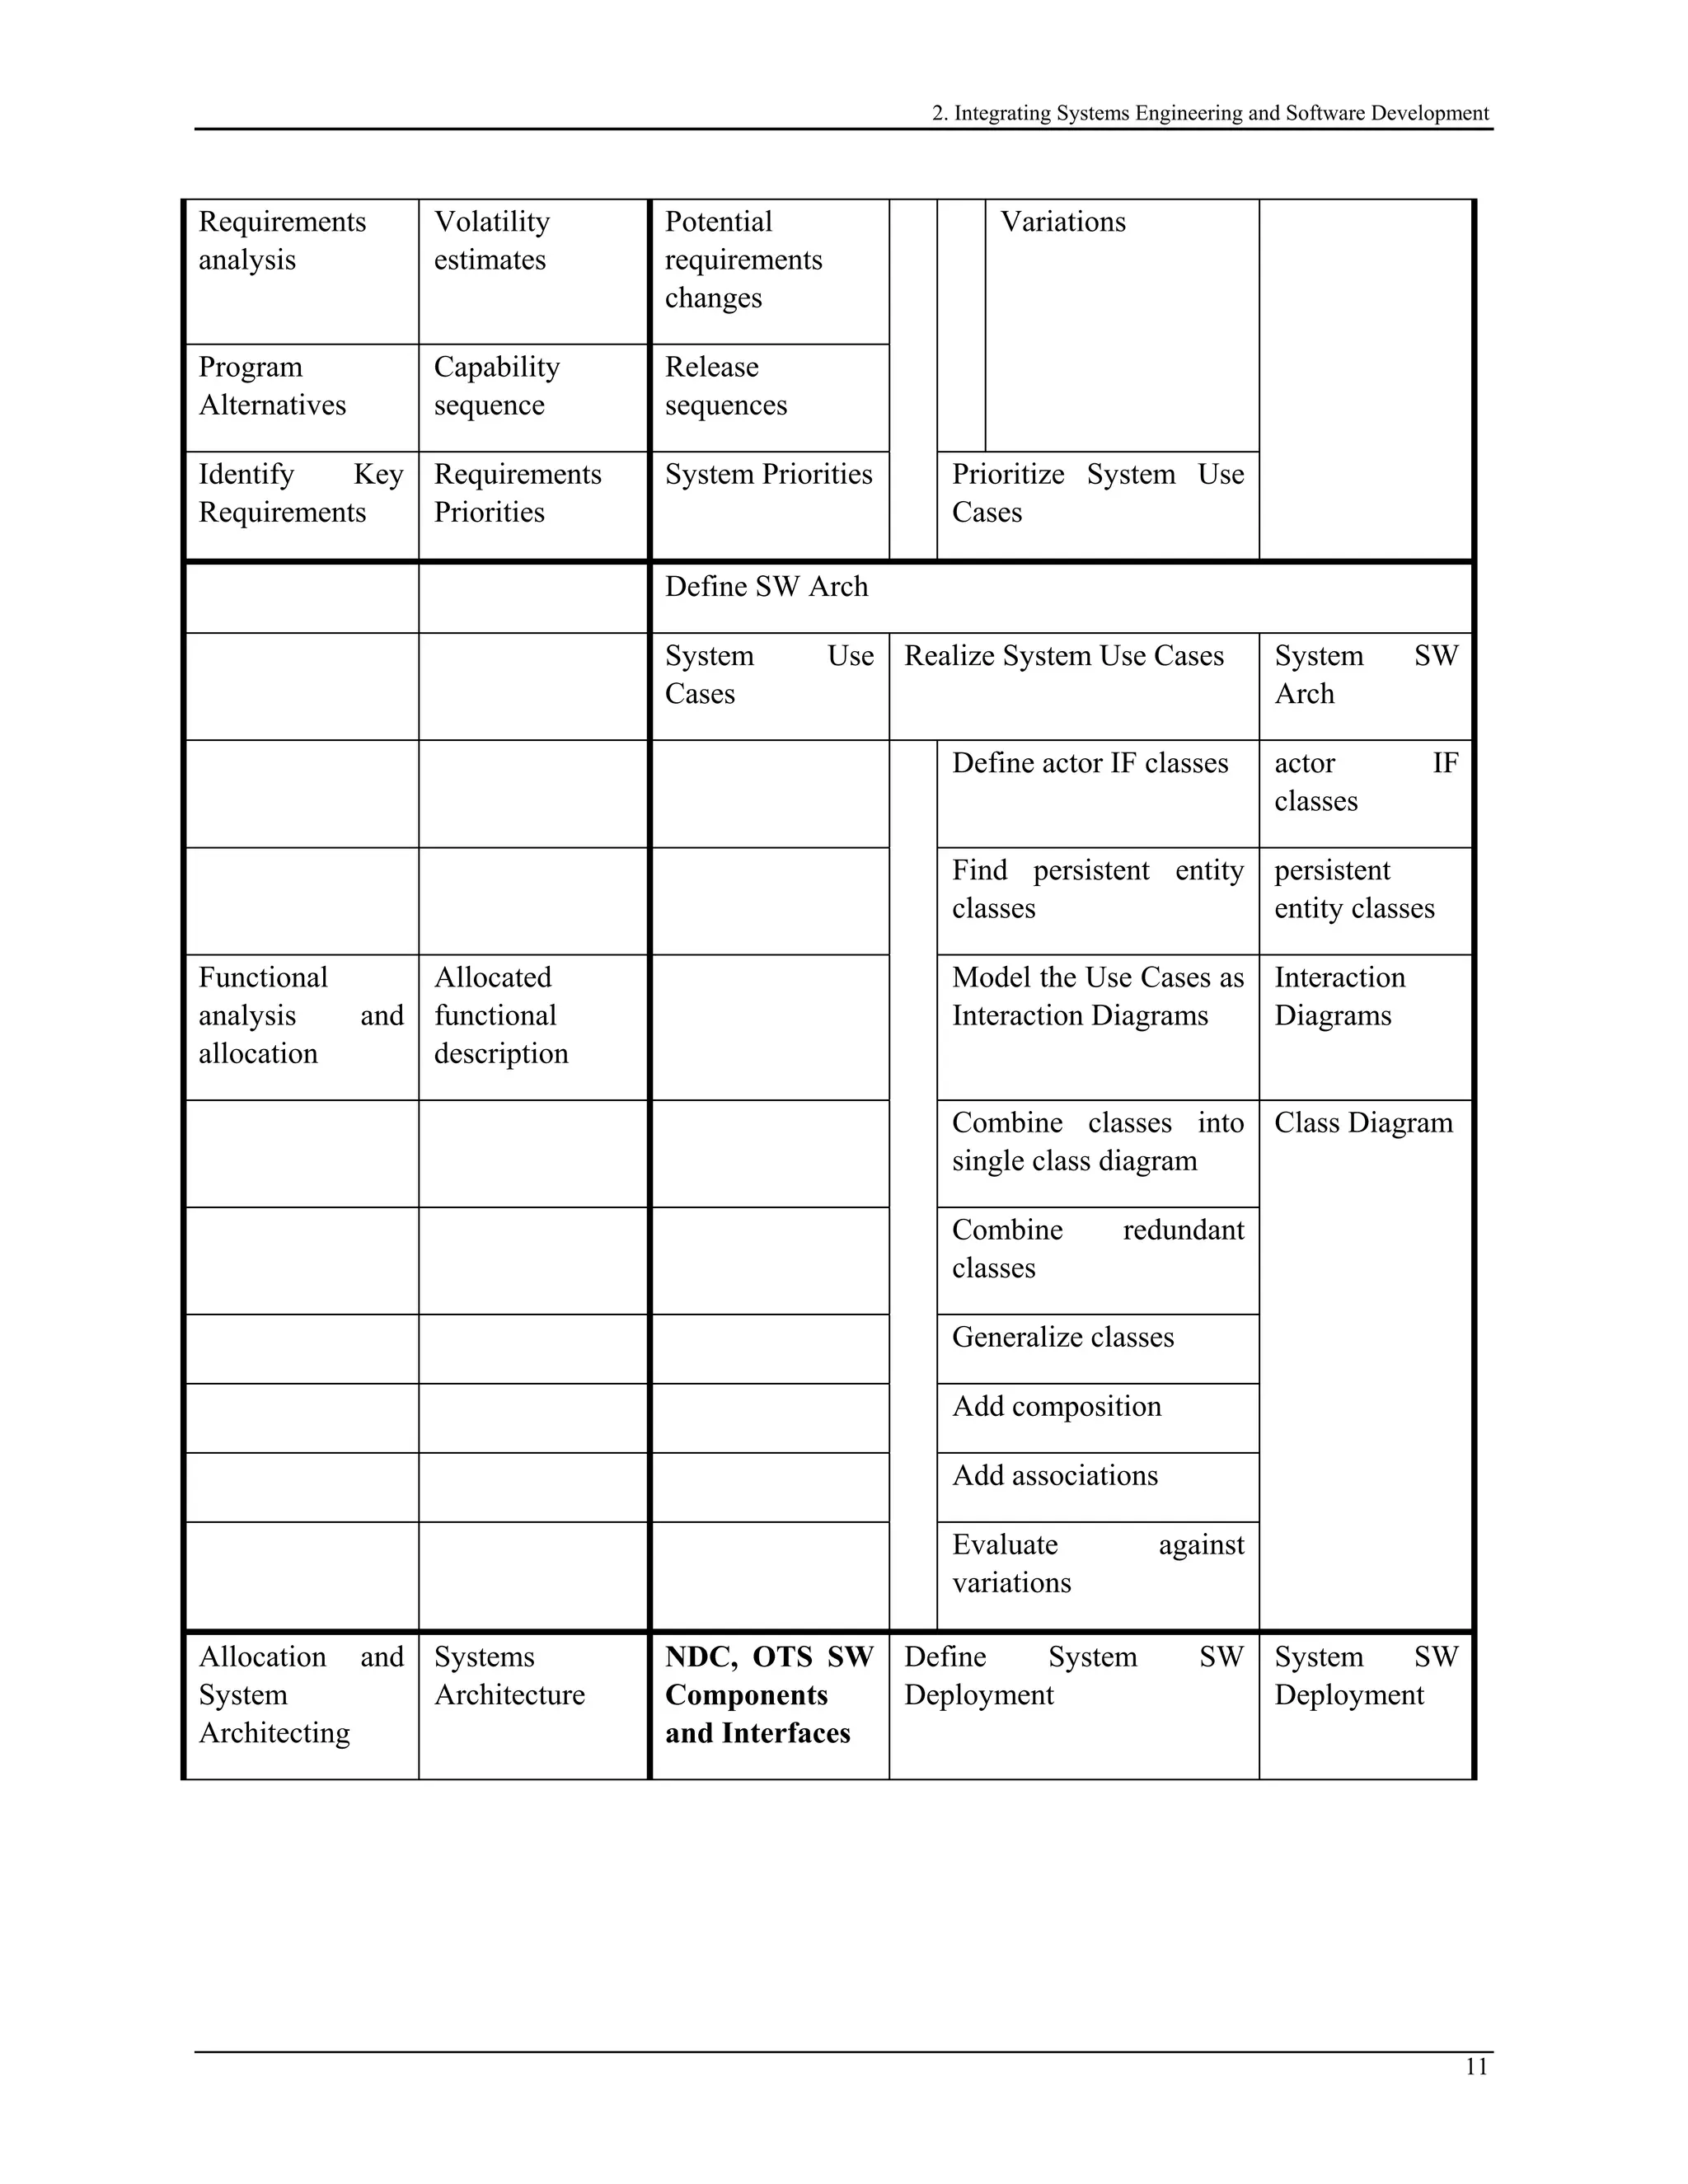
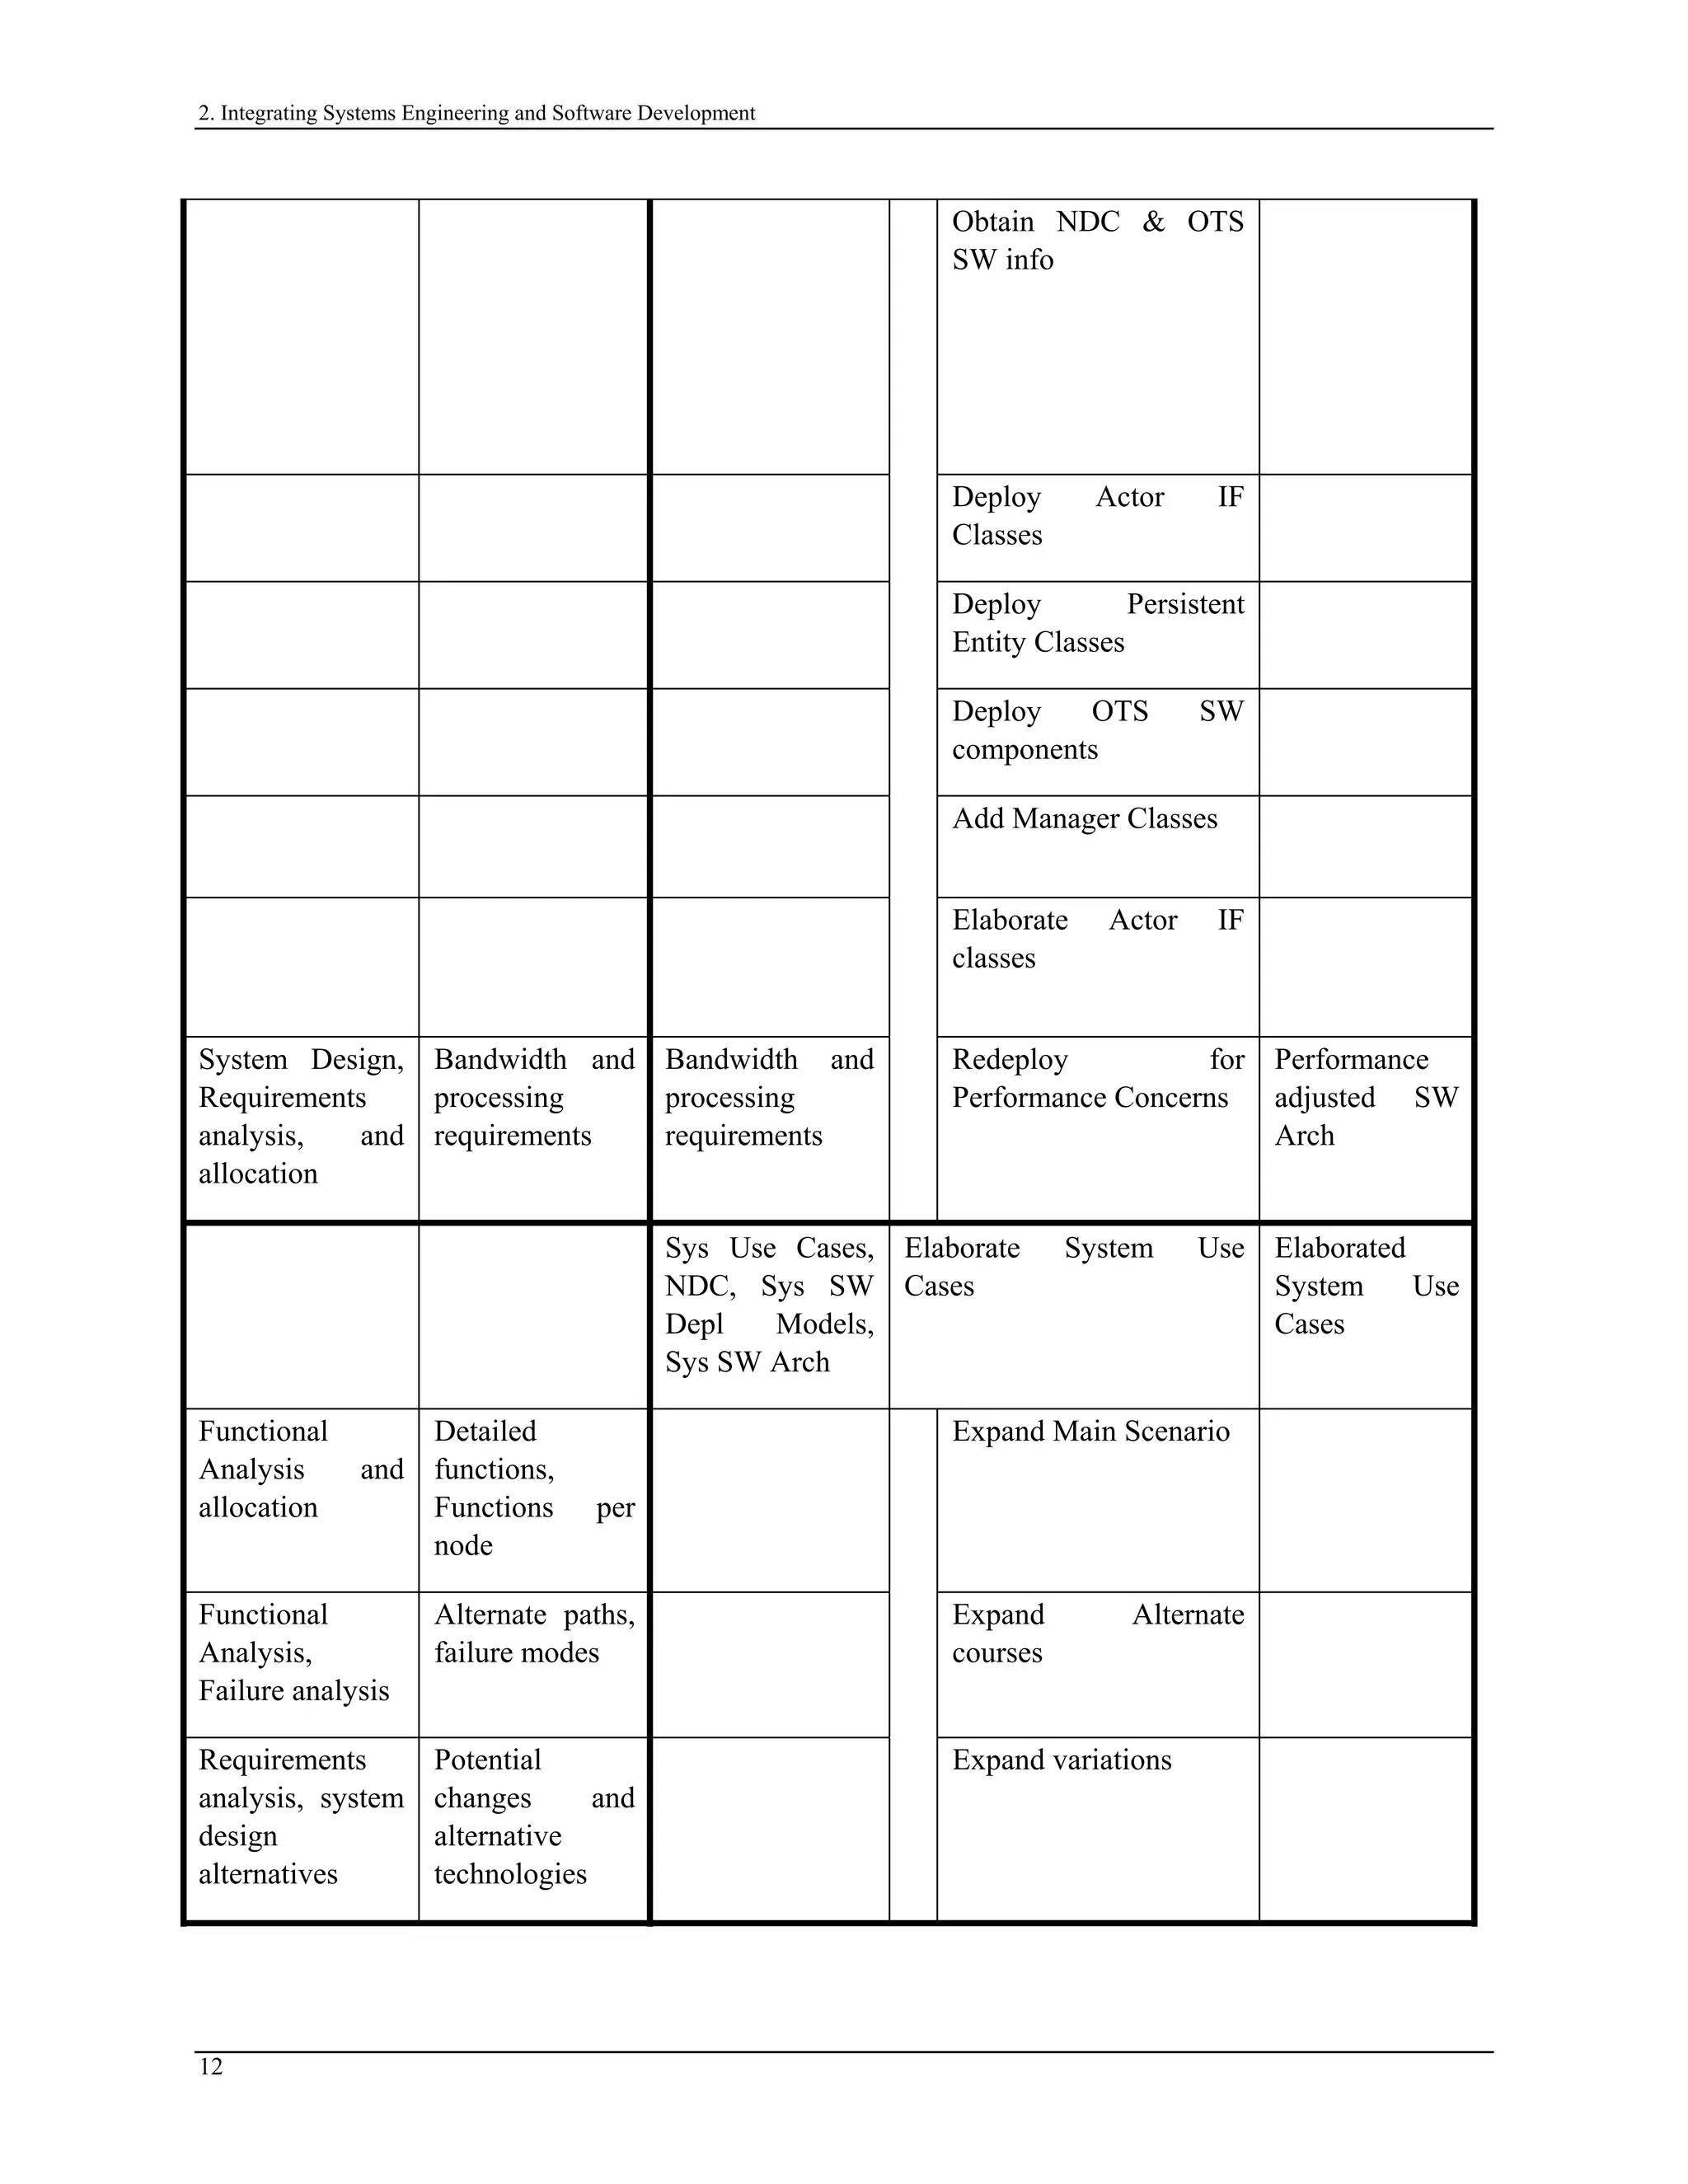
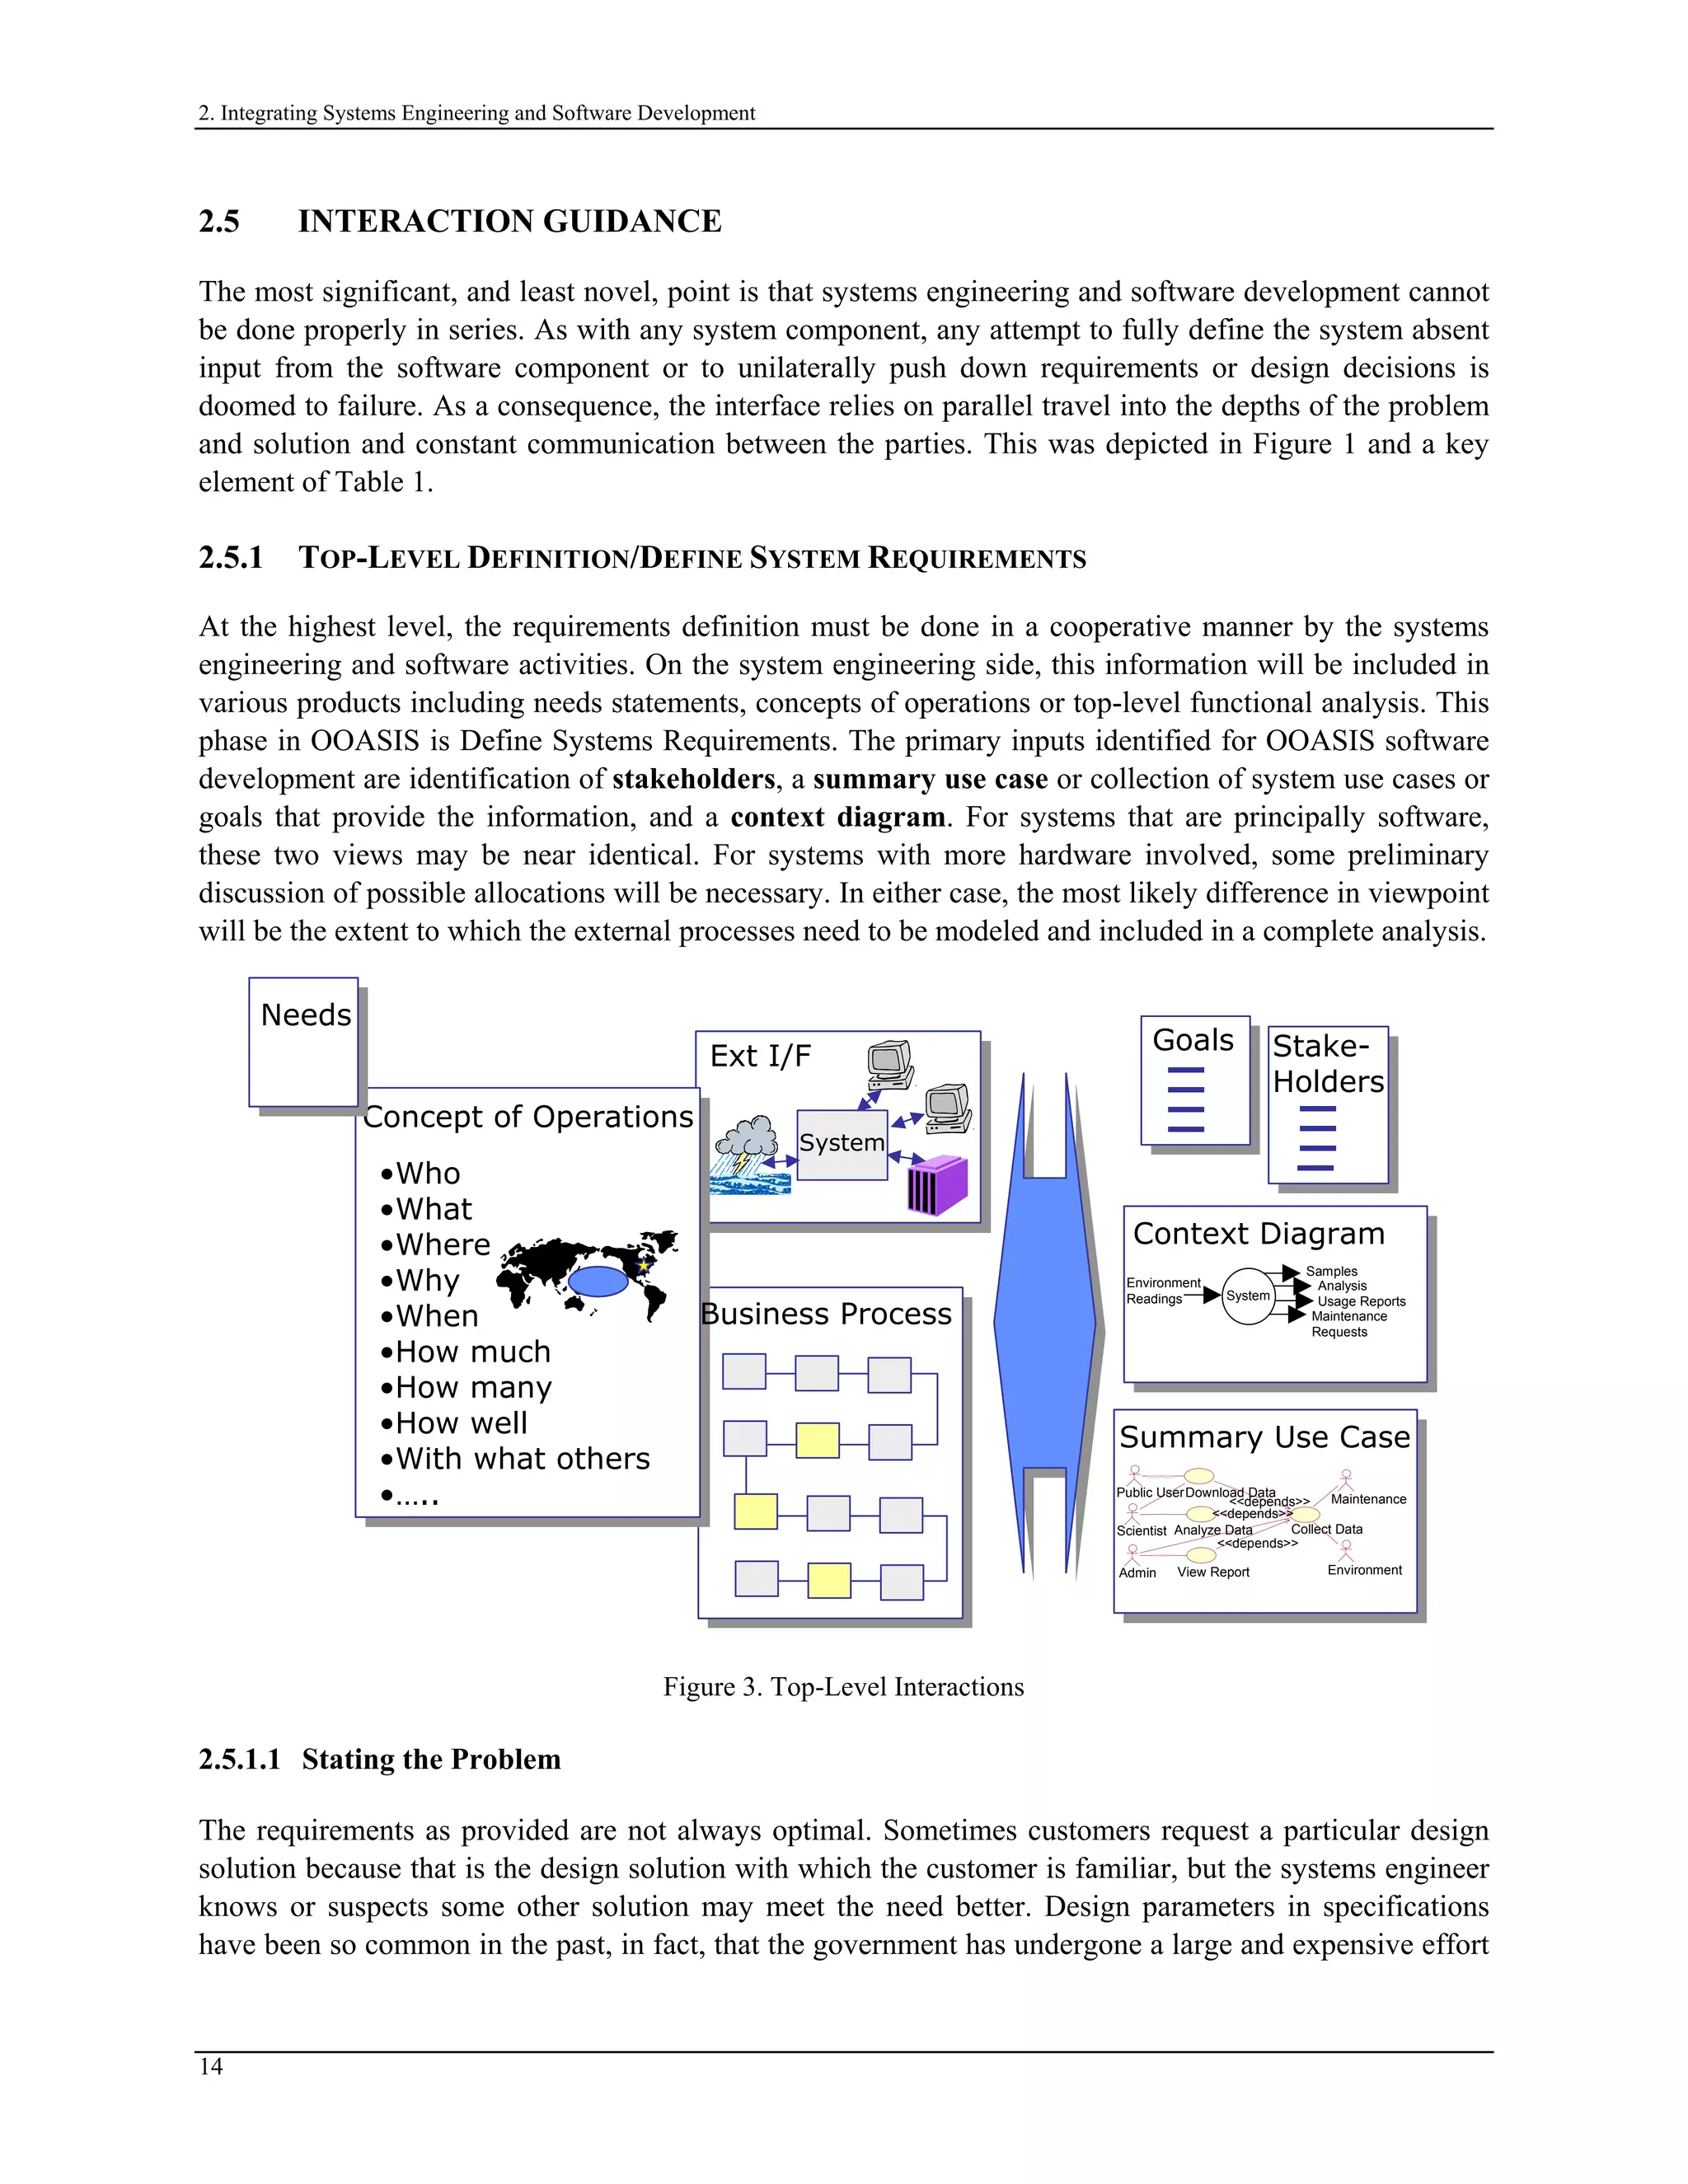
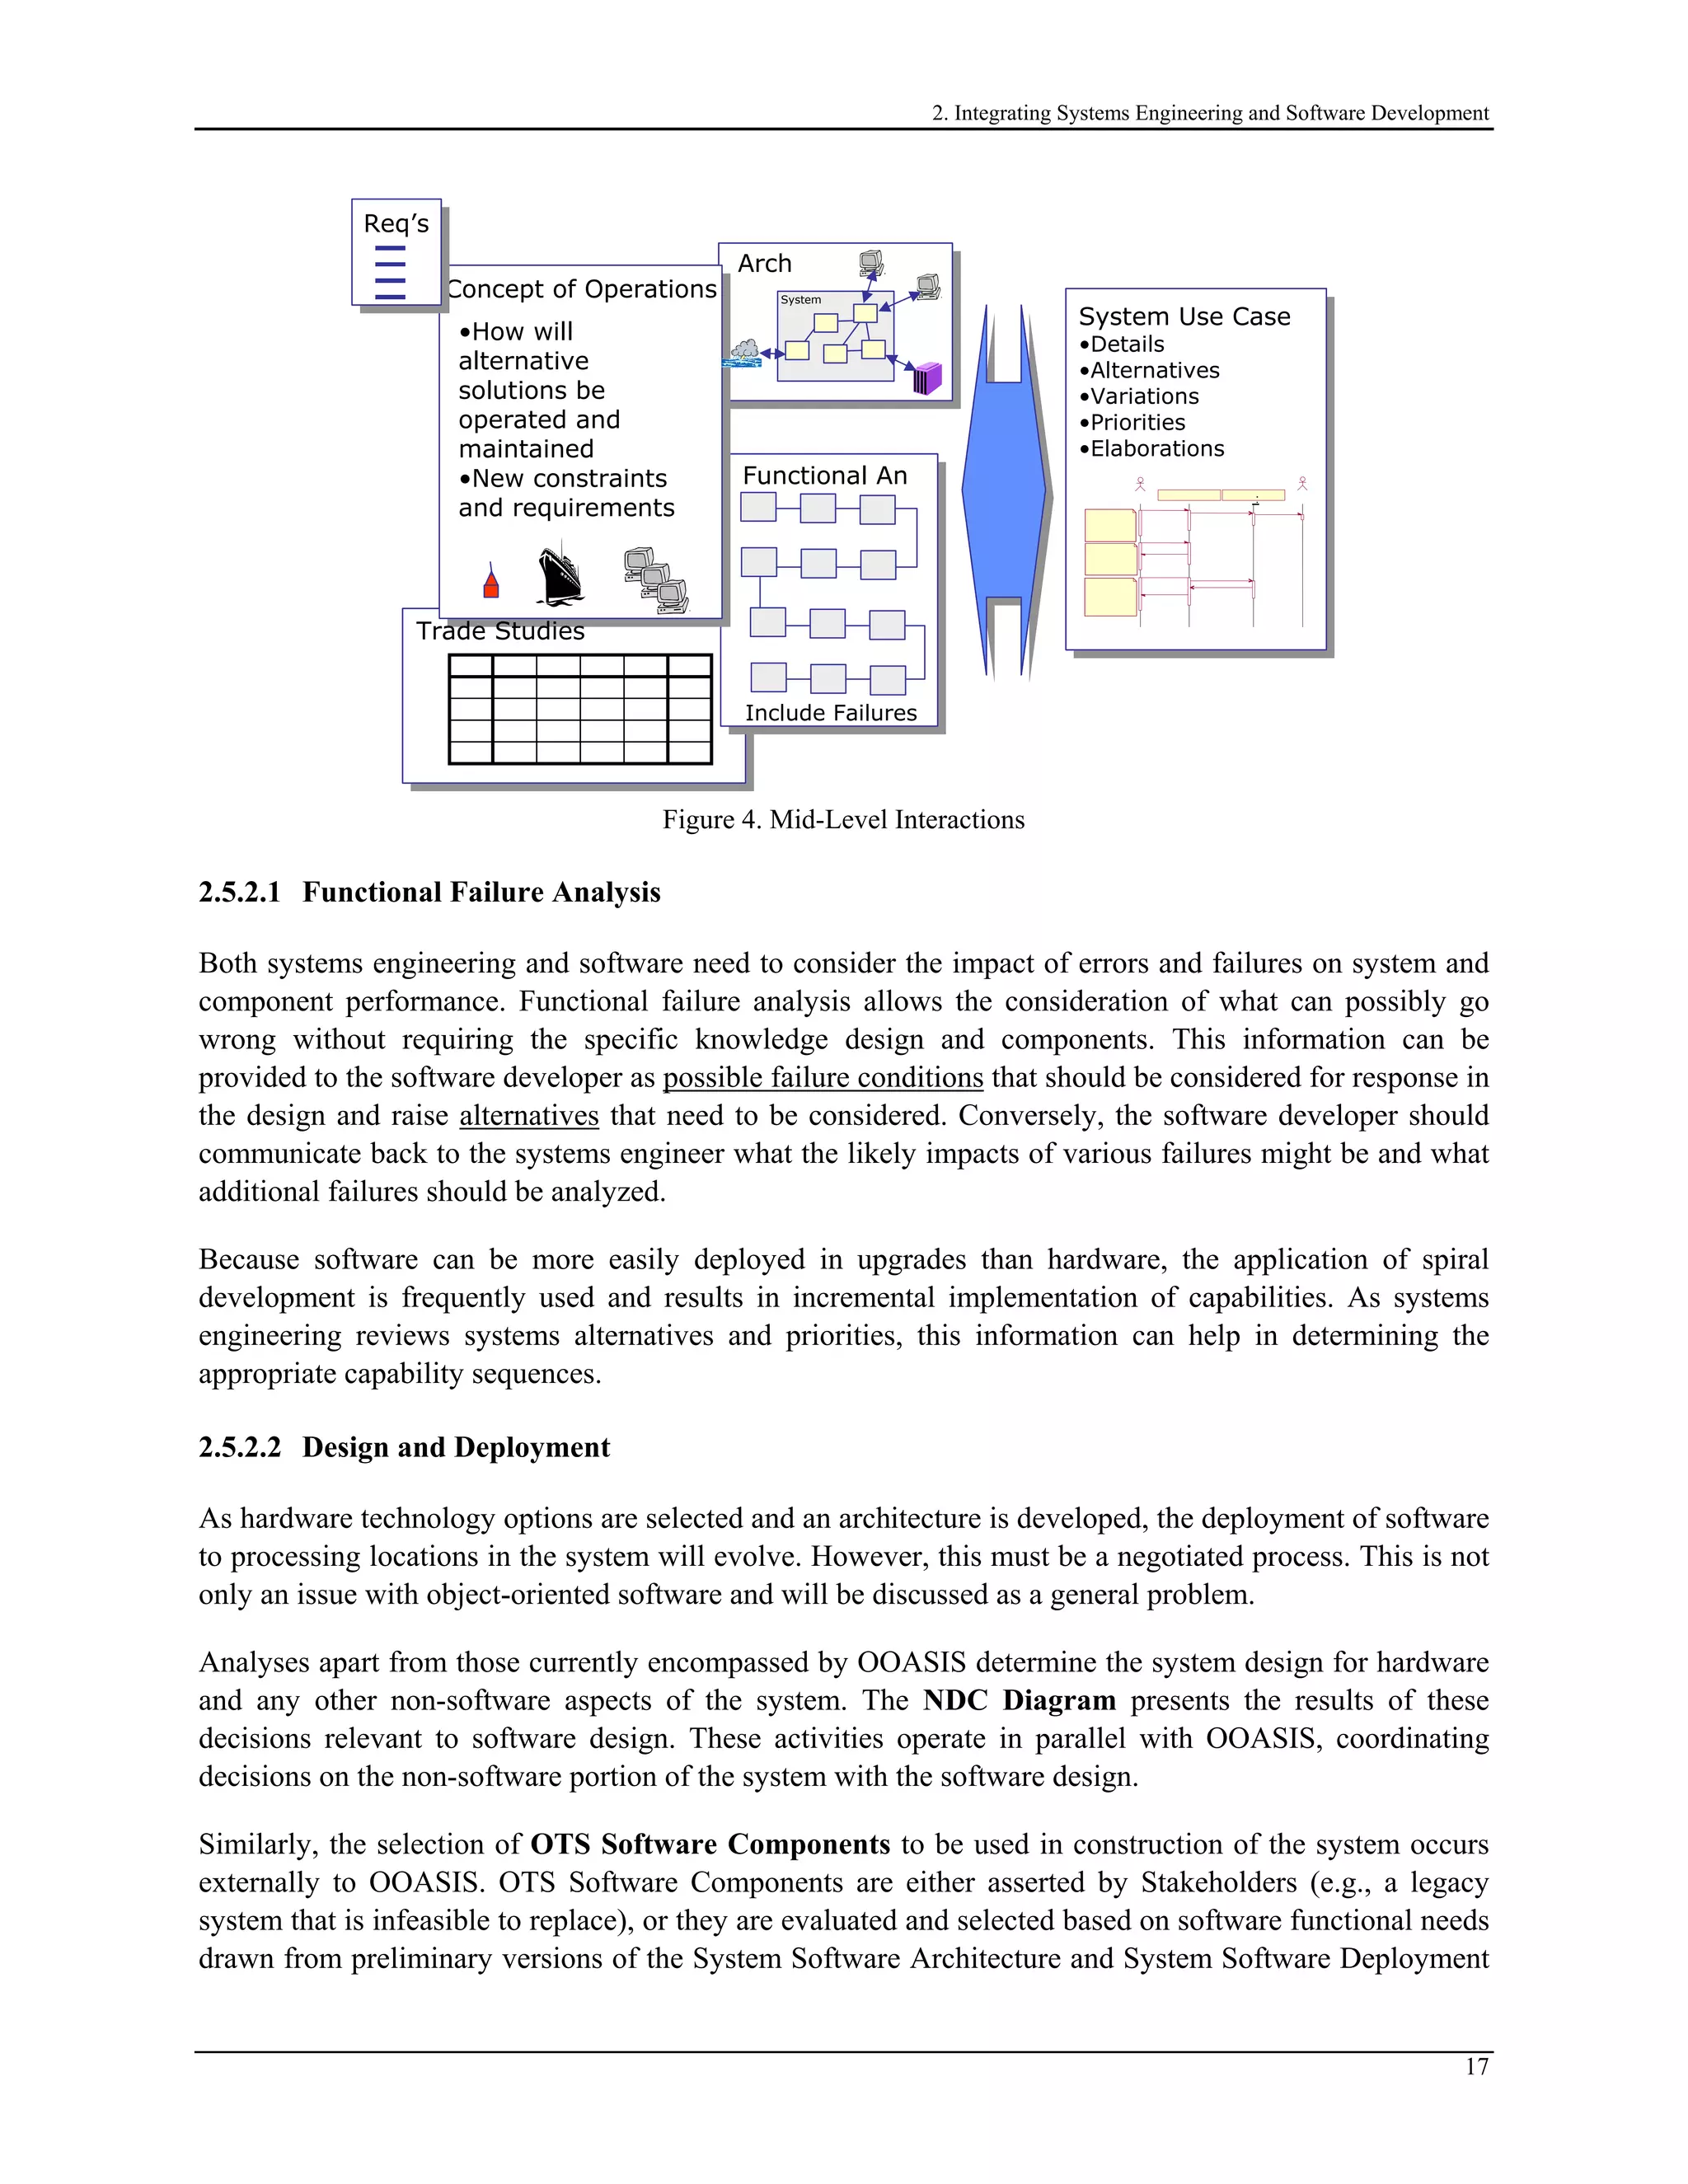
This document discusses integrating systems engineering and software development based on an object-oriented approach. It presents a model showing how systems engineering defines requirements that are input to software development. The document maps typical systems engineering activities to software development activities and provides guidance on interactions between the two disciplines at different levels. It also applies IDEF0 and SADT methods to develop information requirements for an object-oriented analysis and design approach called OOASIS.


![A. Relating IDEF Methods to OOASIS Information Needs
The basis of this work is the Buoy System case study presented by the OOASIS course and website as the
vehicle for demonstrating this application. However, to reduce the number of systemic interfaces to a
manageable handful, we have recast the characters of this case study so that the problem is not deeply
embedded in a context of existing organizations and systems. We have invented the island nation of Santa
Narida to be the customer for our buoy system; the backstory about Santa Narida is given in Appendix B.
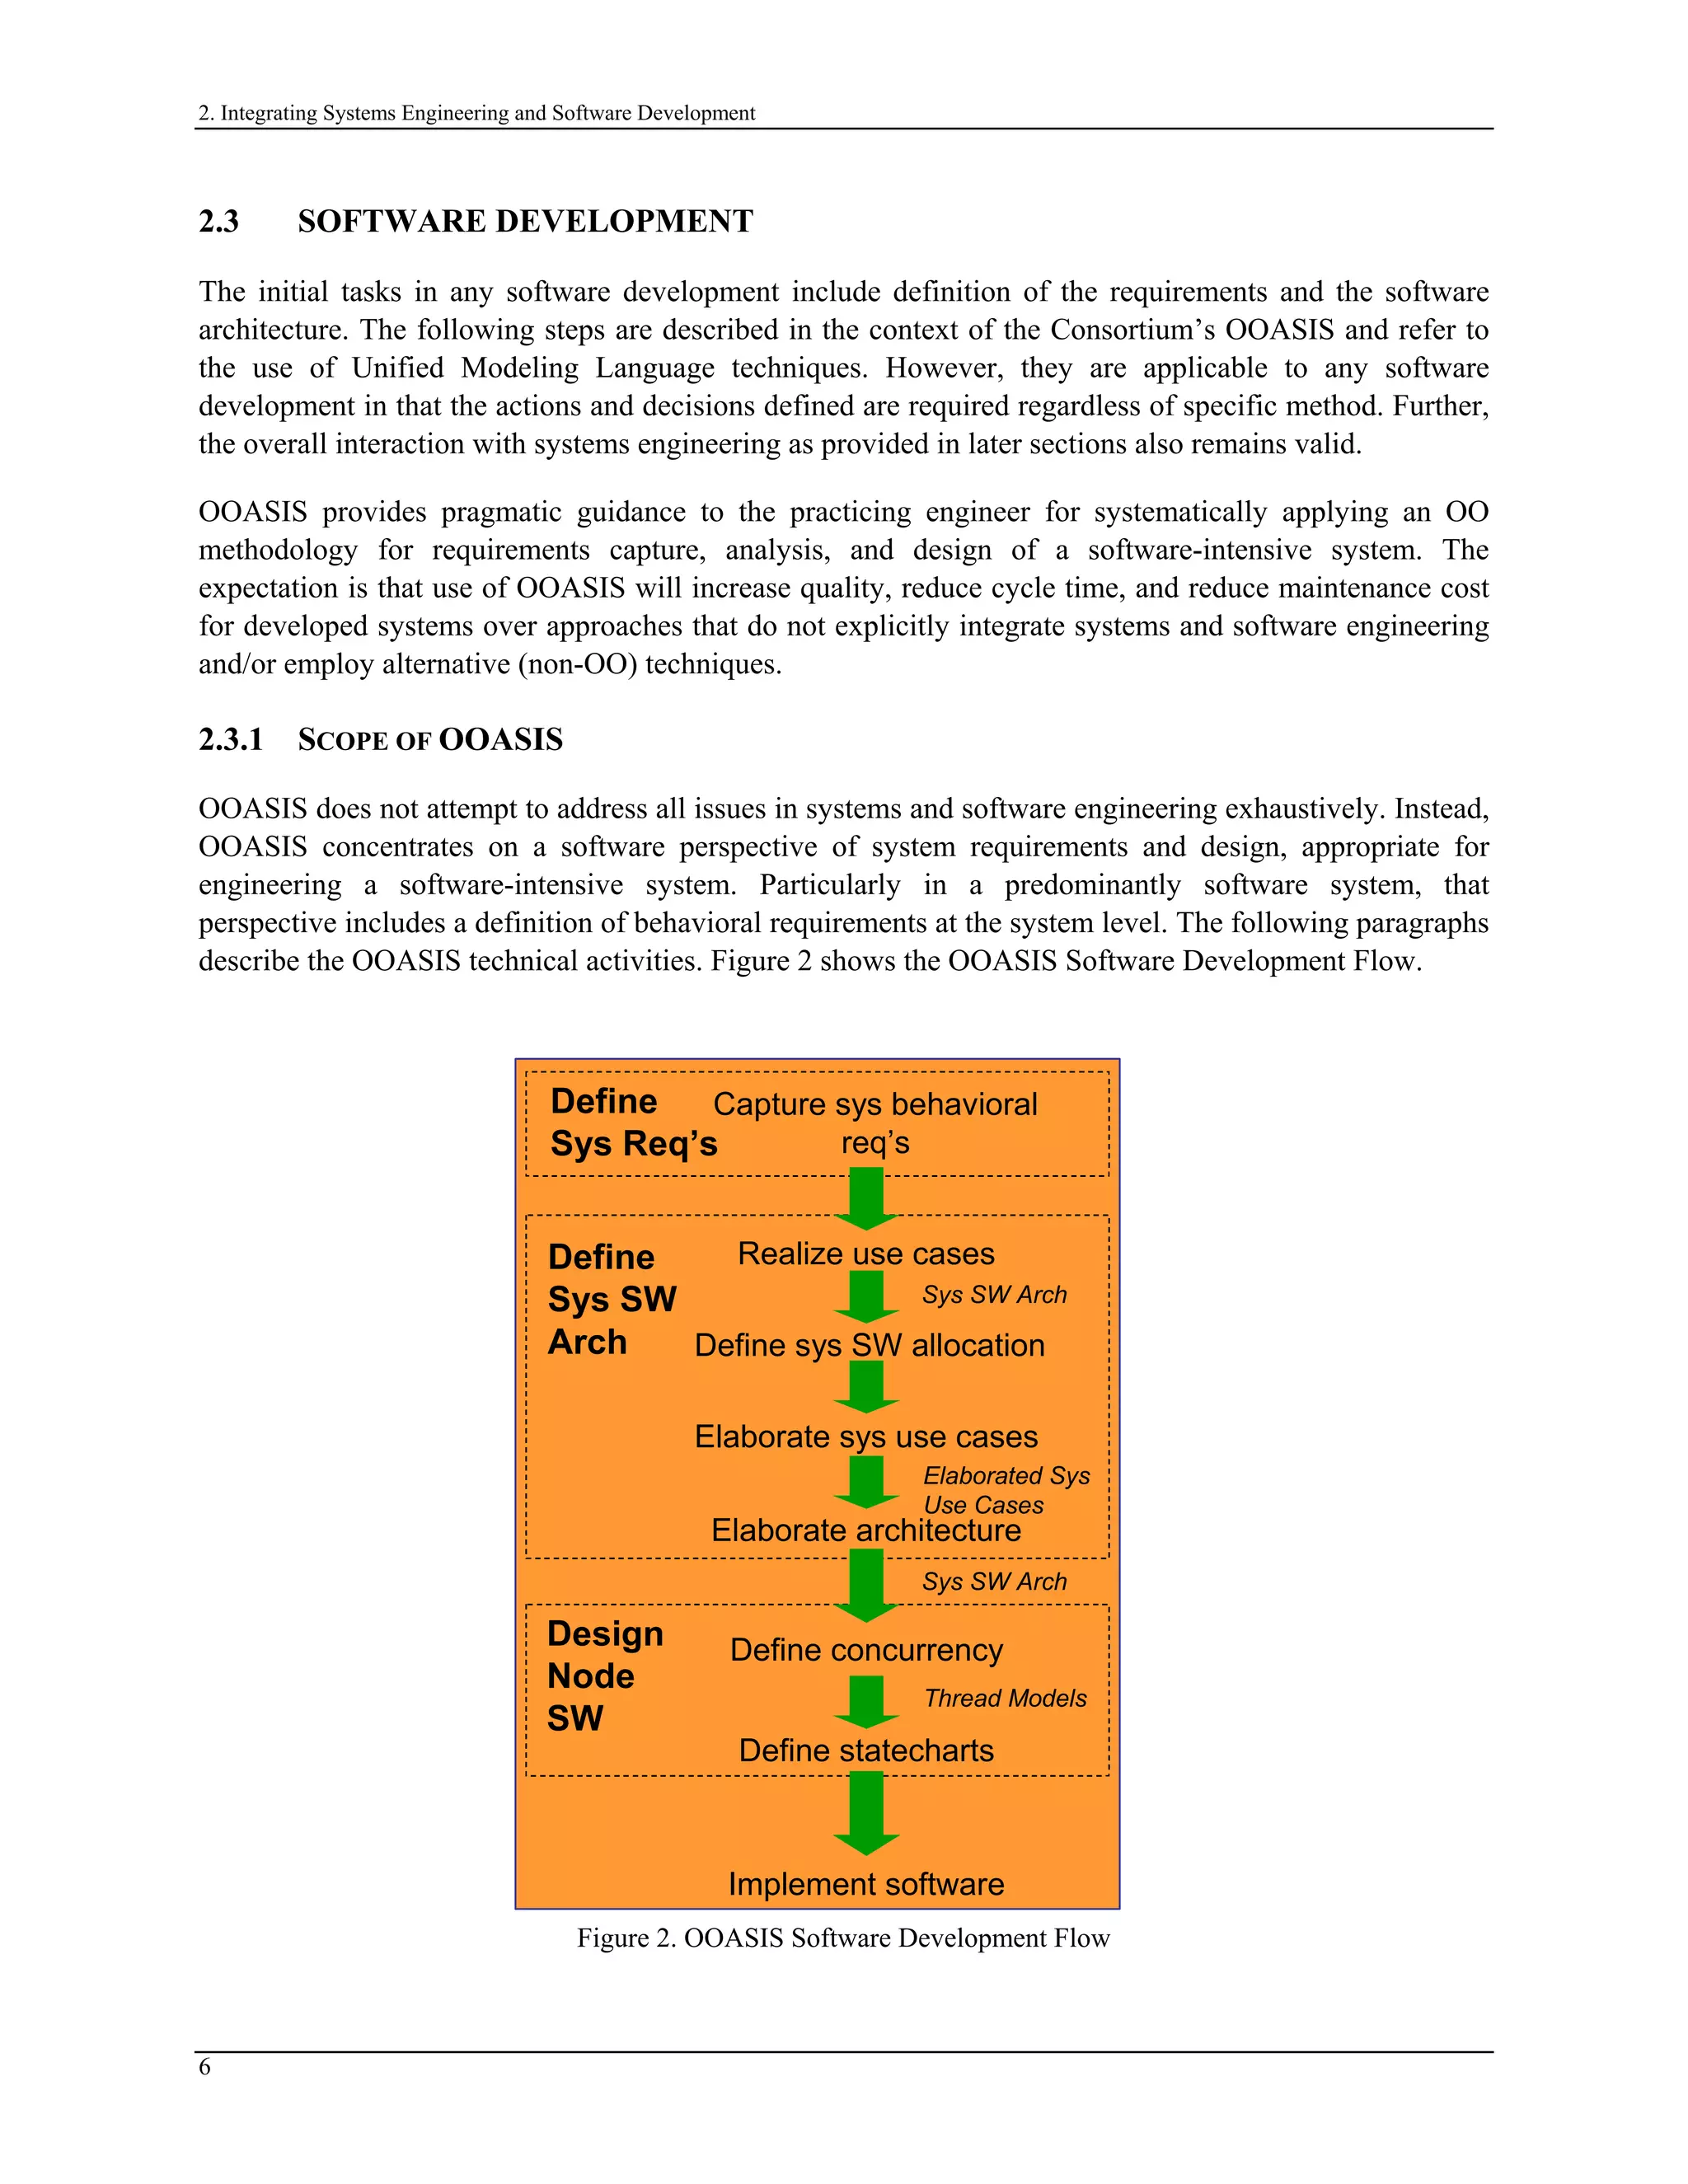
A.1.1 OVERVIEW OF METHOD
To develop the information needed by OOASIS software designers, the systems engineer will build a
family of IDEF0 models whose information elements will be mapped to the input artifacts specified by
OOASIS. Each step in the method builds upon information developed by previous steps.
1. Identify and gather source material preparatory to developing IDEF0 models.
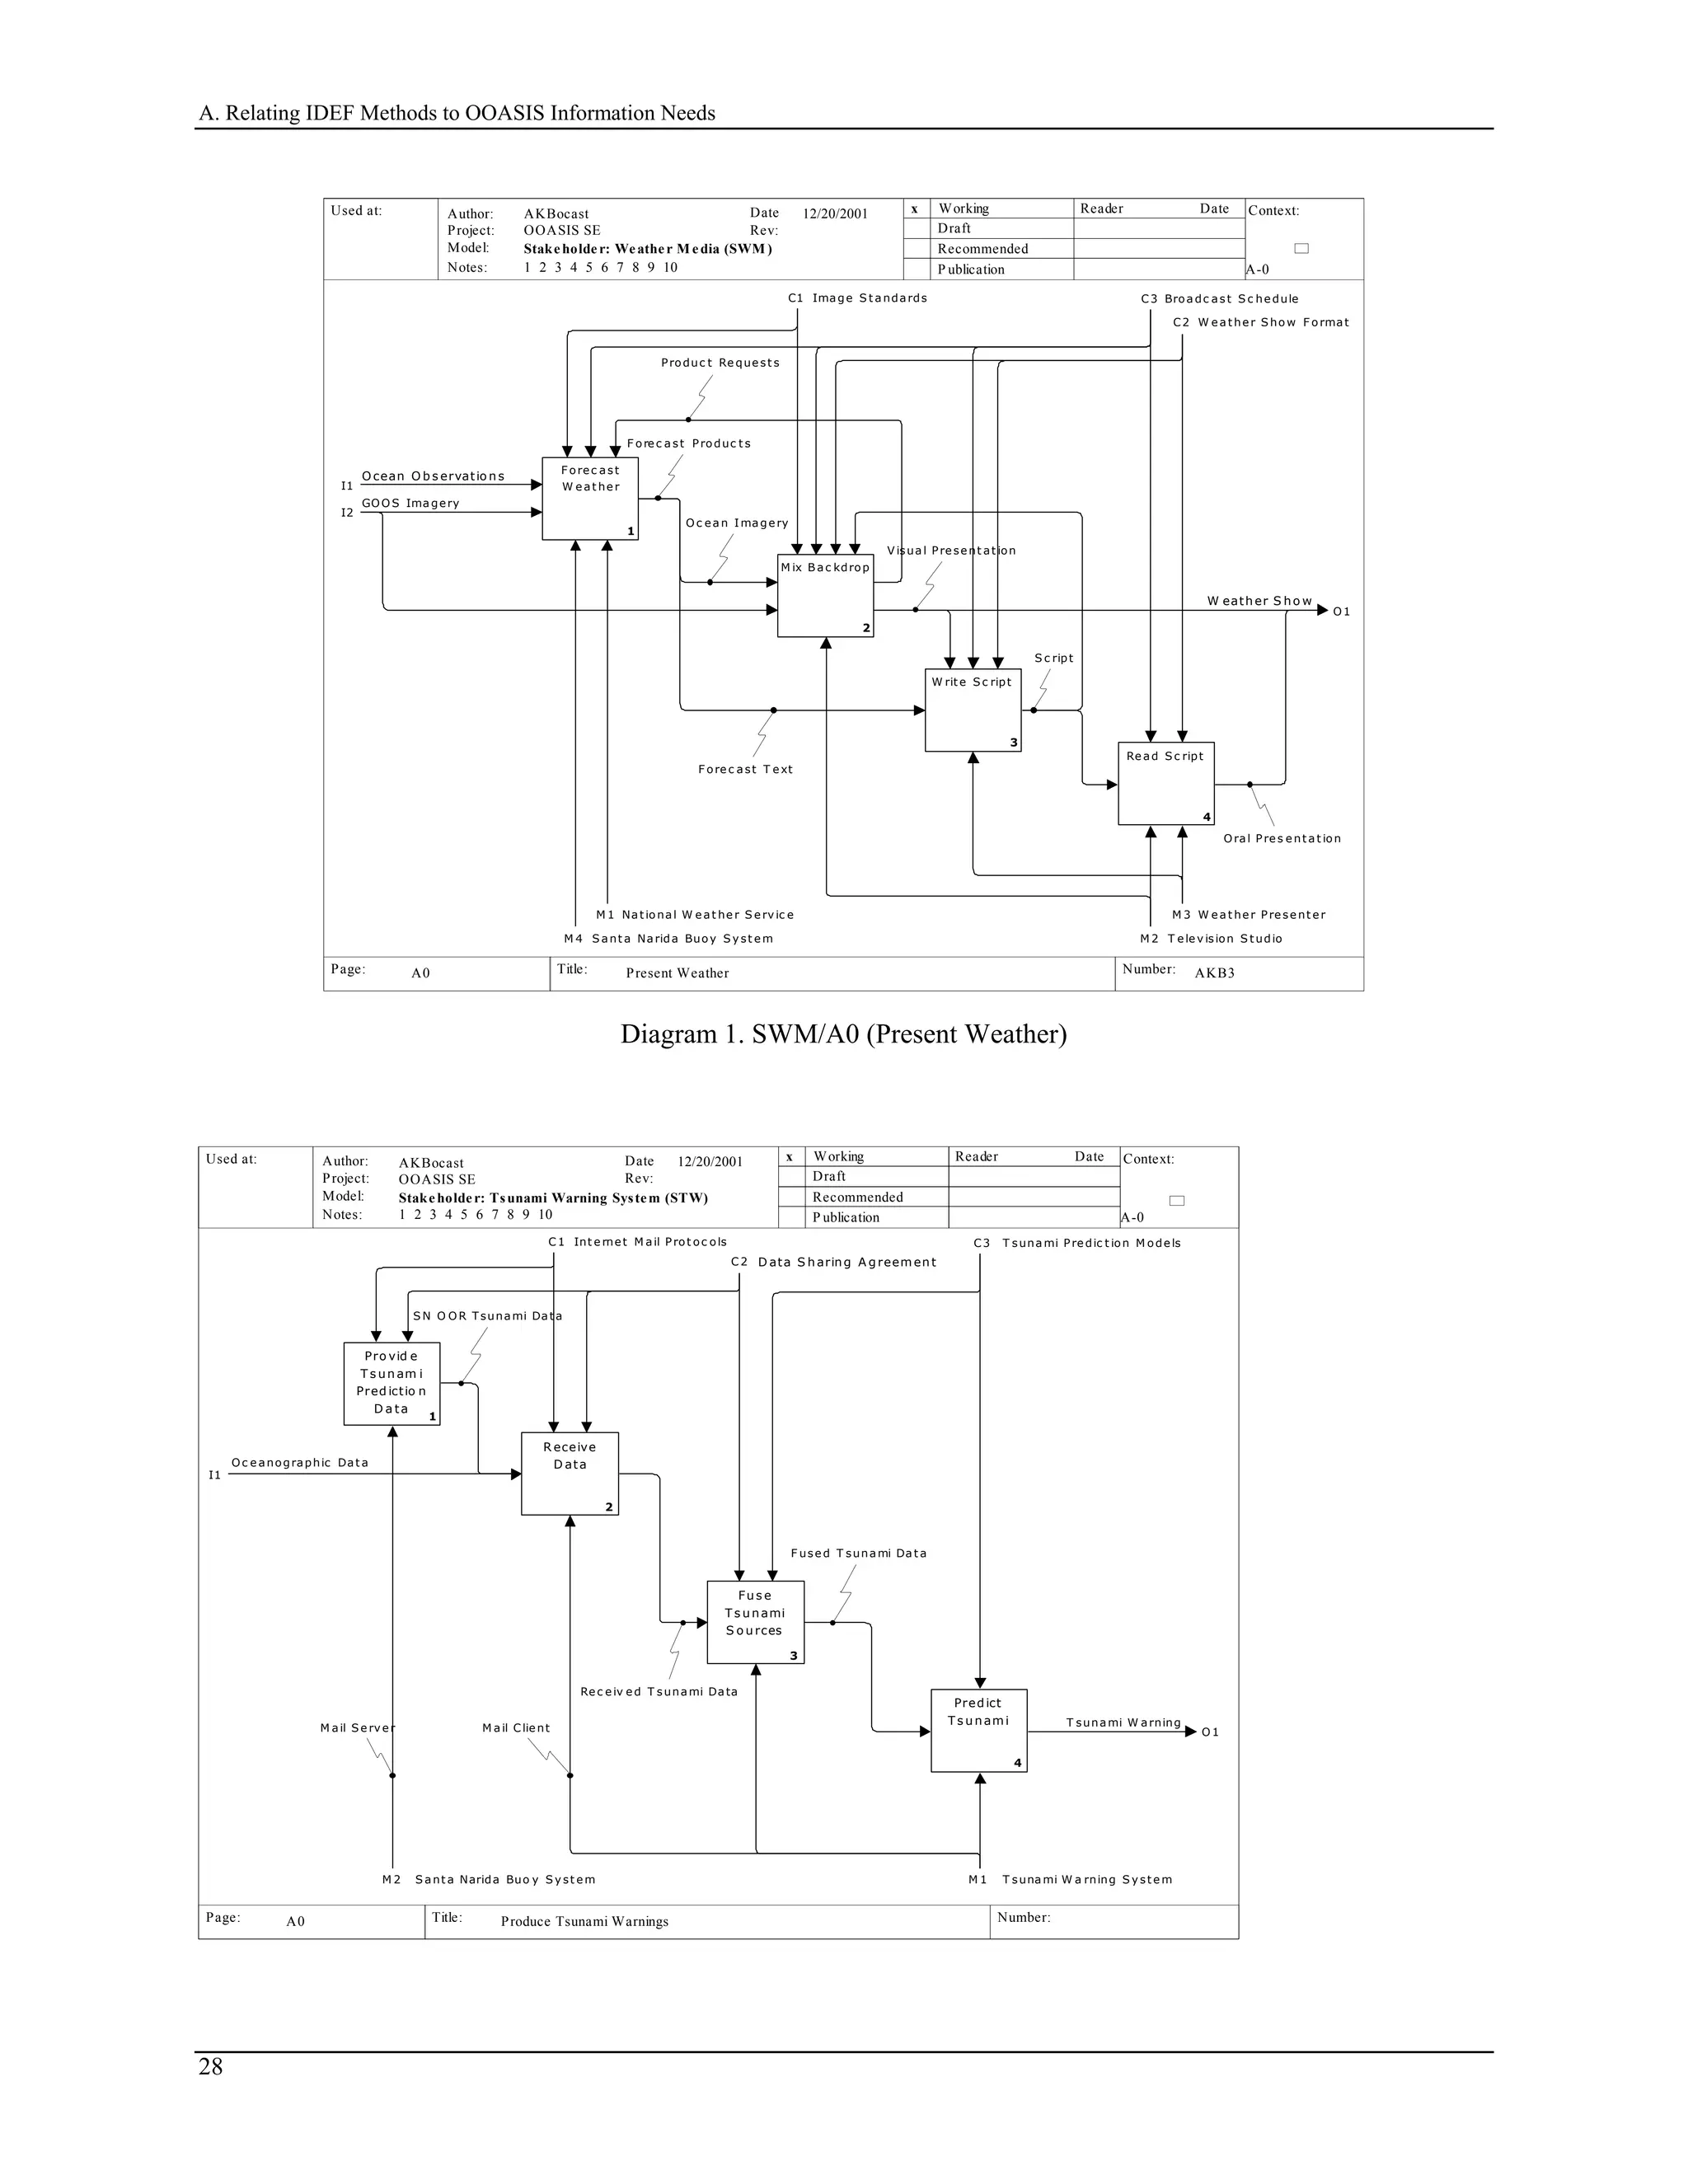
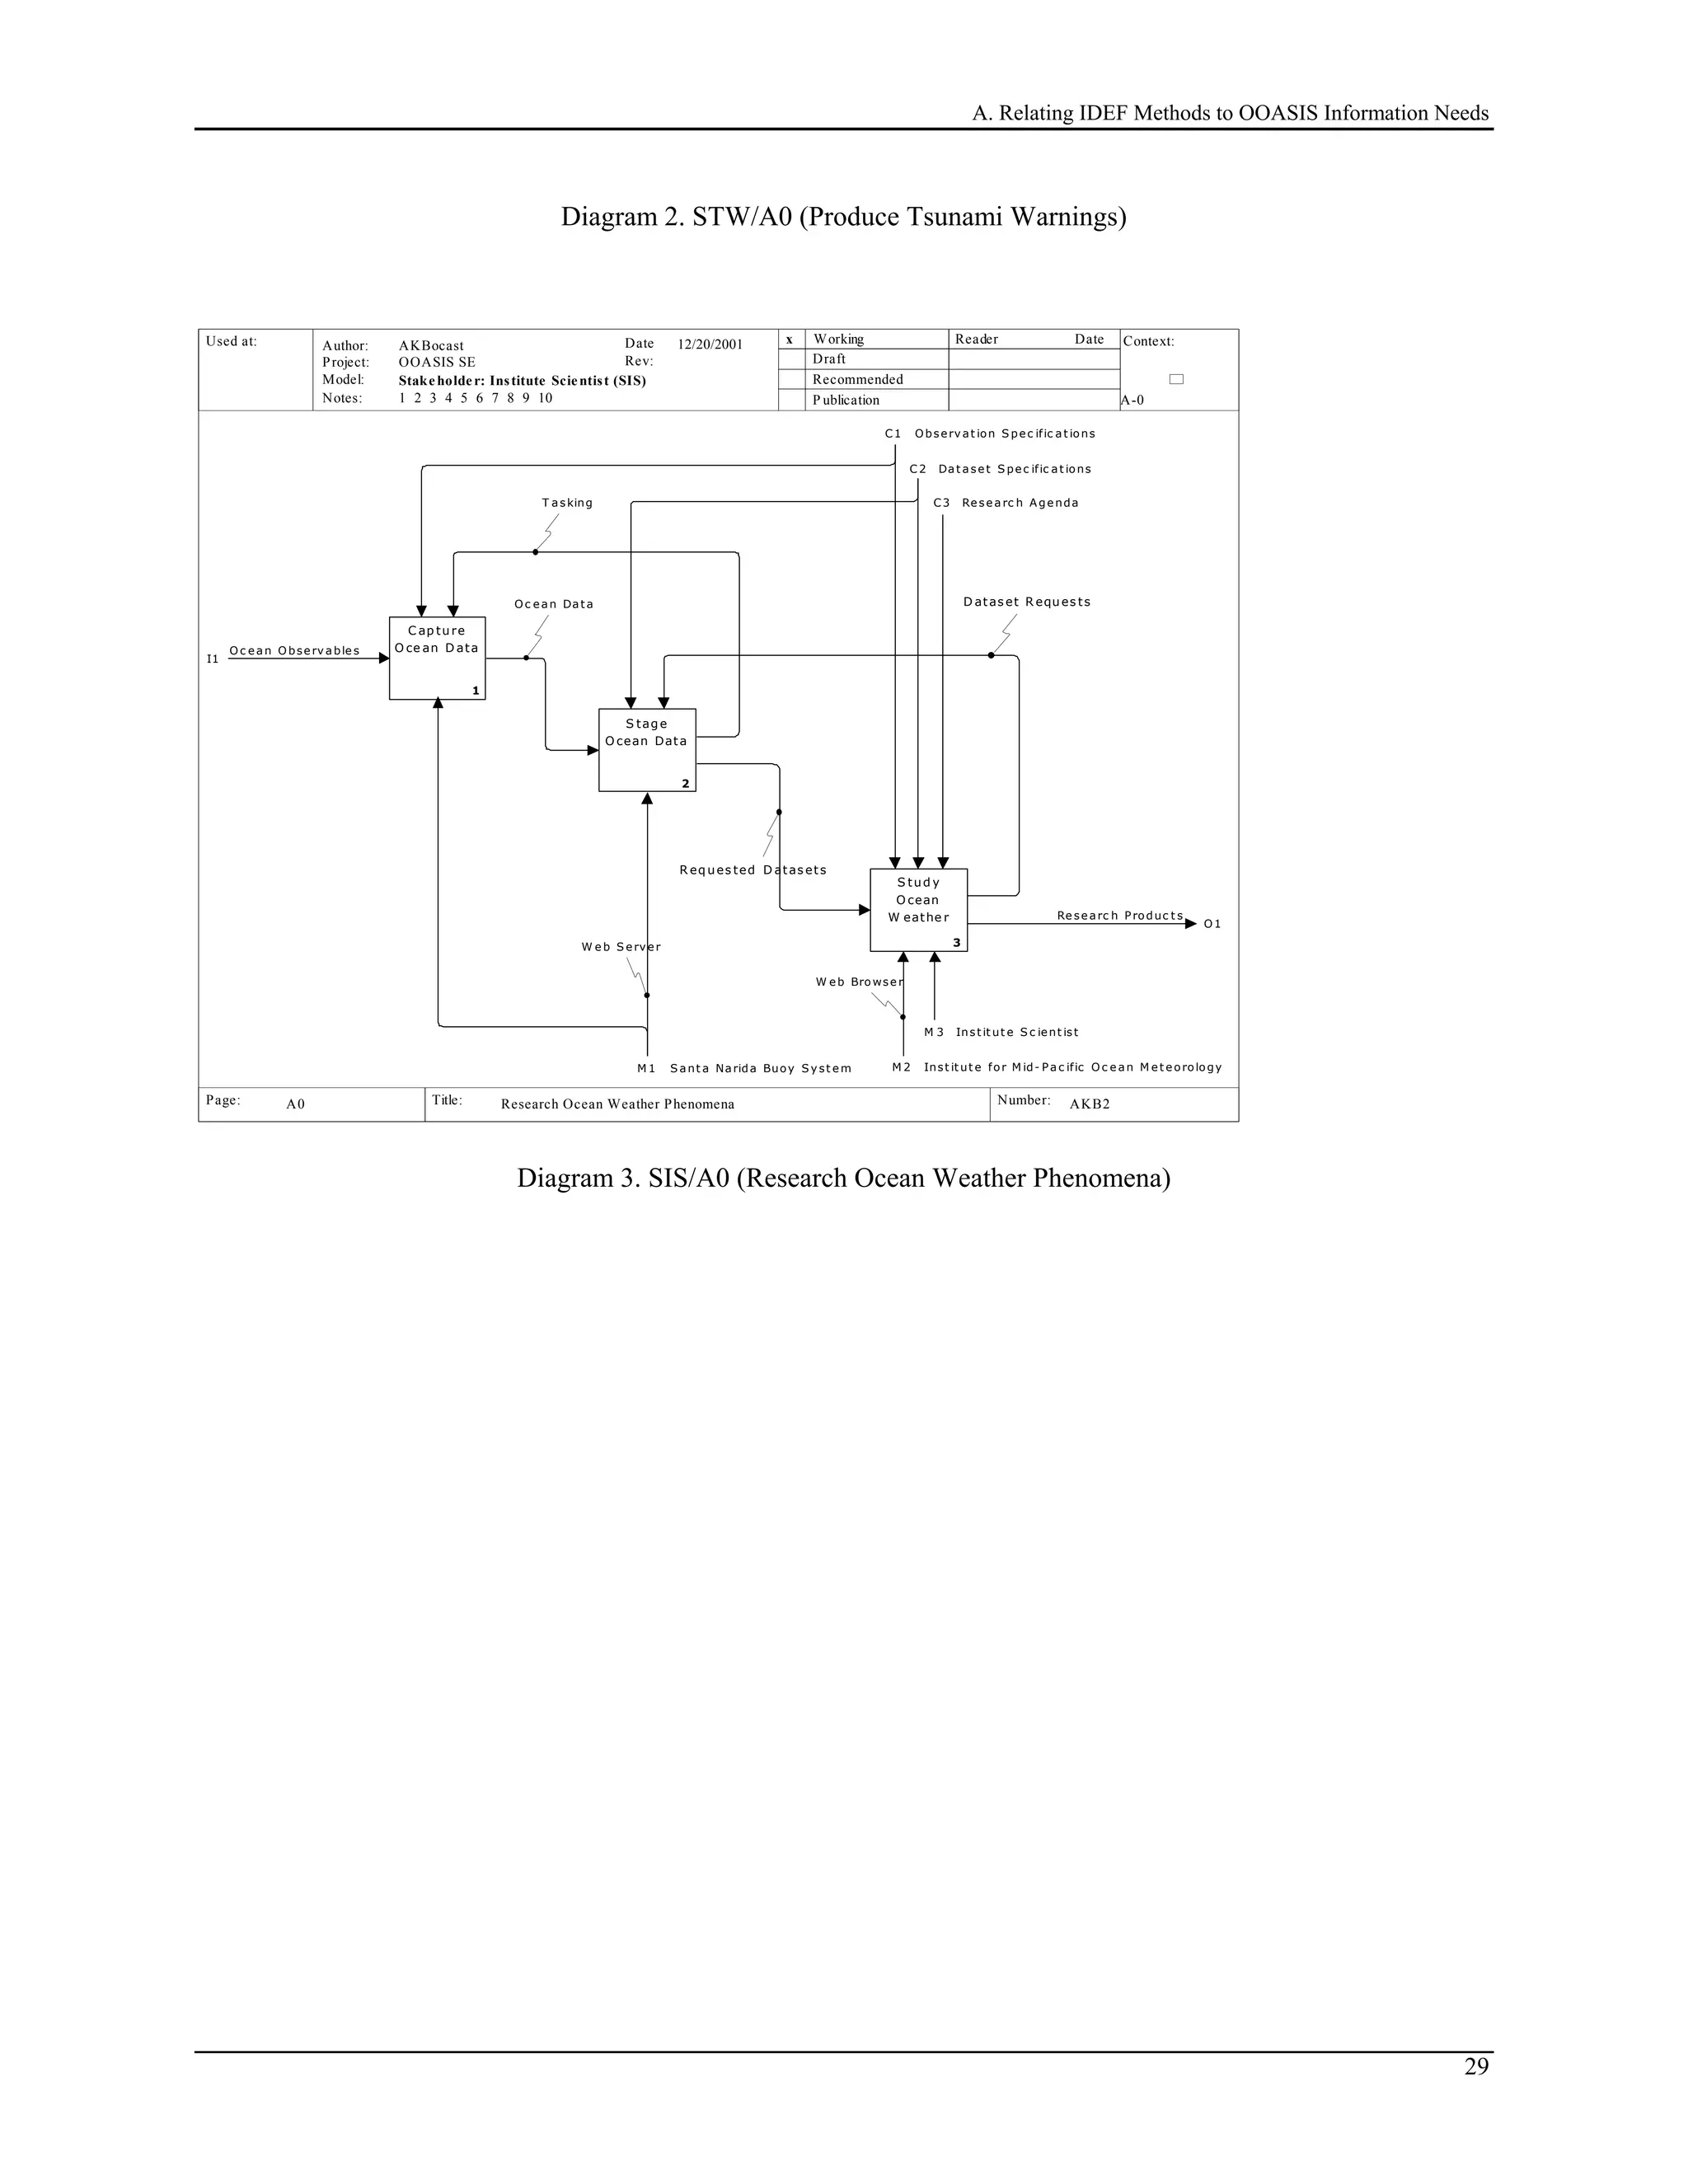
2. Build a family of models of the interests of external stakeholders. These include models are additional
to IDEF0 but depend on the information contained in IDEF0 with a focus on stakeholder behavior.
[These models will satisfy the OOASIS requirement for external stakeholder and summary use case
information.]
3. Build a family of environmental context models for the prospective system. These models are
organized around principle outputs to satisfy the interests of external stakeholders. These models
consolidate stakeholder interests from the perspective of the prospective system. These models treat
the prospective system as a black box. [These models will satisfy the OOASIS requirement for context
and external stakeholder information.]
4. If appropriate, build an architecture model(s) of any existing system(s), to include environment
context diagrams. If you are re-engineering a system, an architecture model of the existing system is
always appropriate. If you are building a new system to provide completely new behavior, the need
for an architecture model of existing behavior is problematic and will need to be established. The
systems engineering process will generally use depictions of architecture which are additional to
IDEF0. The information in these models ties to the mechanisms in IDEF0. [This model(s) will satisfy
the OOASIS requirement for AS-IS context, external stakeholder, and process information.]
5. Build a family of requirements models for the prospective system. These requirements models
decompose the system behavior (i.e., the A0 activity) specified by the environmental context models.
The first iteration of these models will focus on expected, correct behavior (the simplest, shortest,
successful path to achieving a goal(s)). (A corollary of this modeling objective is that these
requirements models may not use call arrows.) [These models will satisfy the OOASIS requirement
for context, external stakeholder, and TO-BE process information.]
6. Build a family of architecture models for the prospective system. The architecture models allocate
mechanisms to the decomposed system behavior of the requirements models. Particular attention will
be paid in this allocation to identify internal stakeholders and COTS hardware and software. Note that
this allocation will be exploratory and tentative. The systems engineering process will generally use
depictions of architecture which are additional to IDEF0. The information in these models ties to the
mechanisms in IDEF0. [These models will satisfy the OOASIS requirement for context, external
stakeholder, and process information. In addition, these models will identify internal stakeholders,
COTS software, COTS hardware, and their interfaces.]
24](https://image.slidesharecdn.com/armstrongbocastintegrationofsystemsengineeringandsoftwaredevelopment2003-libre-150404105226-conversion-gate01/75/Armstrong-bocast-integration_of_systems_engineering_and_software_development_2003-libre-40-2048.jpg)
![A. Relating IDEF Methods to OOASIS Information Needs
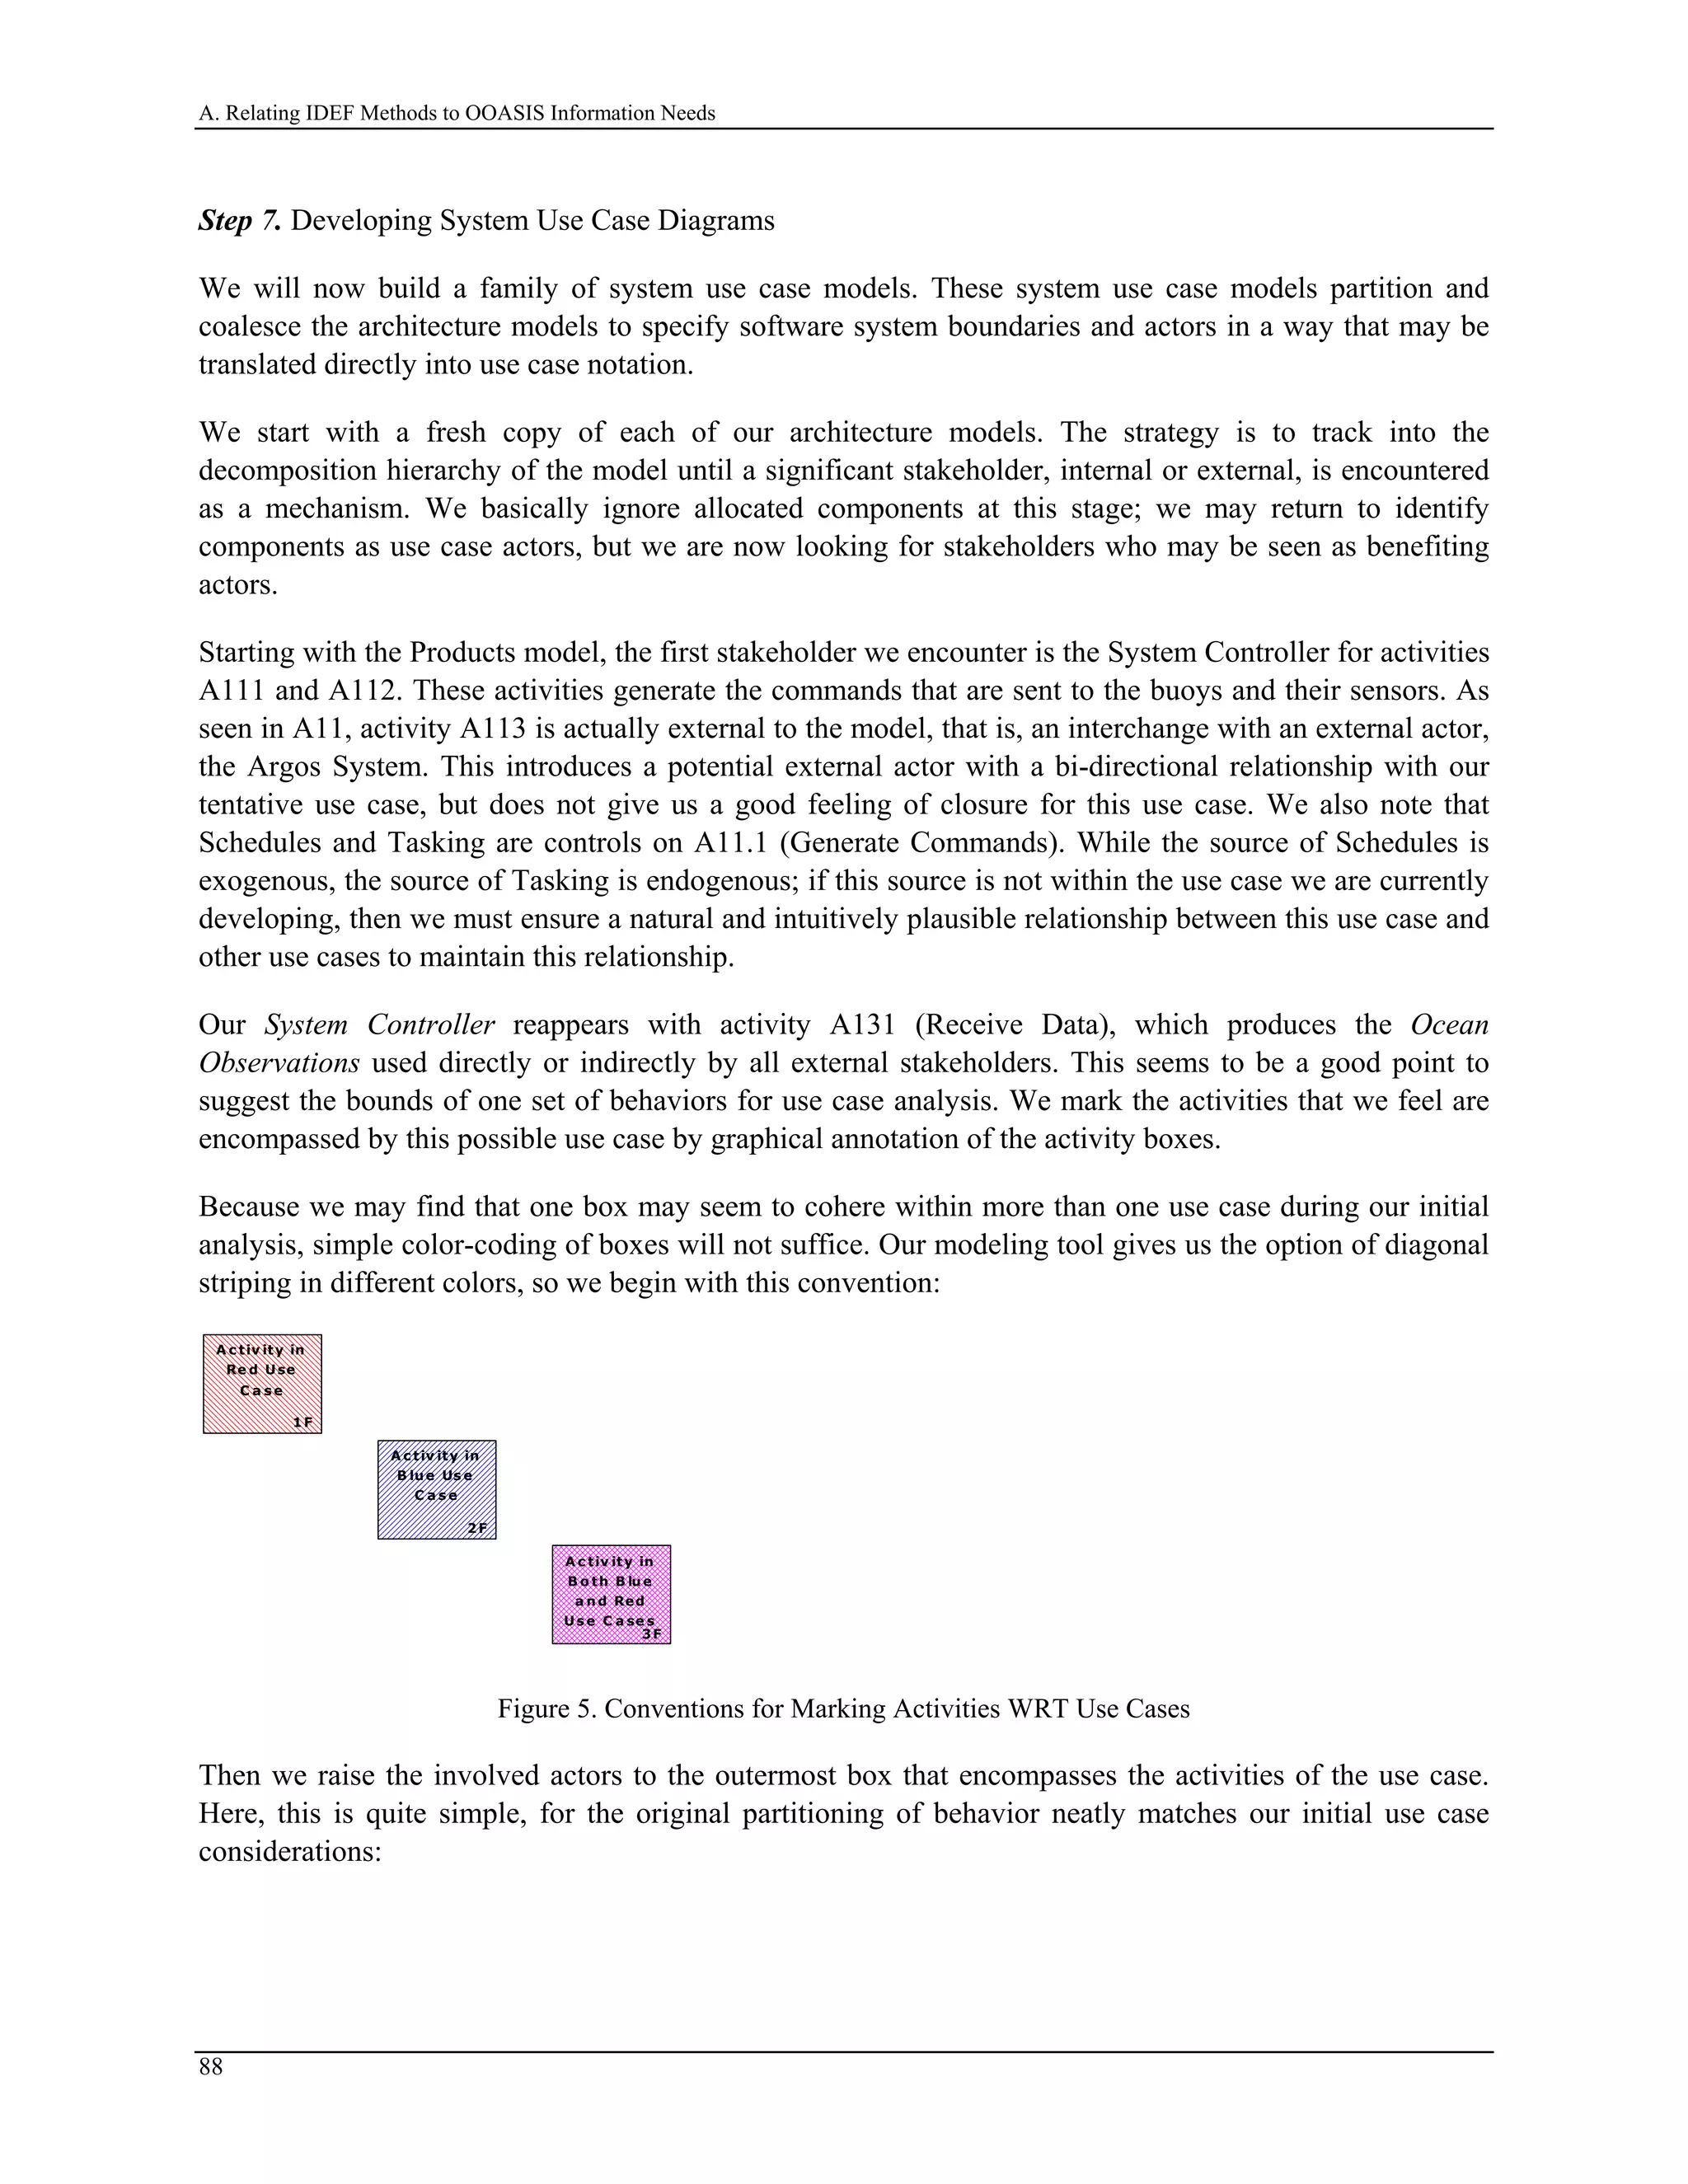
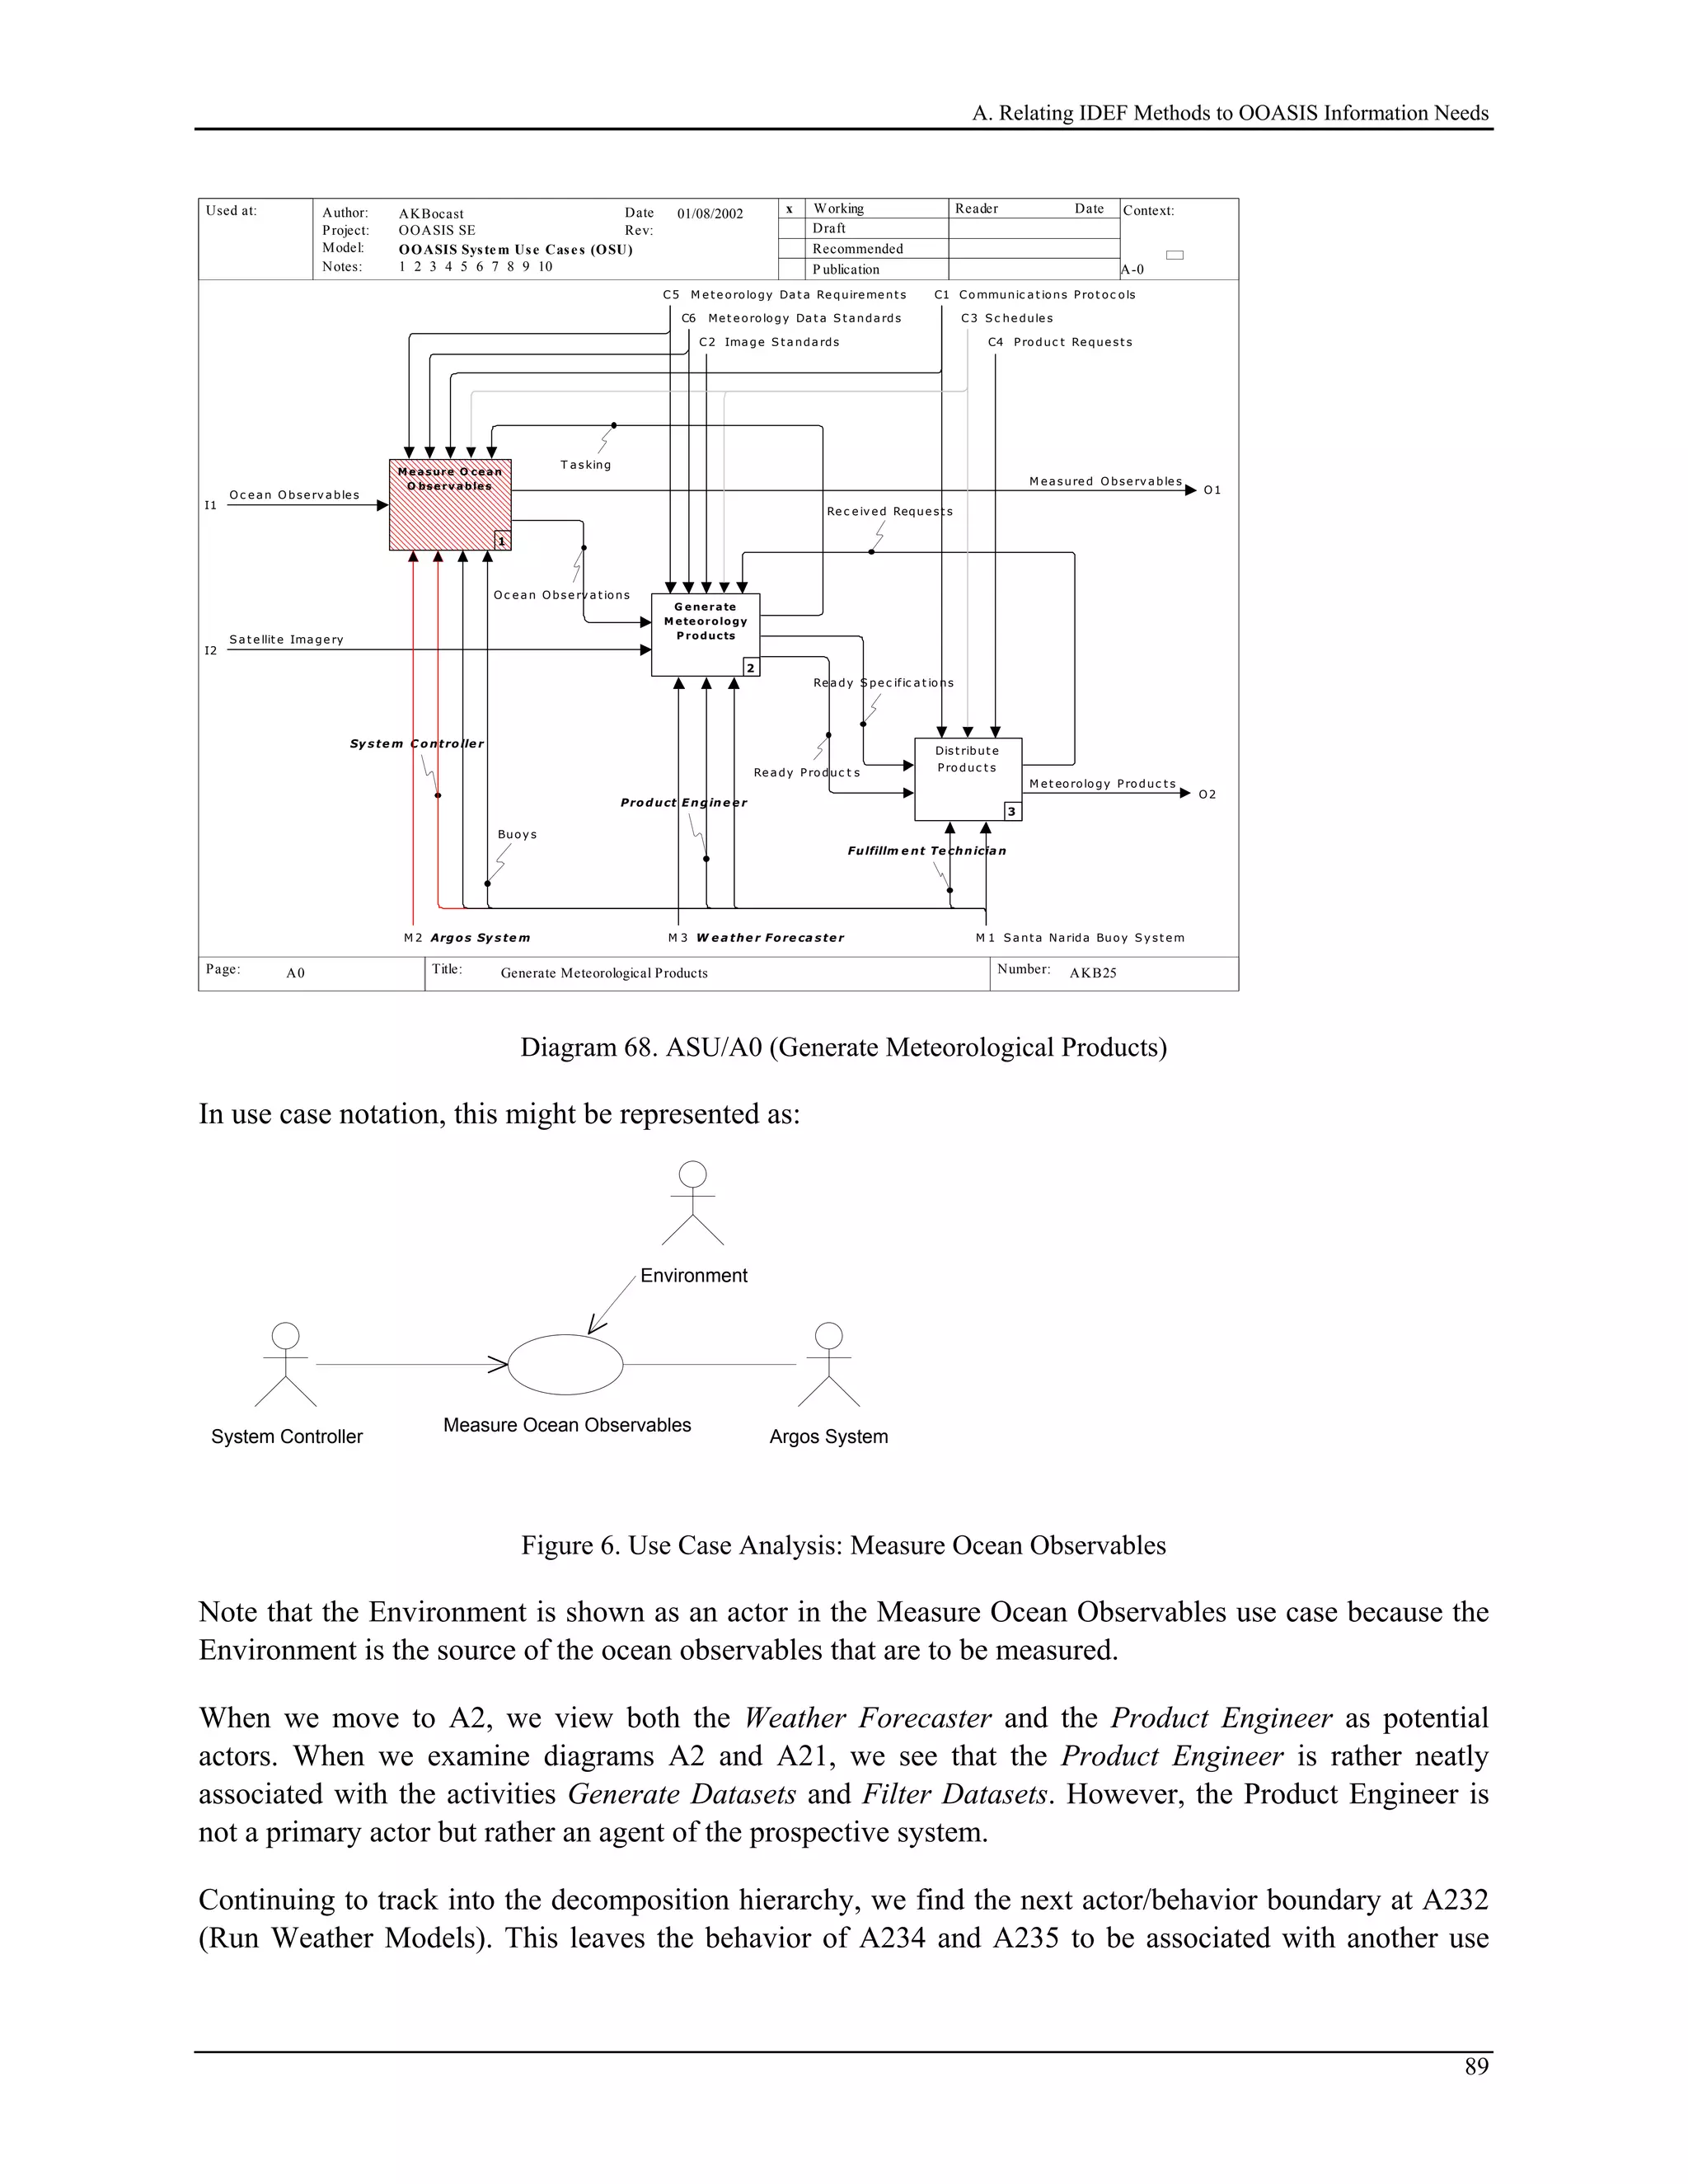
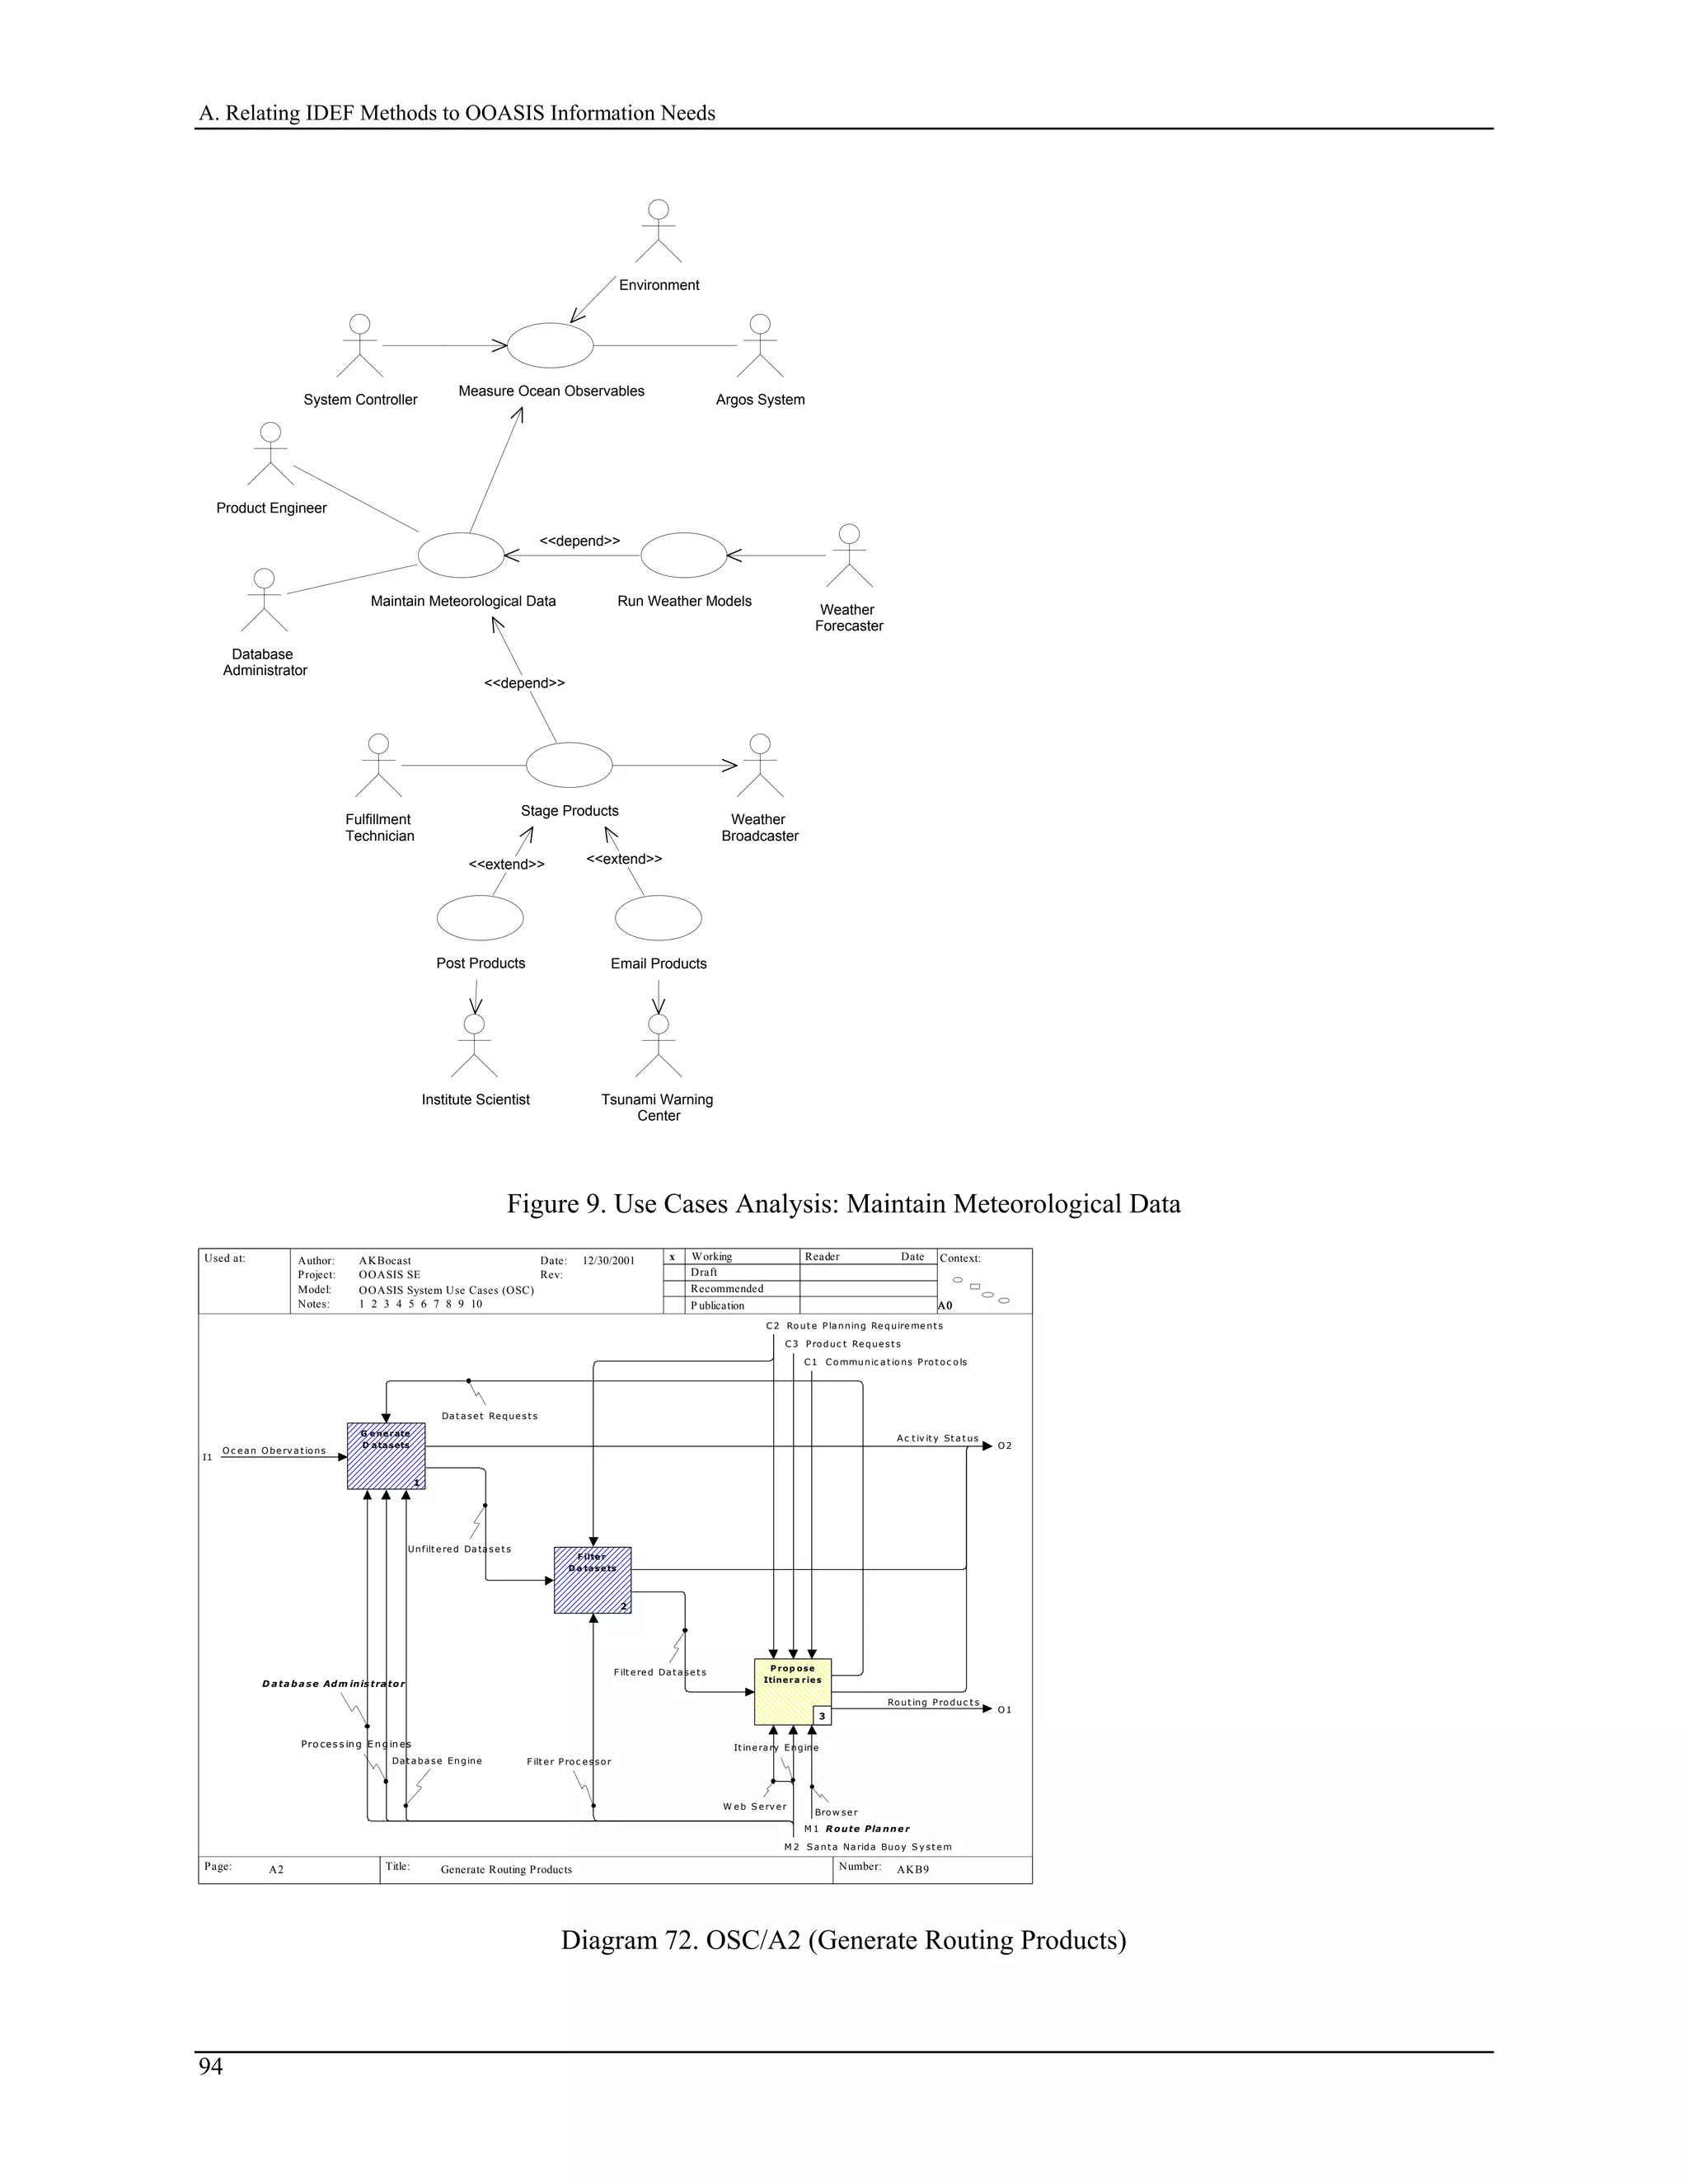
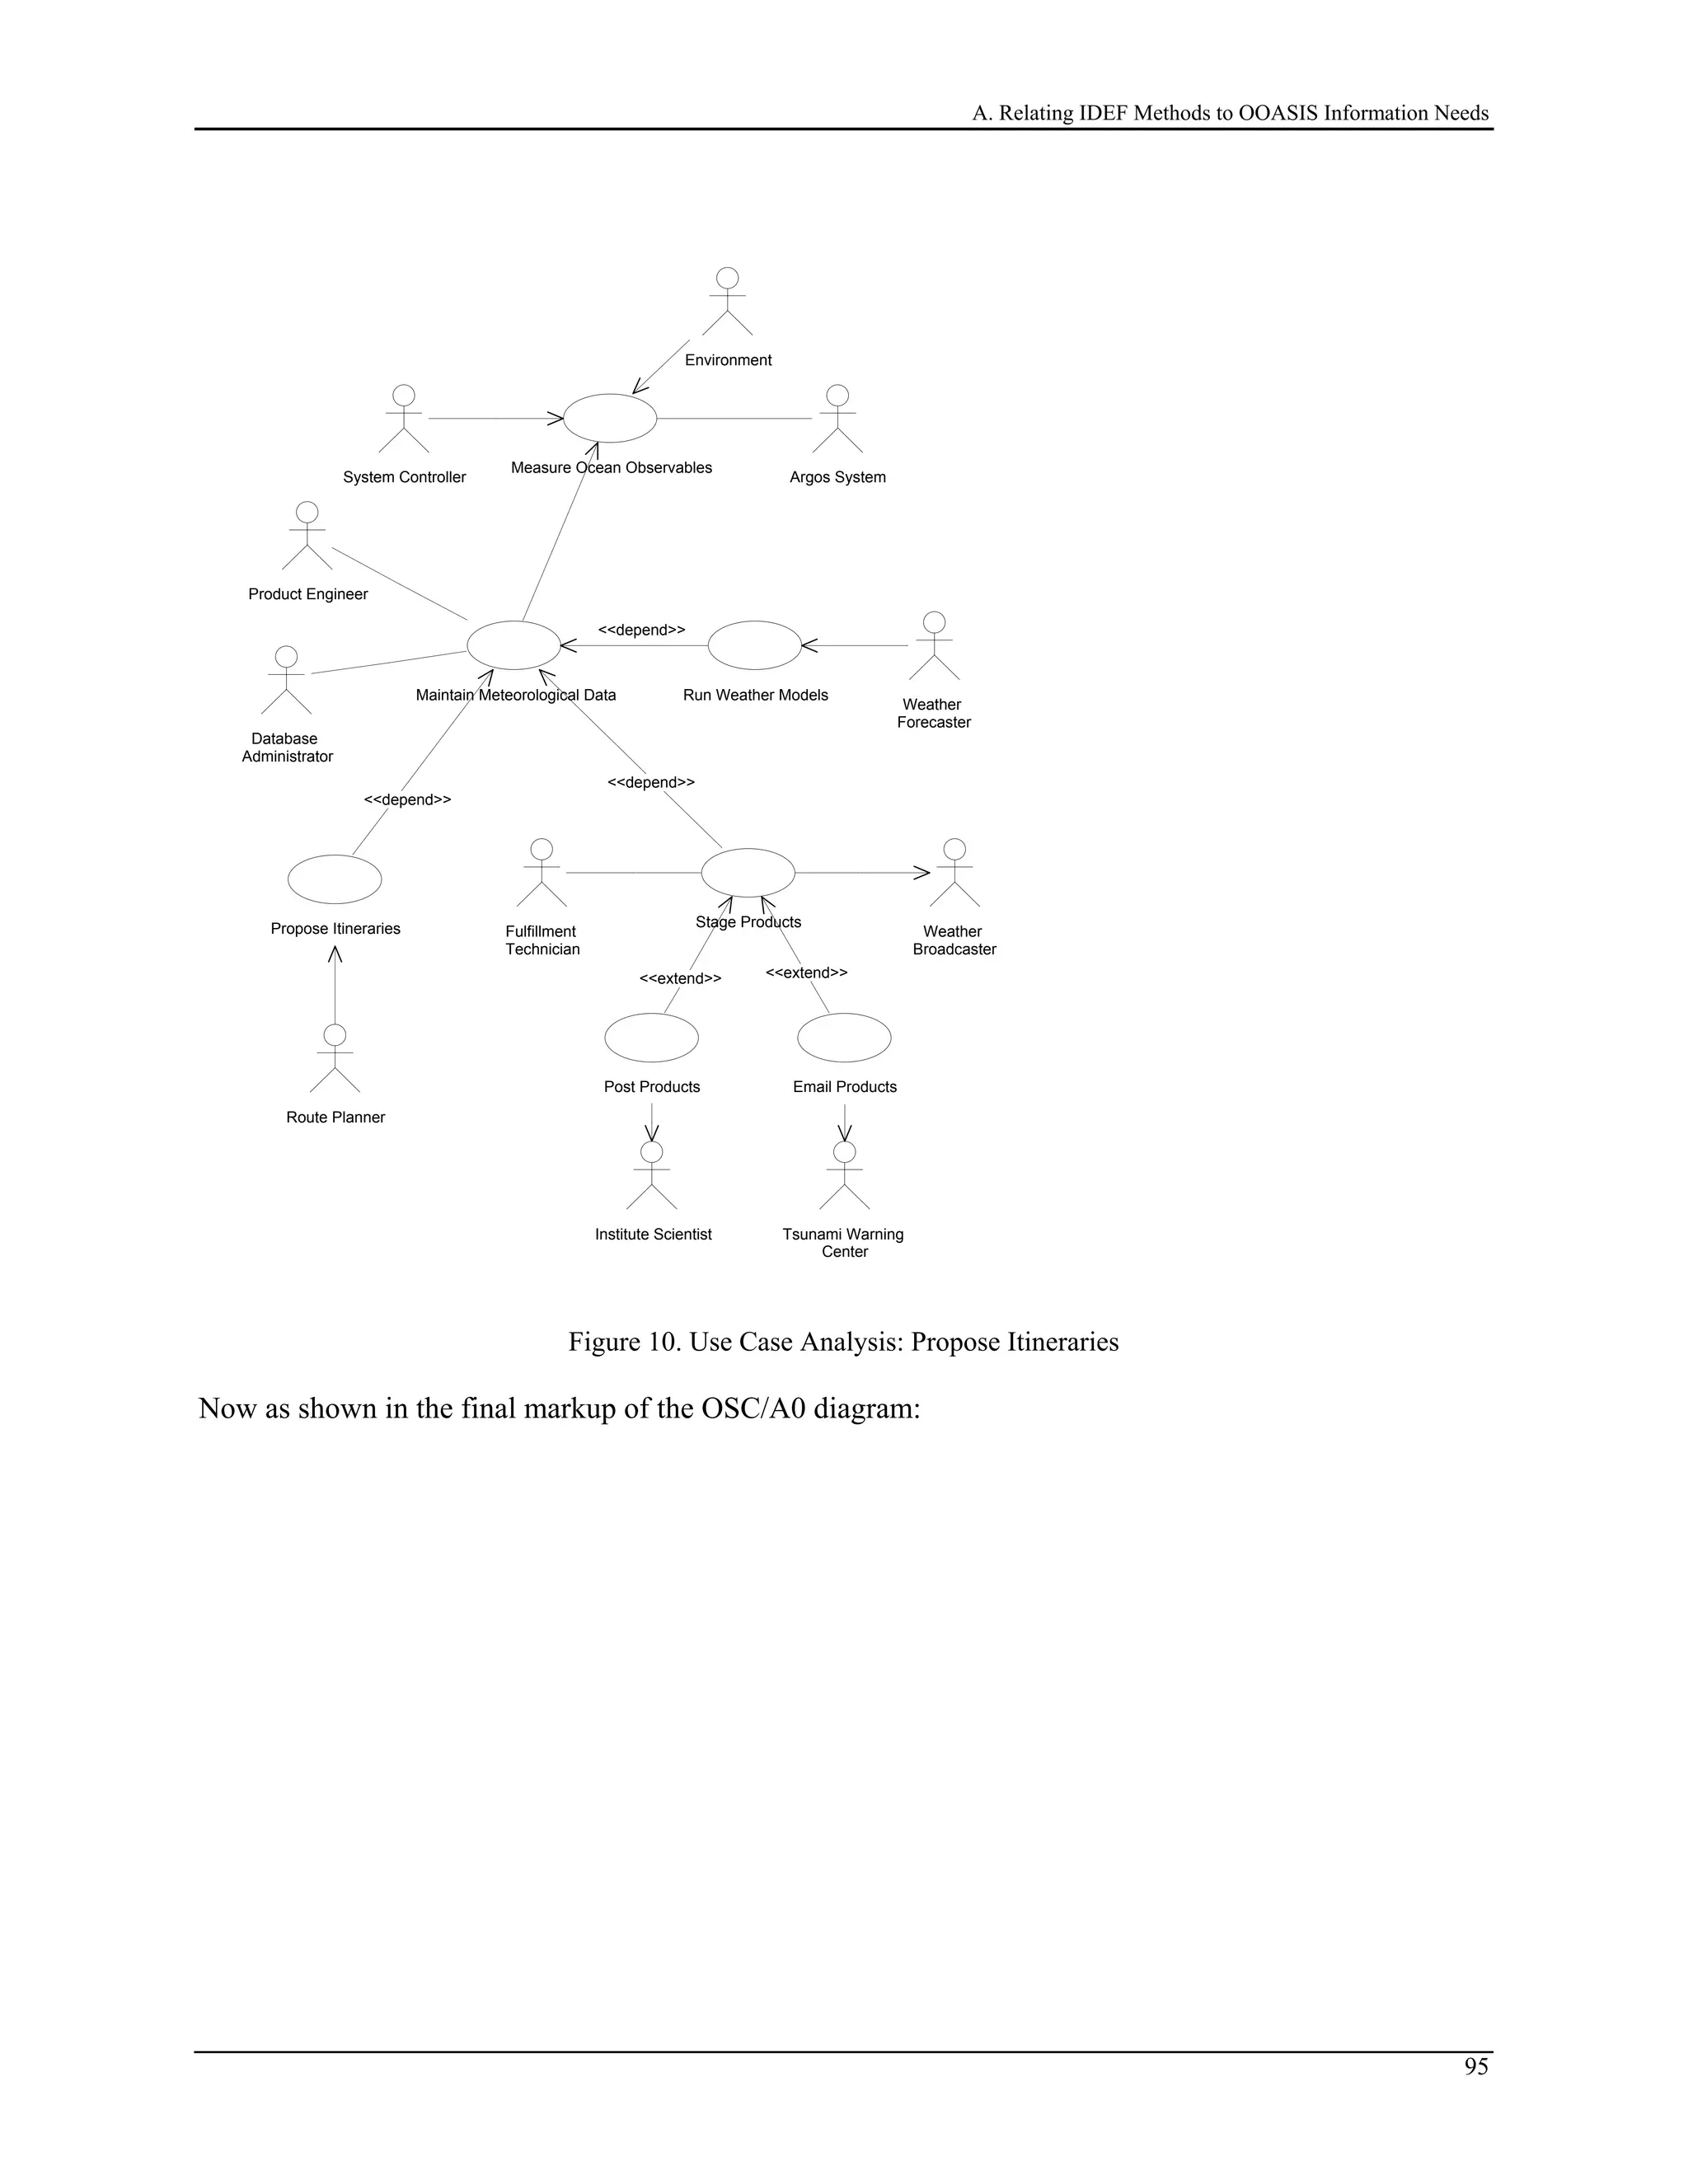
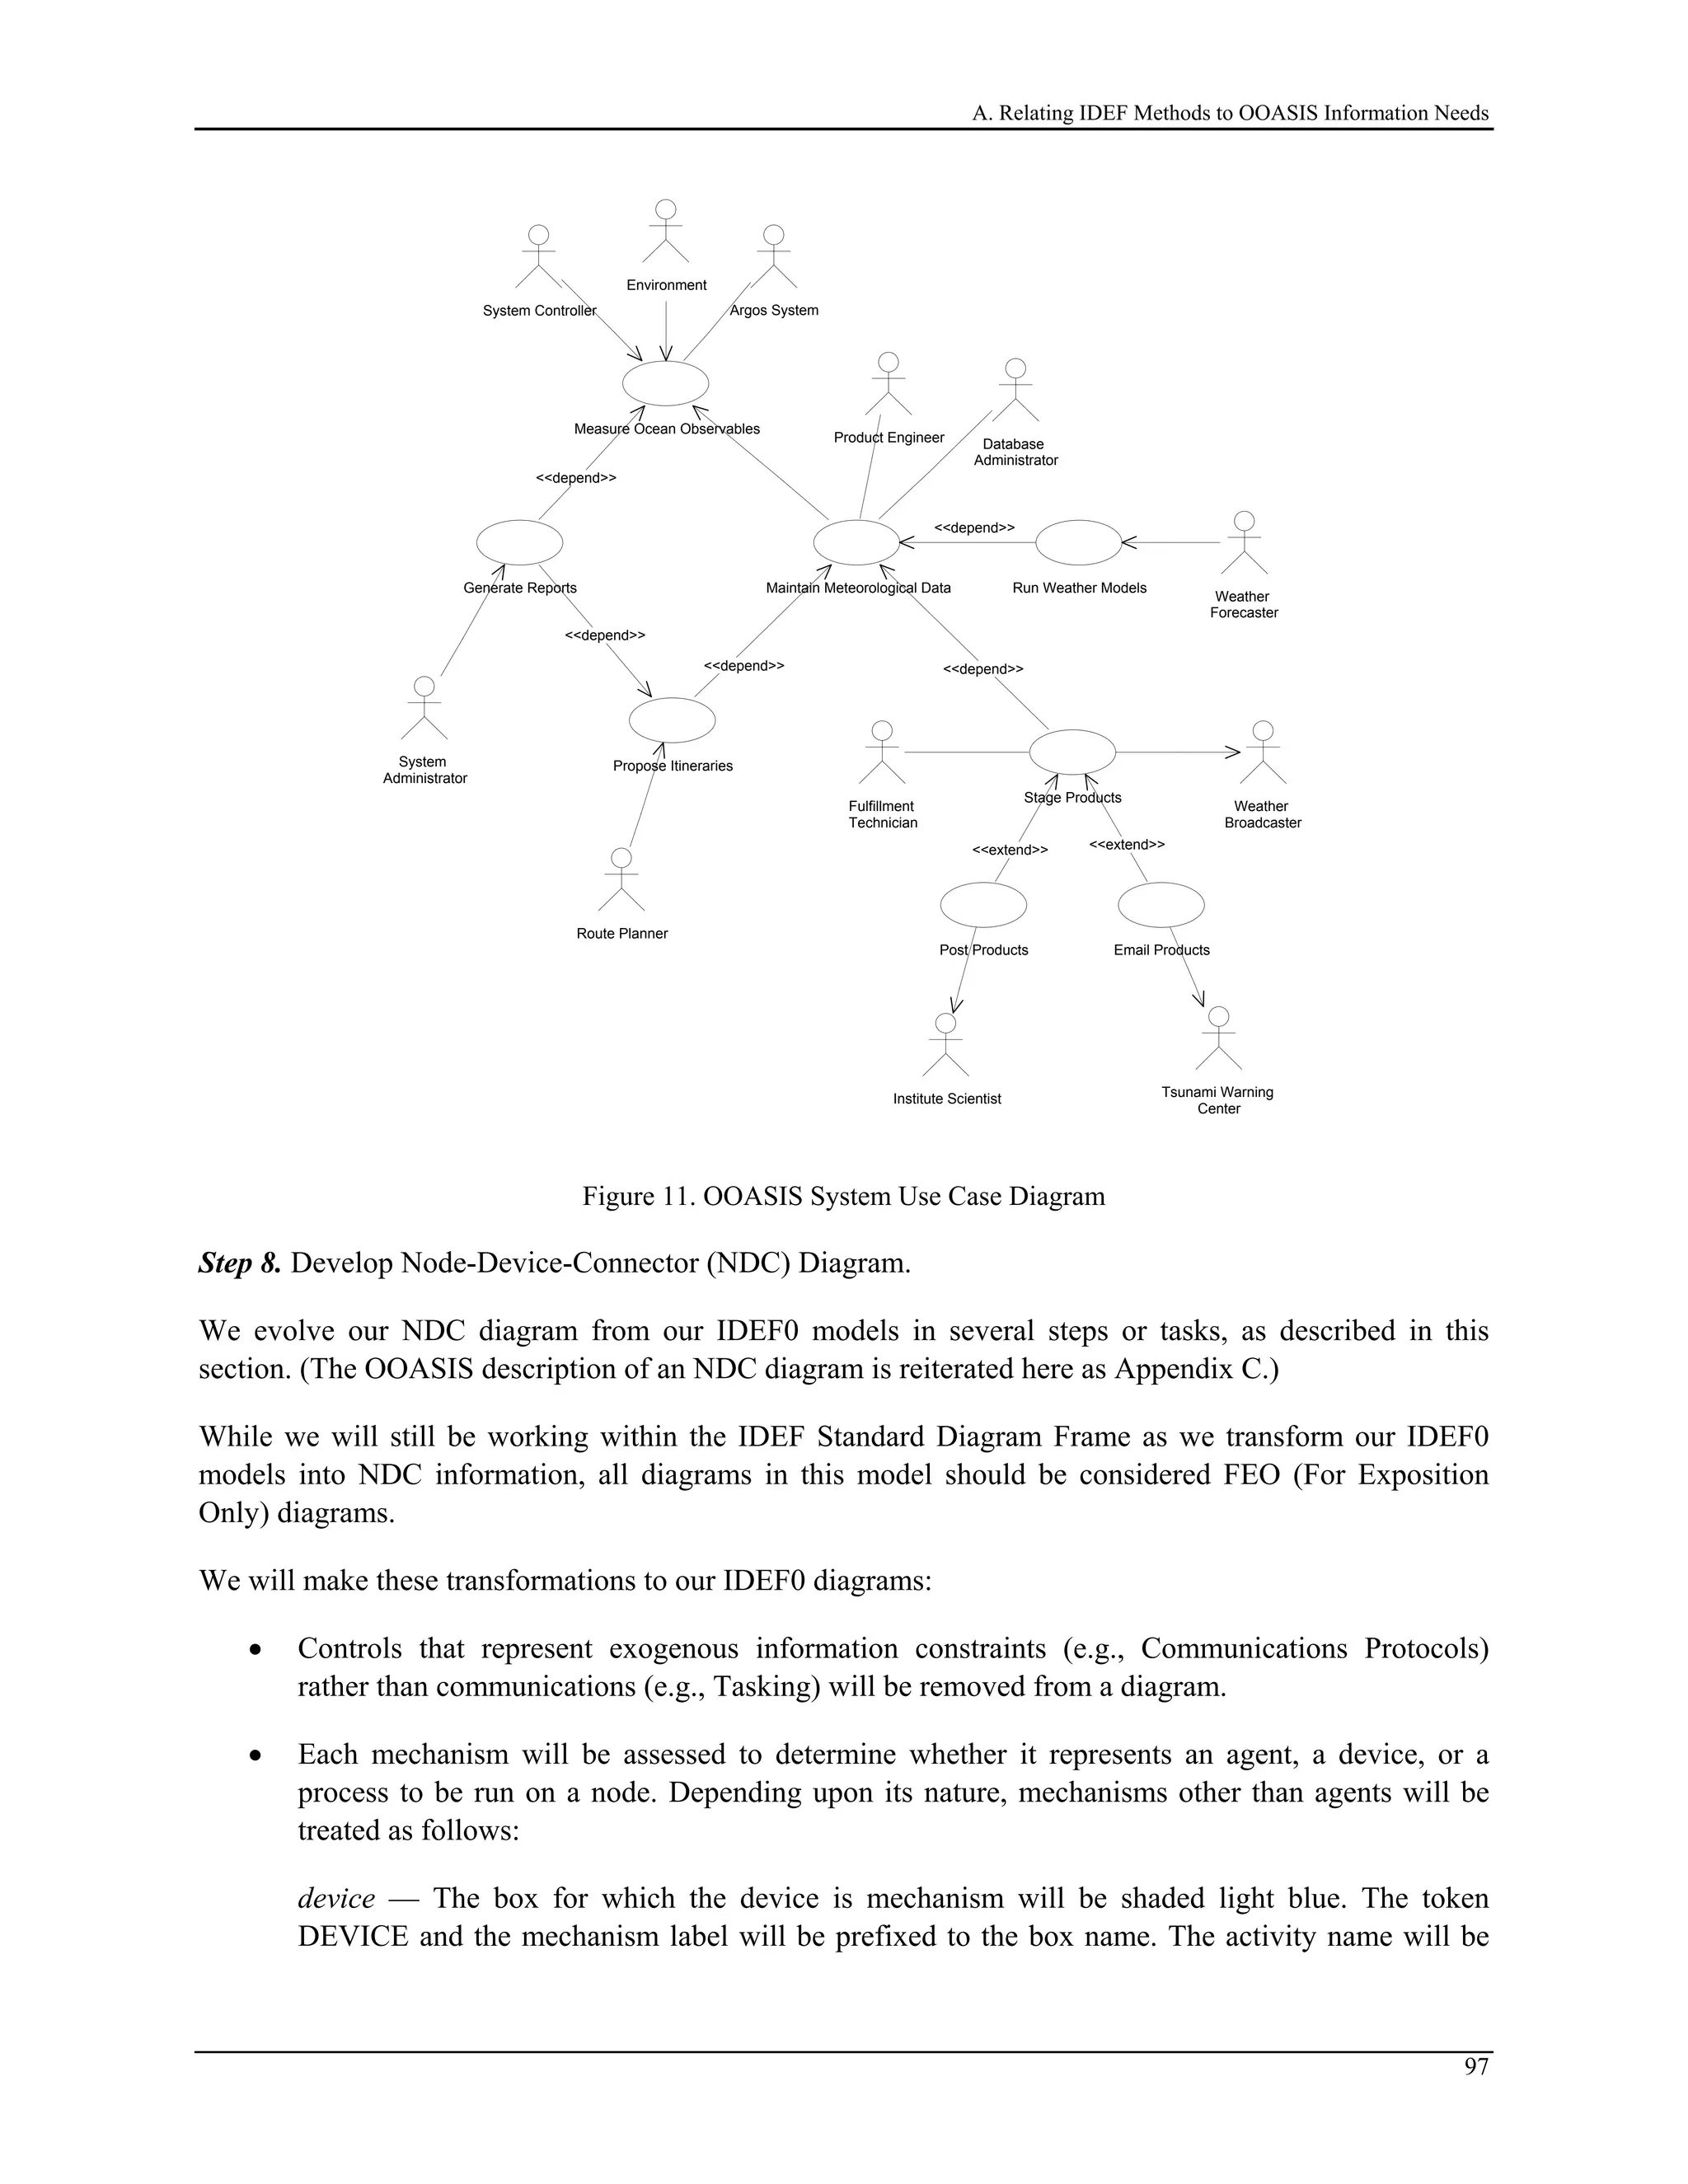
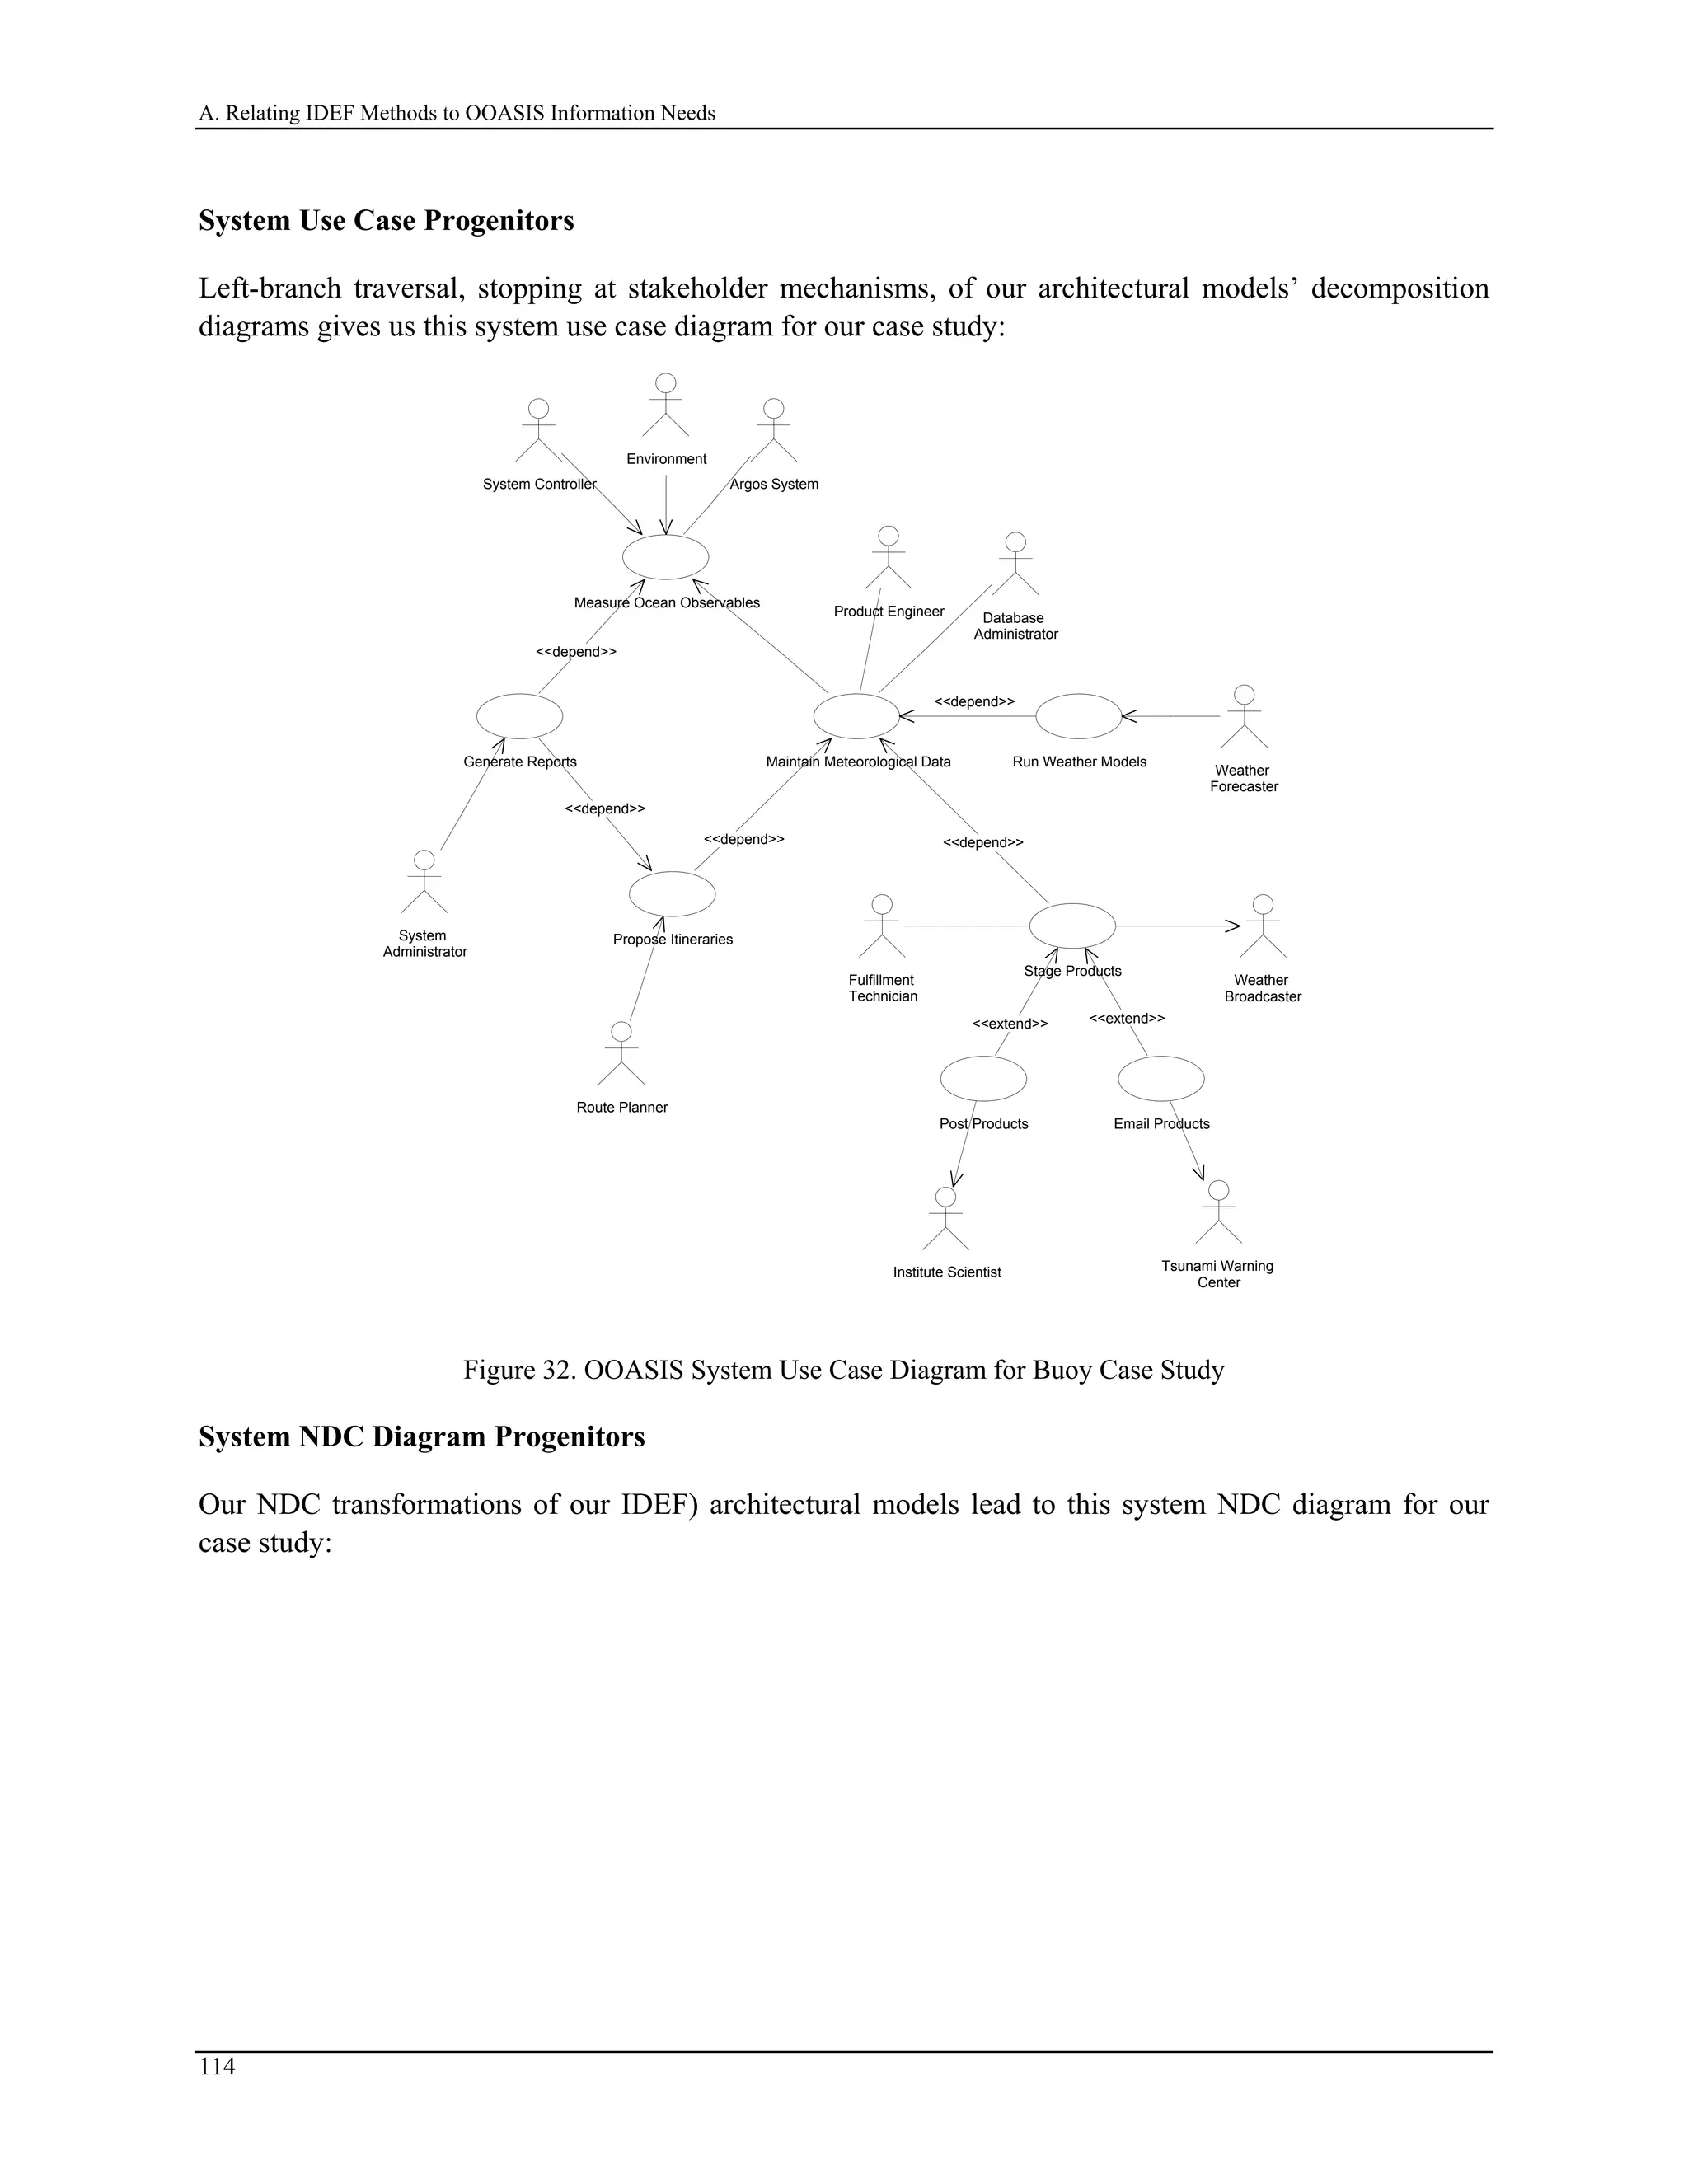
7. Build a family of system use case models. These system use case models partition and coalesce the
architecture models to specify software system boundaries and actors in a way that may be translated
directly into use case notation. [These models will satisfy OOASIS requirements for system use
cases.]
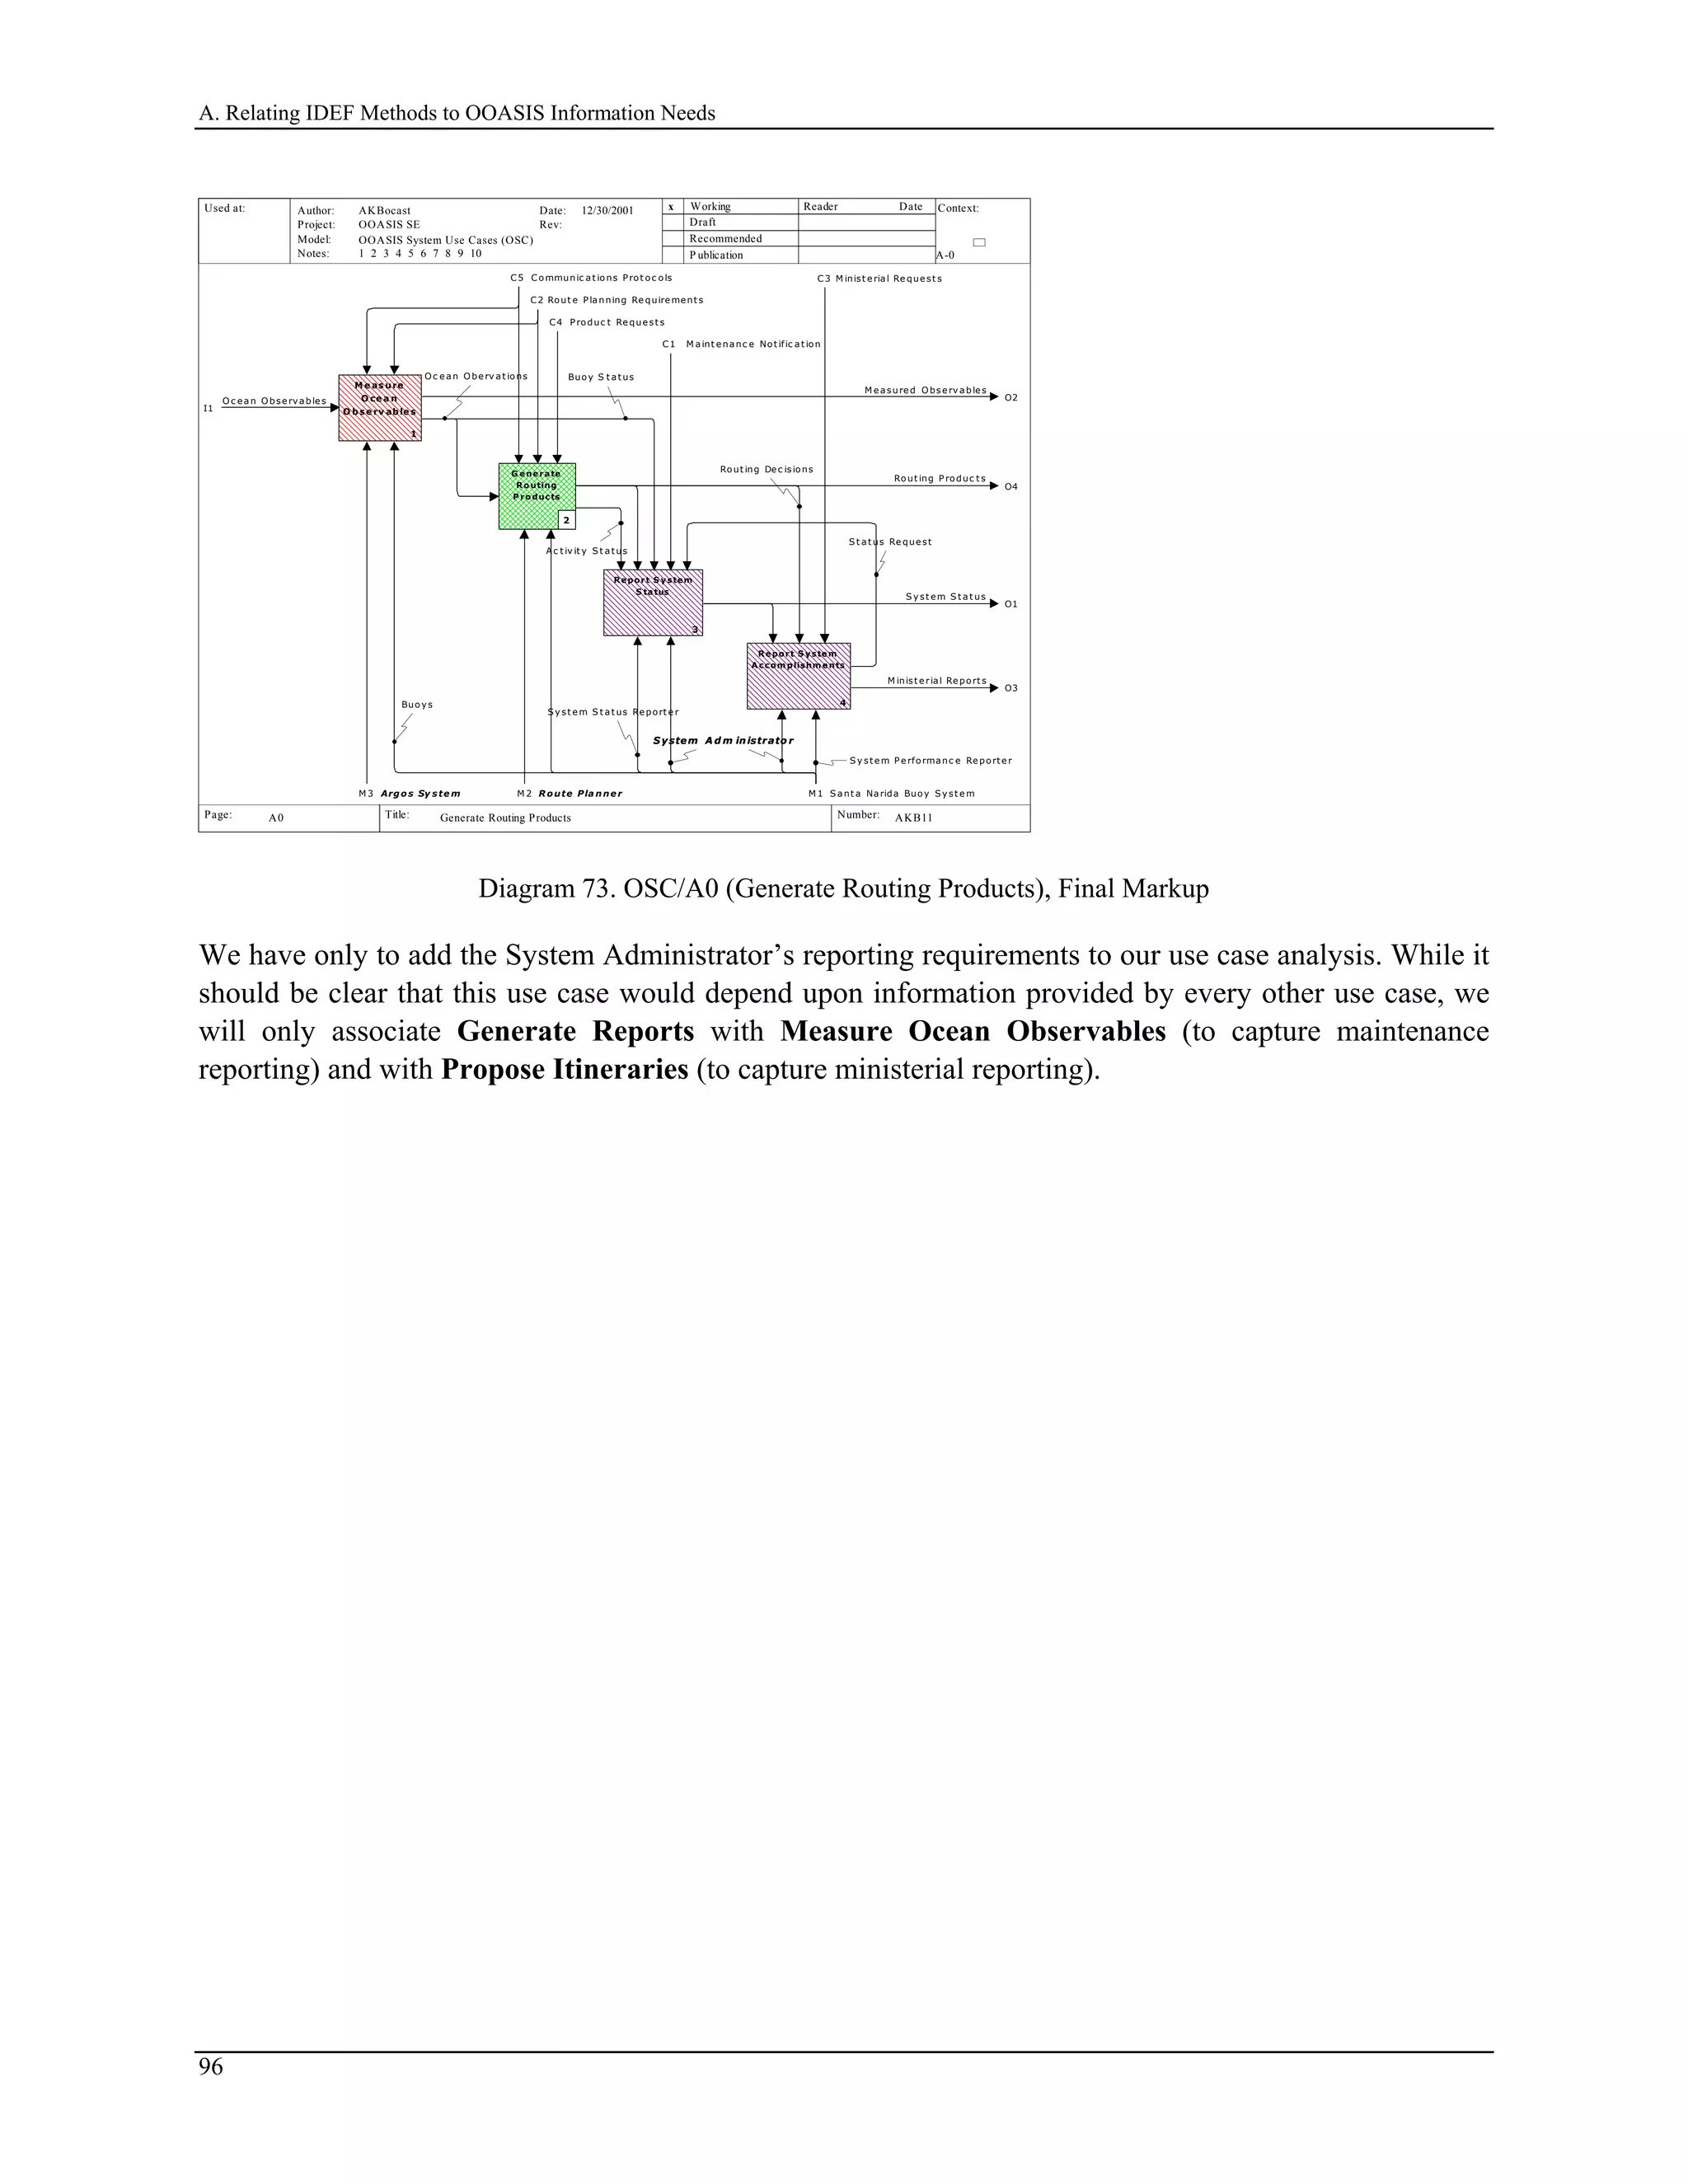
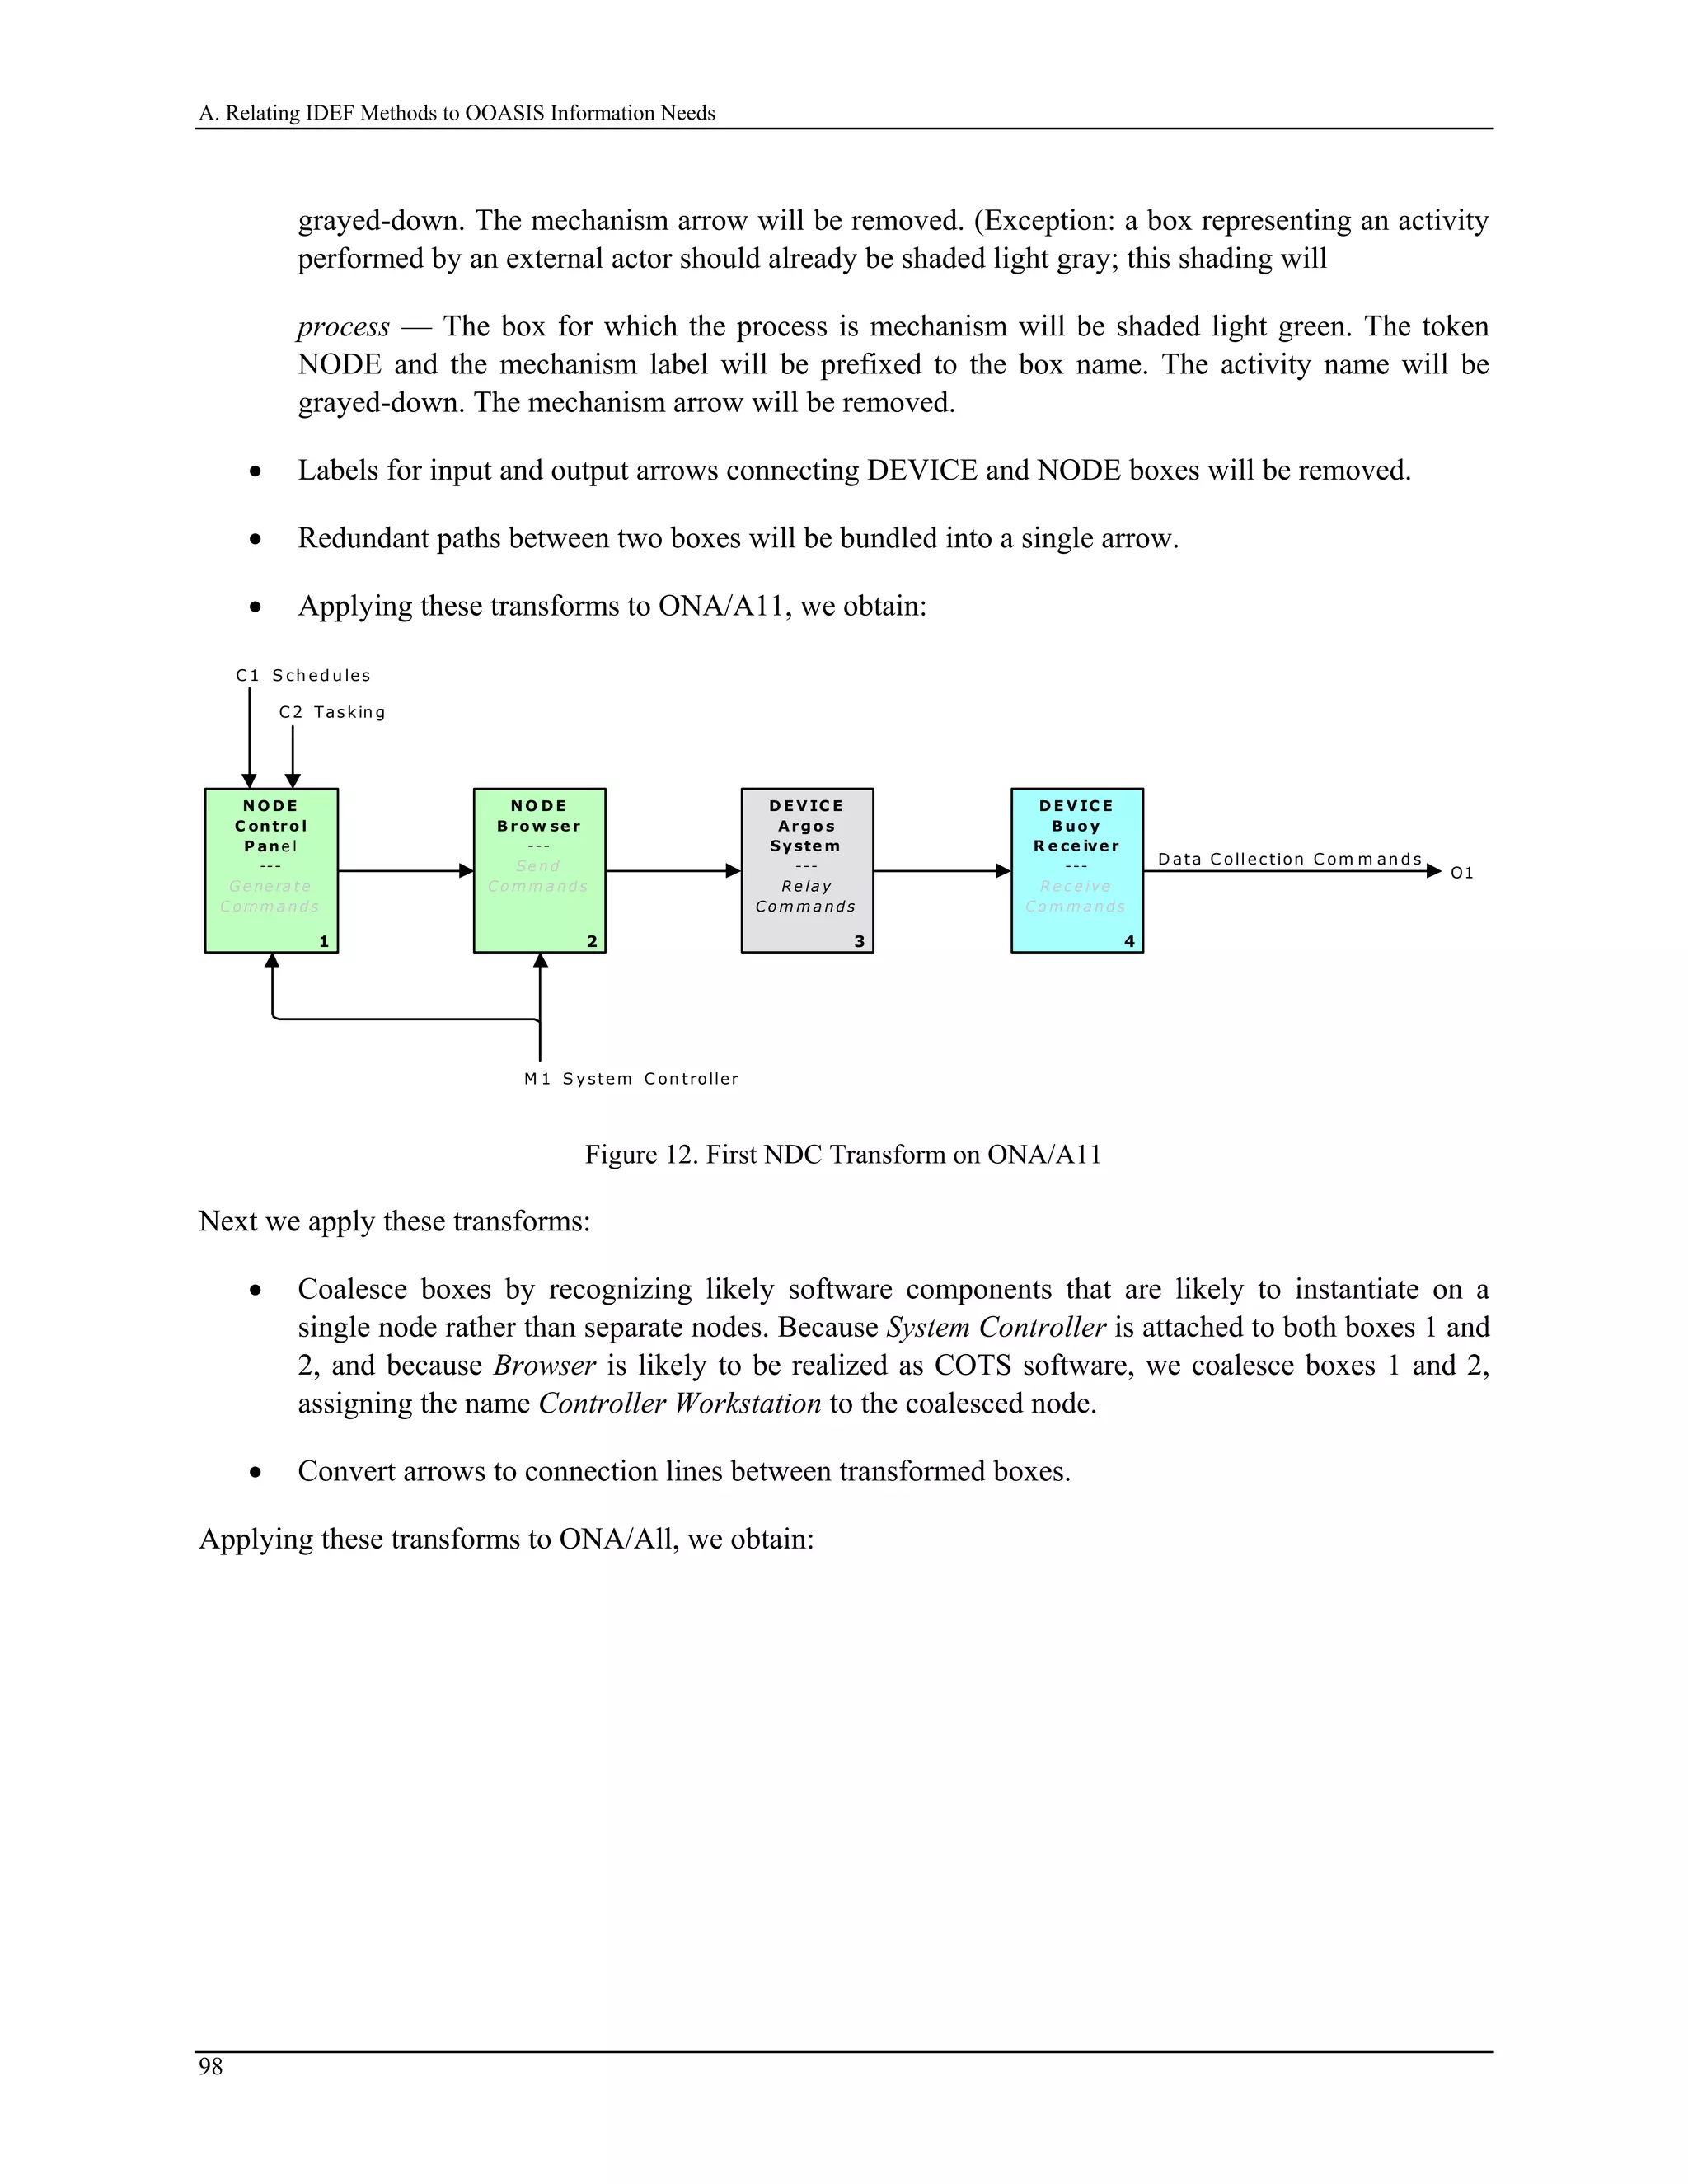
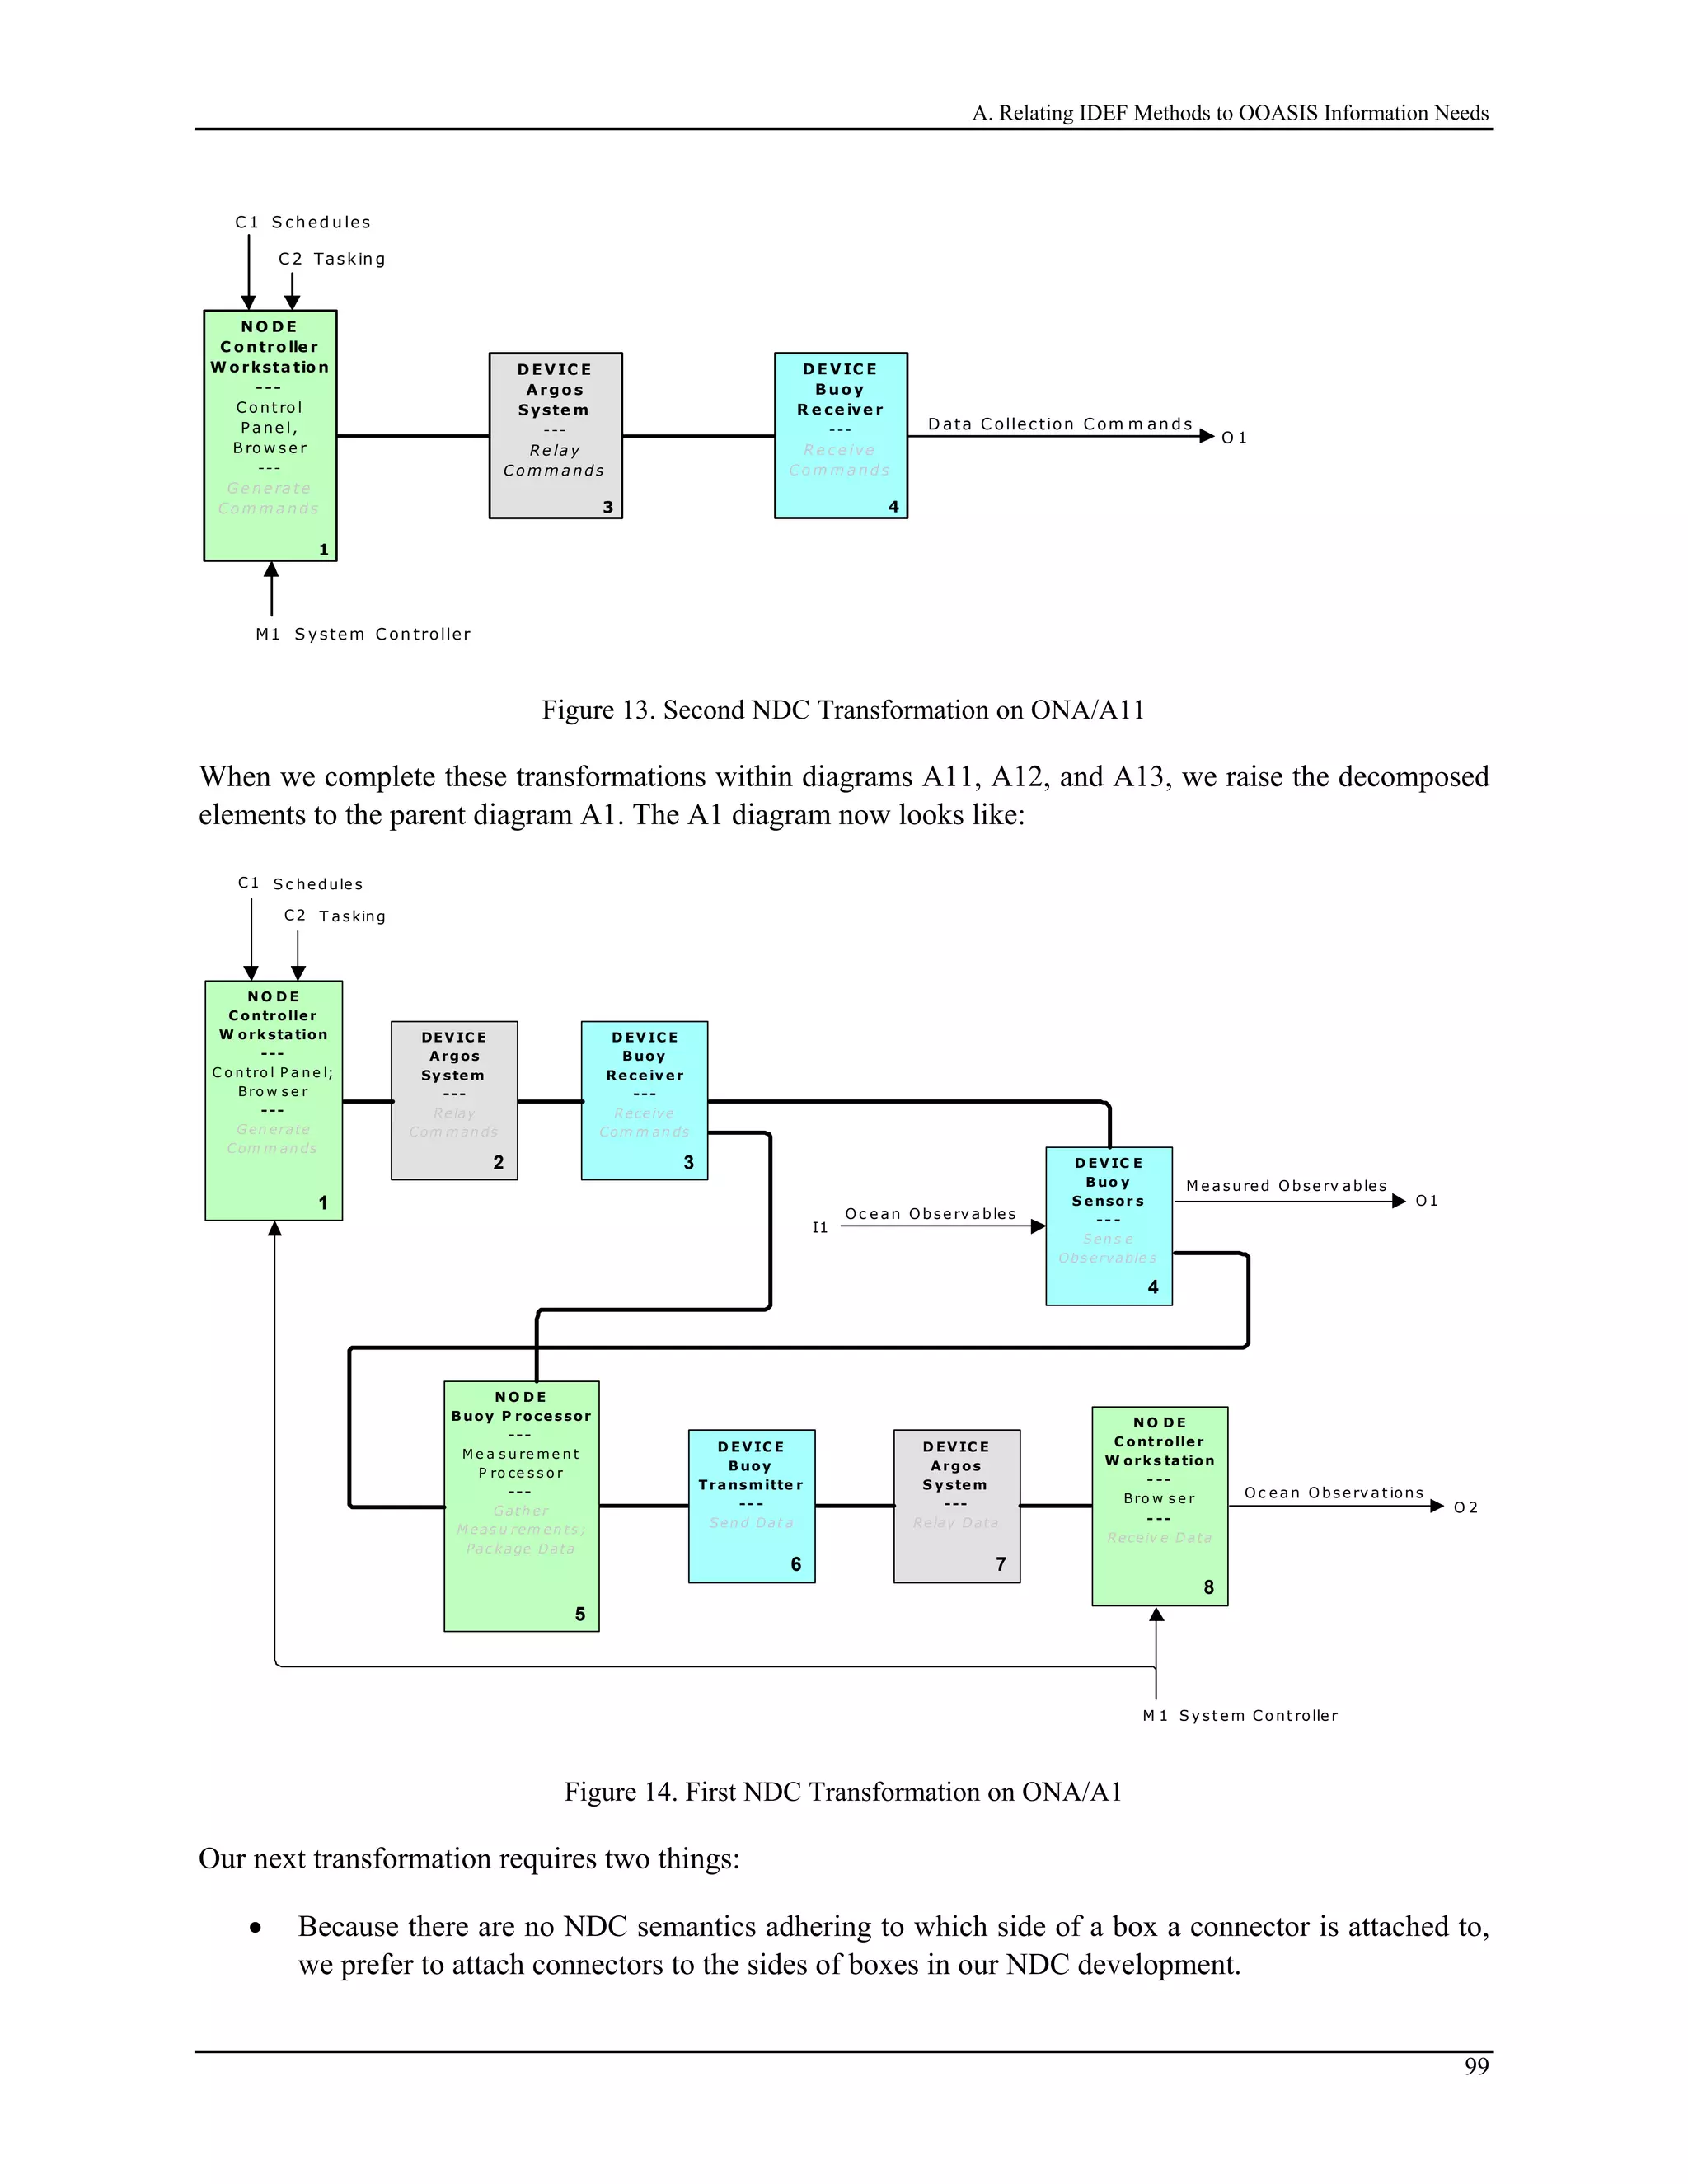
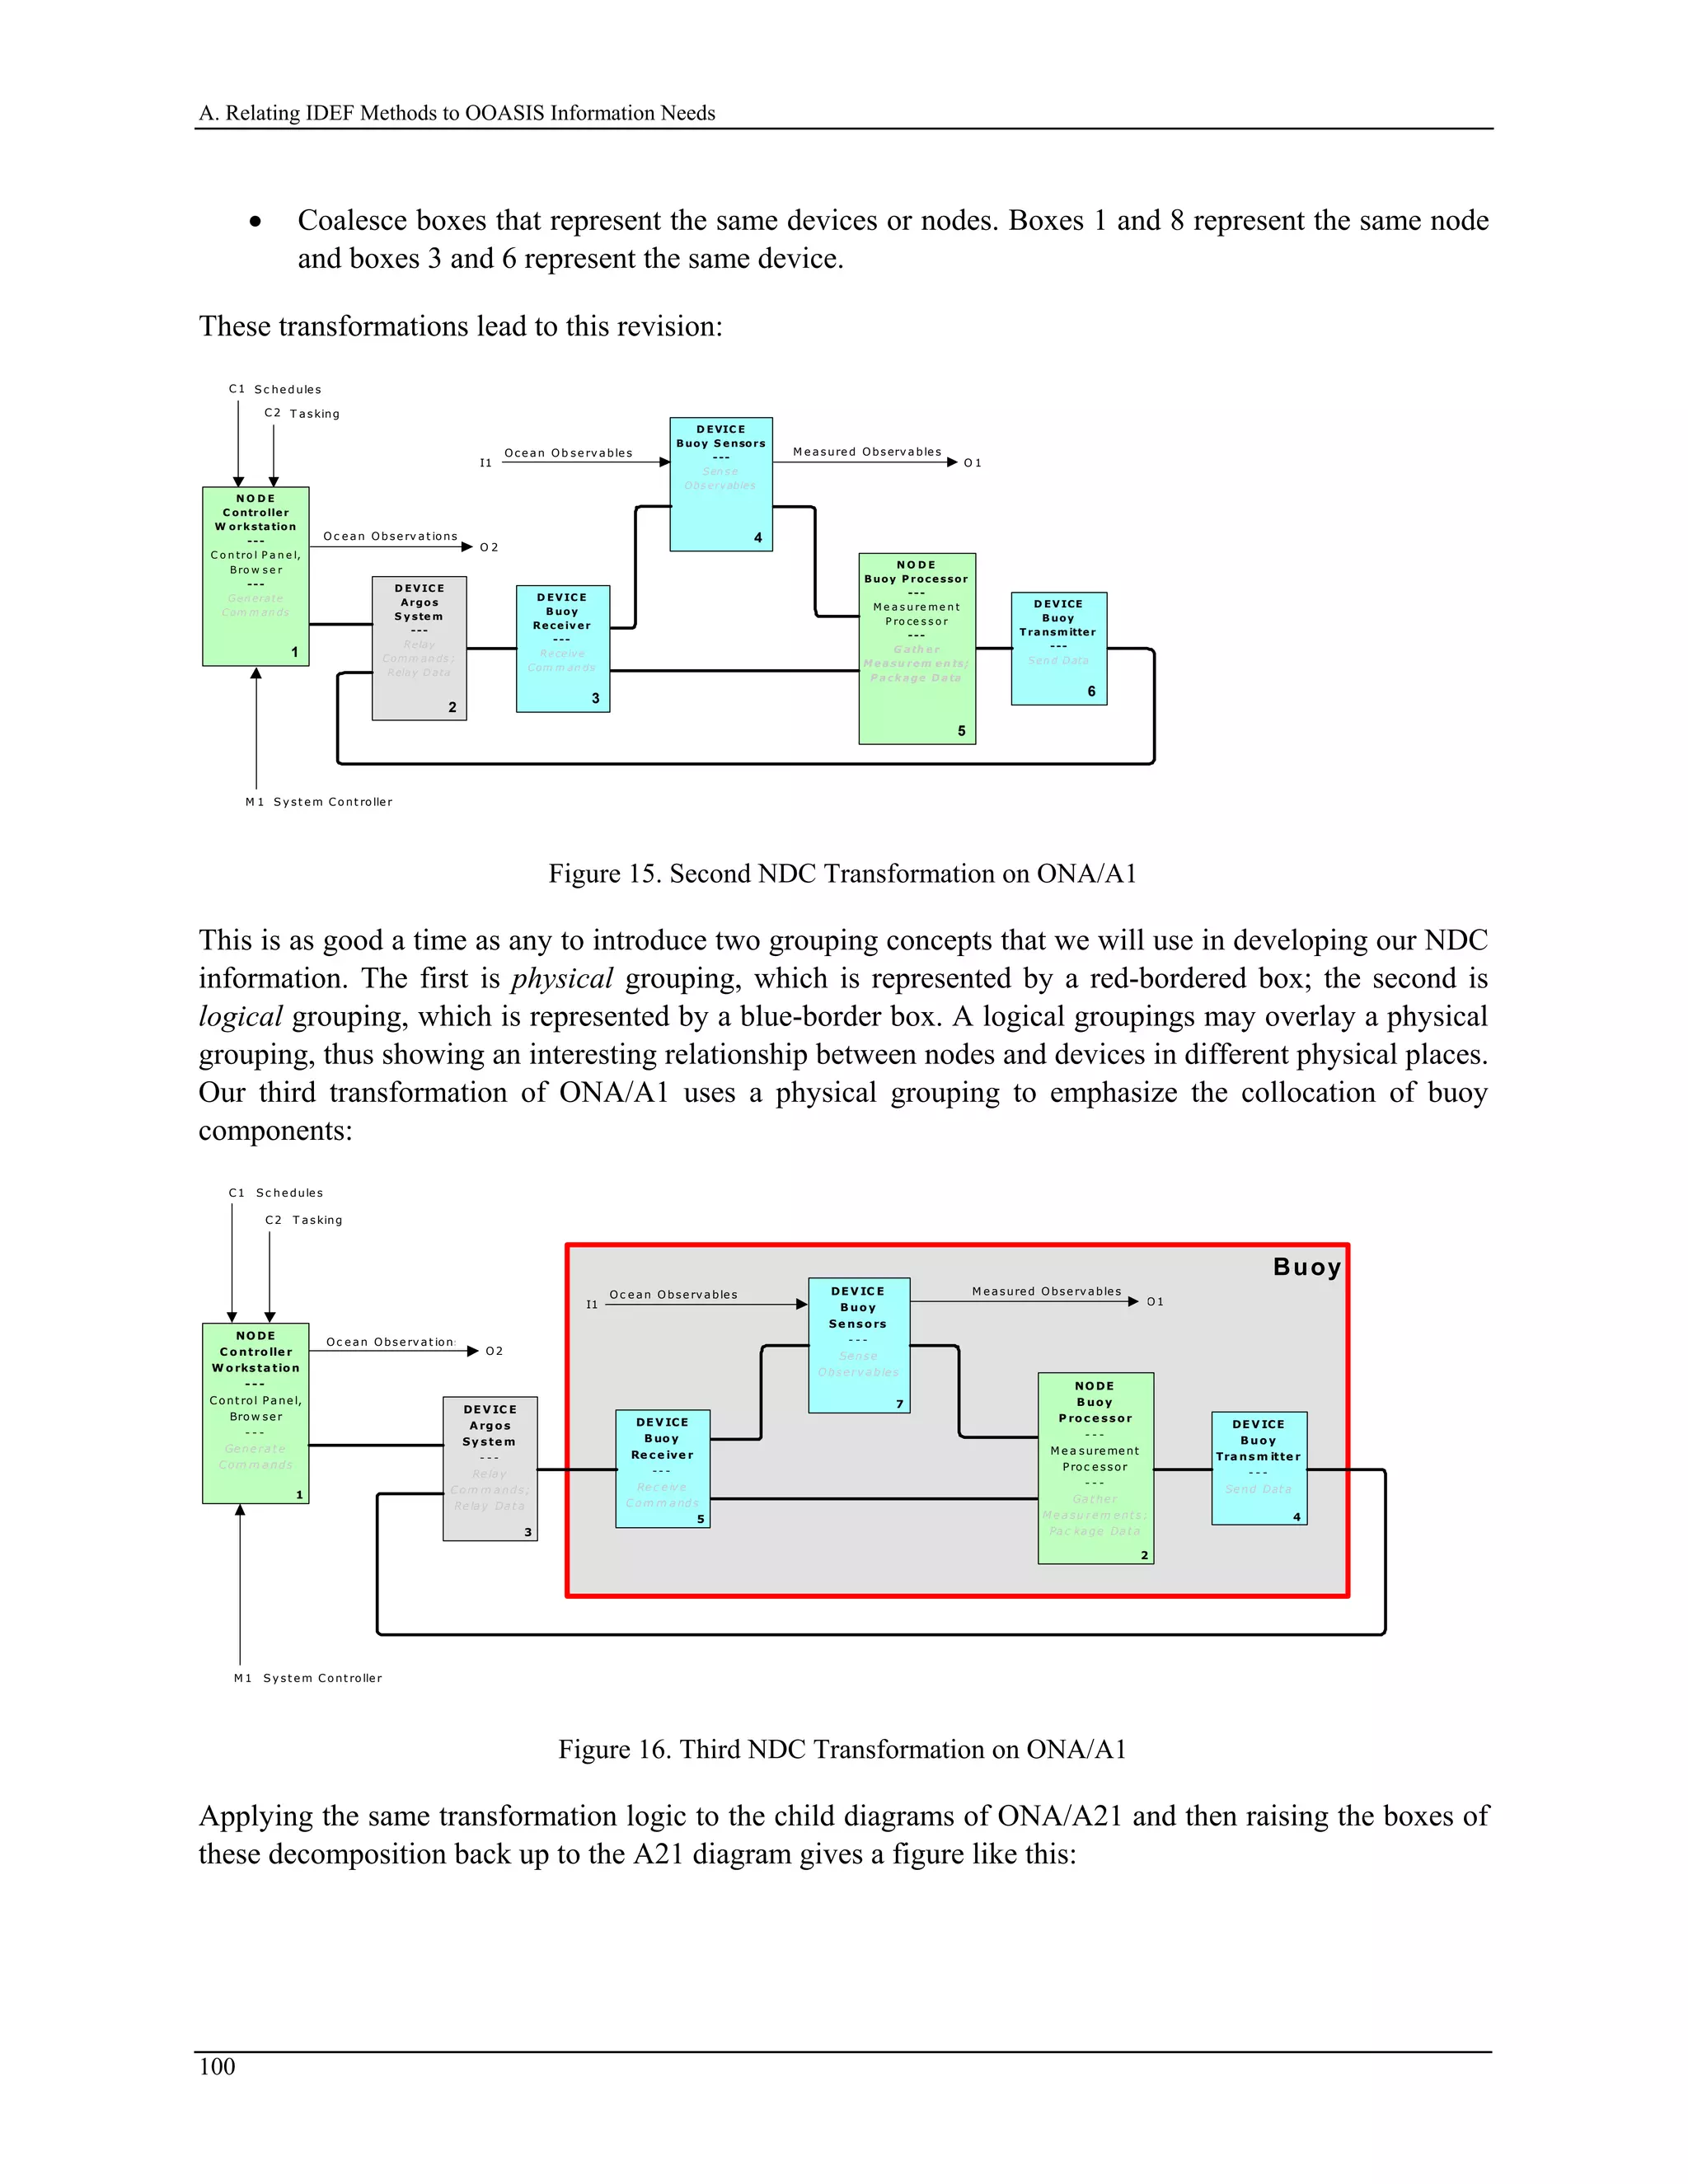
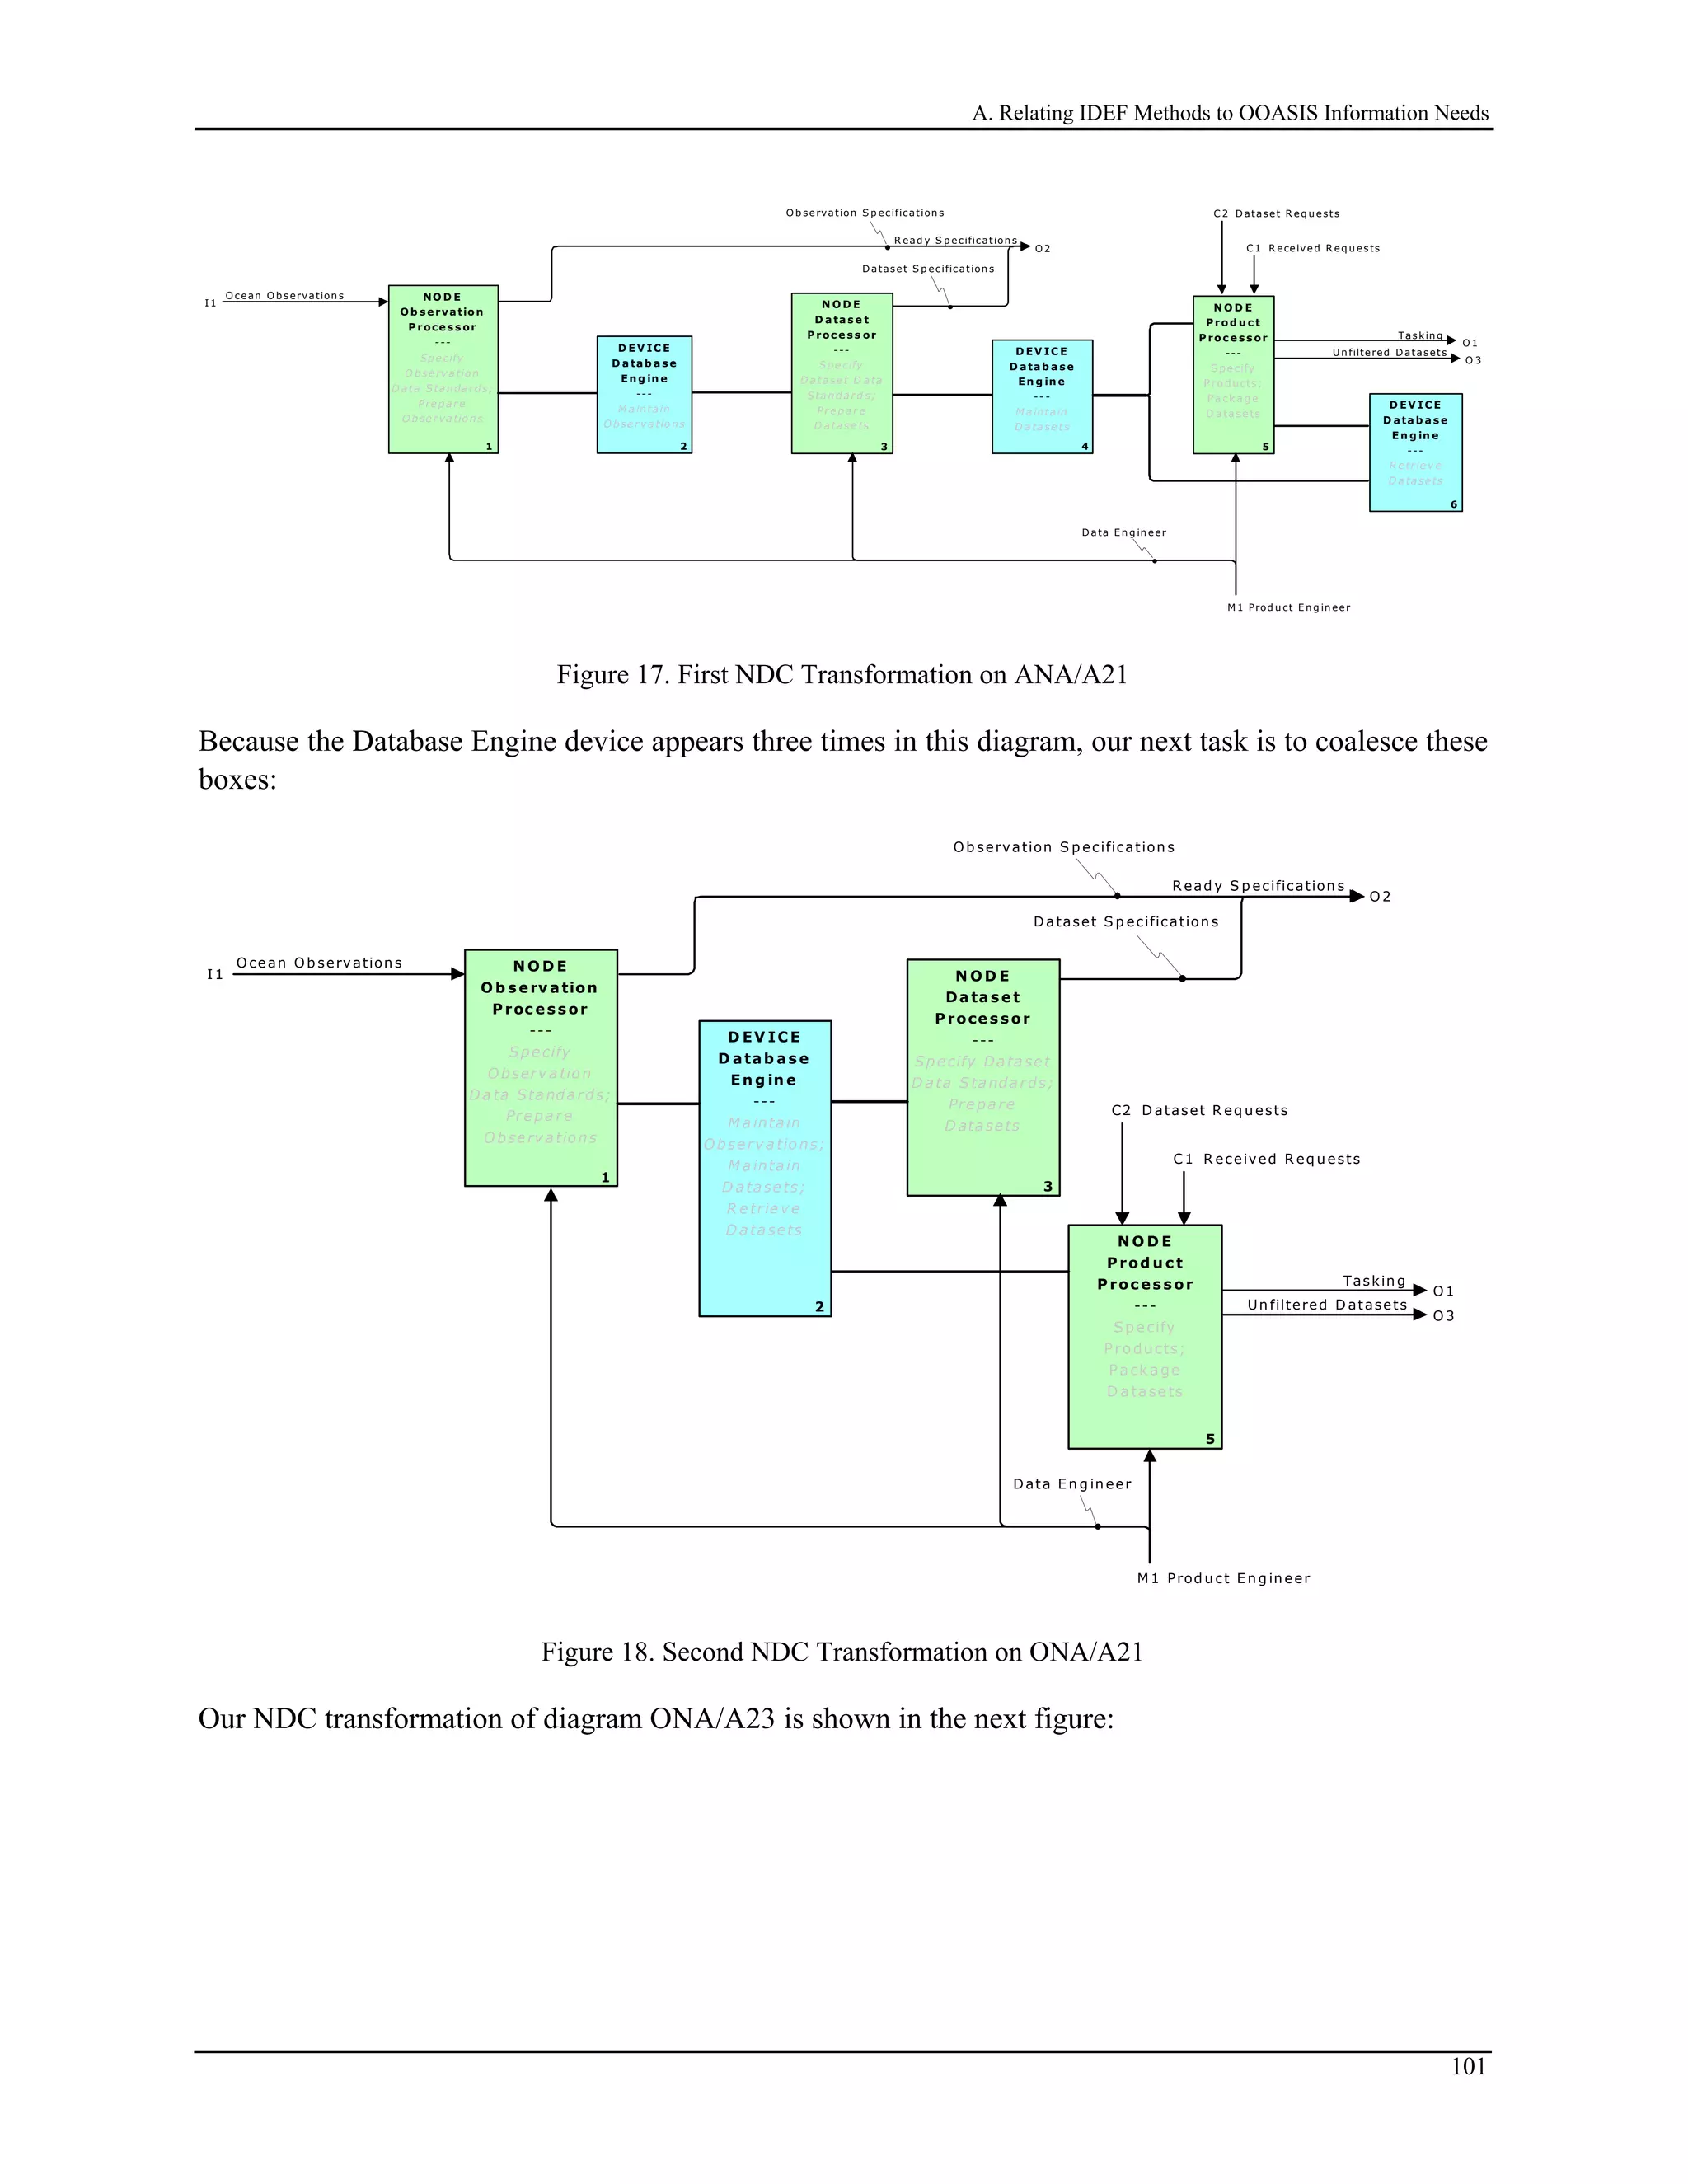
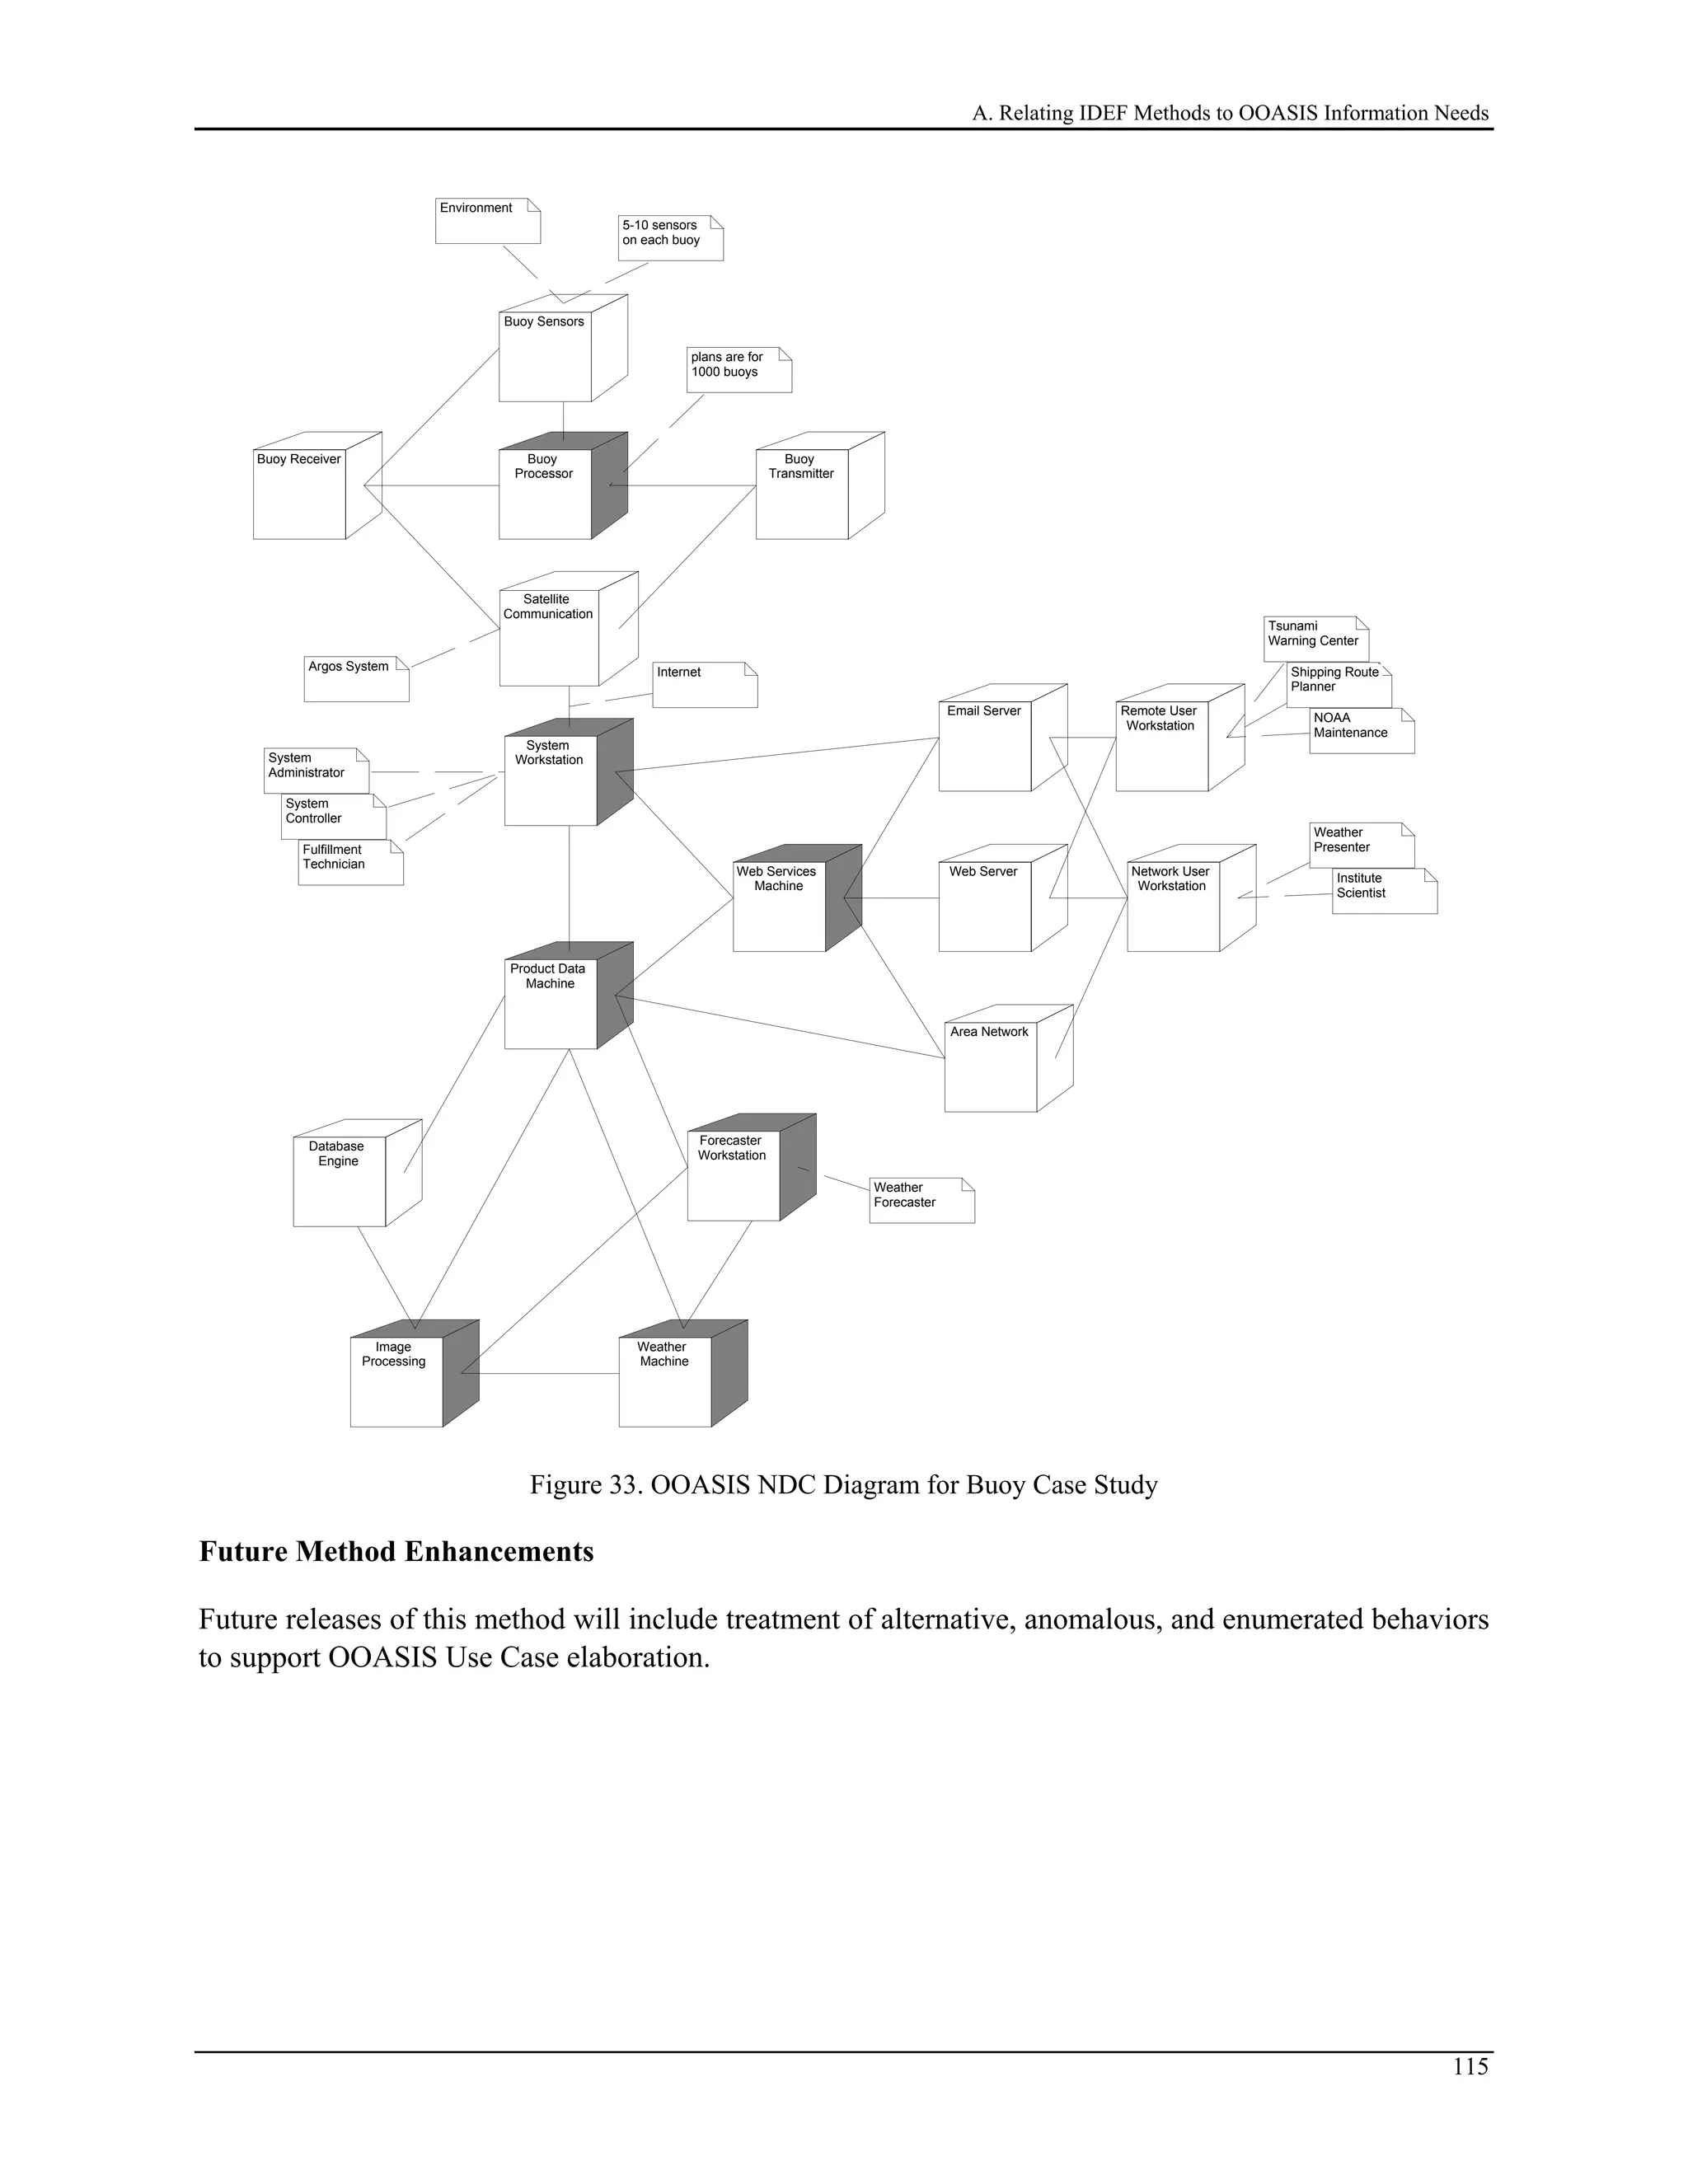
8. Build a family of NDC models. These NDC models partition and coalesce the architecture models to
specify the nodes, devices, and connectors in a way that may be translated directly into NDC diagram
notation. [These models will satisfy OOASIS requirements for NDC diagrams.]
At this point, a consistent set of information and guidance for OOASIS software practitioners should be
available. We turn attention now to exploration of (1) anomalous behaviors, (2) alternative behaviors, and
(3) enumerated behaviors. Consideration of anomalous behaviors will introduce fractal patterns into our
requirements models. Call arrows and submodels will be introduced when we consider alternative
behaviors and enumerated behaviors. The following steps will elaborate the requirements and architecture
models that we have already developed.
9. Enumerated behaviors. Extend each model in the requirements family by considering activities that
represent sets of related but mutually exclusive behaviors. (These may sometimes be inappropriately
represented by a ladder pattern in a decomposition diagram, i.e., no coupling between parallel
activities.) Such enumerated behaviors are to be represented by submodels invoked by a call arrow.
[These extensions will assist the OOASIS analysis of alternate courses and variations for system use
cases.]
10. Alternative behaviors. Extend each model in the requirements family by considering additional ways
of accomplishing the objectives of each activity, i.e., alternative decompositions. These should be
first developed as FEO pages and then migrated to submodels. Such alternative behaviors are to be
represented by submodels invoked by a call arrow. [These extensions will assist the OOASIS analysis
of alternate courses and variations for system use cases.]
11. Anomalous behaviors. Extend each model in the requirements family by considering patterns of
anomaly detection and recovery for each activity. We provide a template of fractal patterns that may
be used to guide this analysis. [These extensions will assist the OOASIS analysis of alternate courses
and variations for system use cases.]
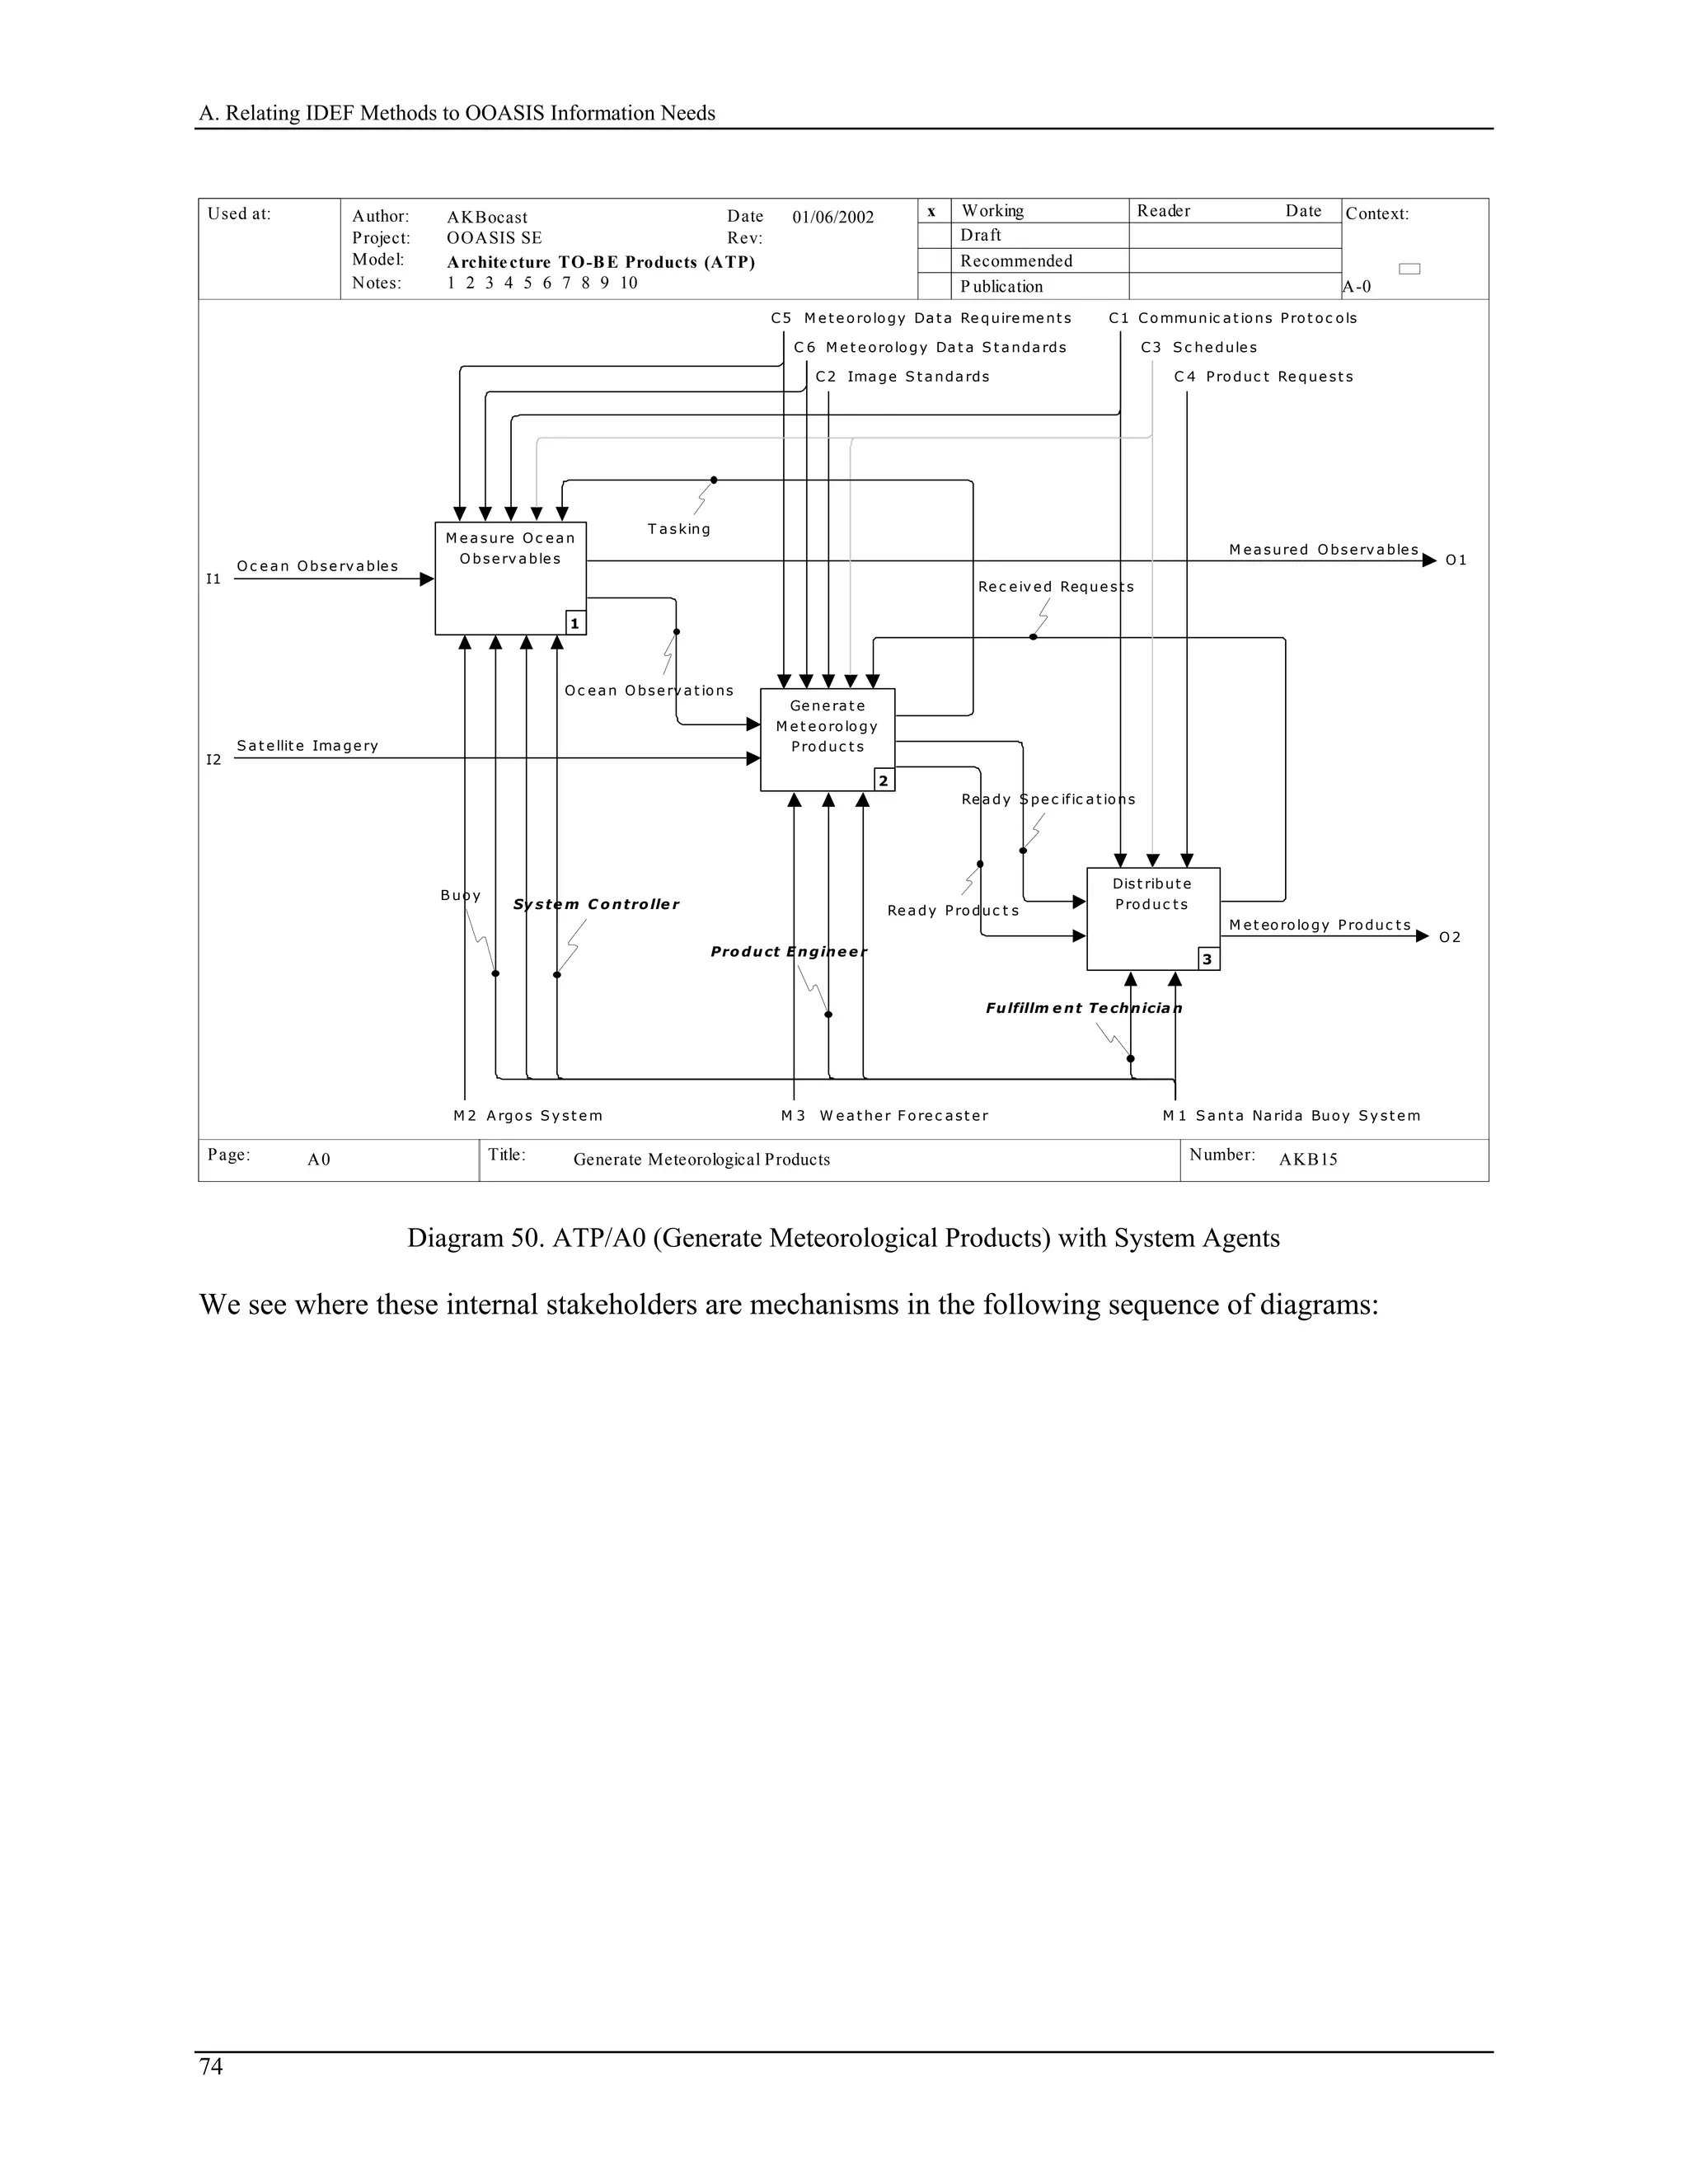
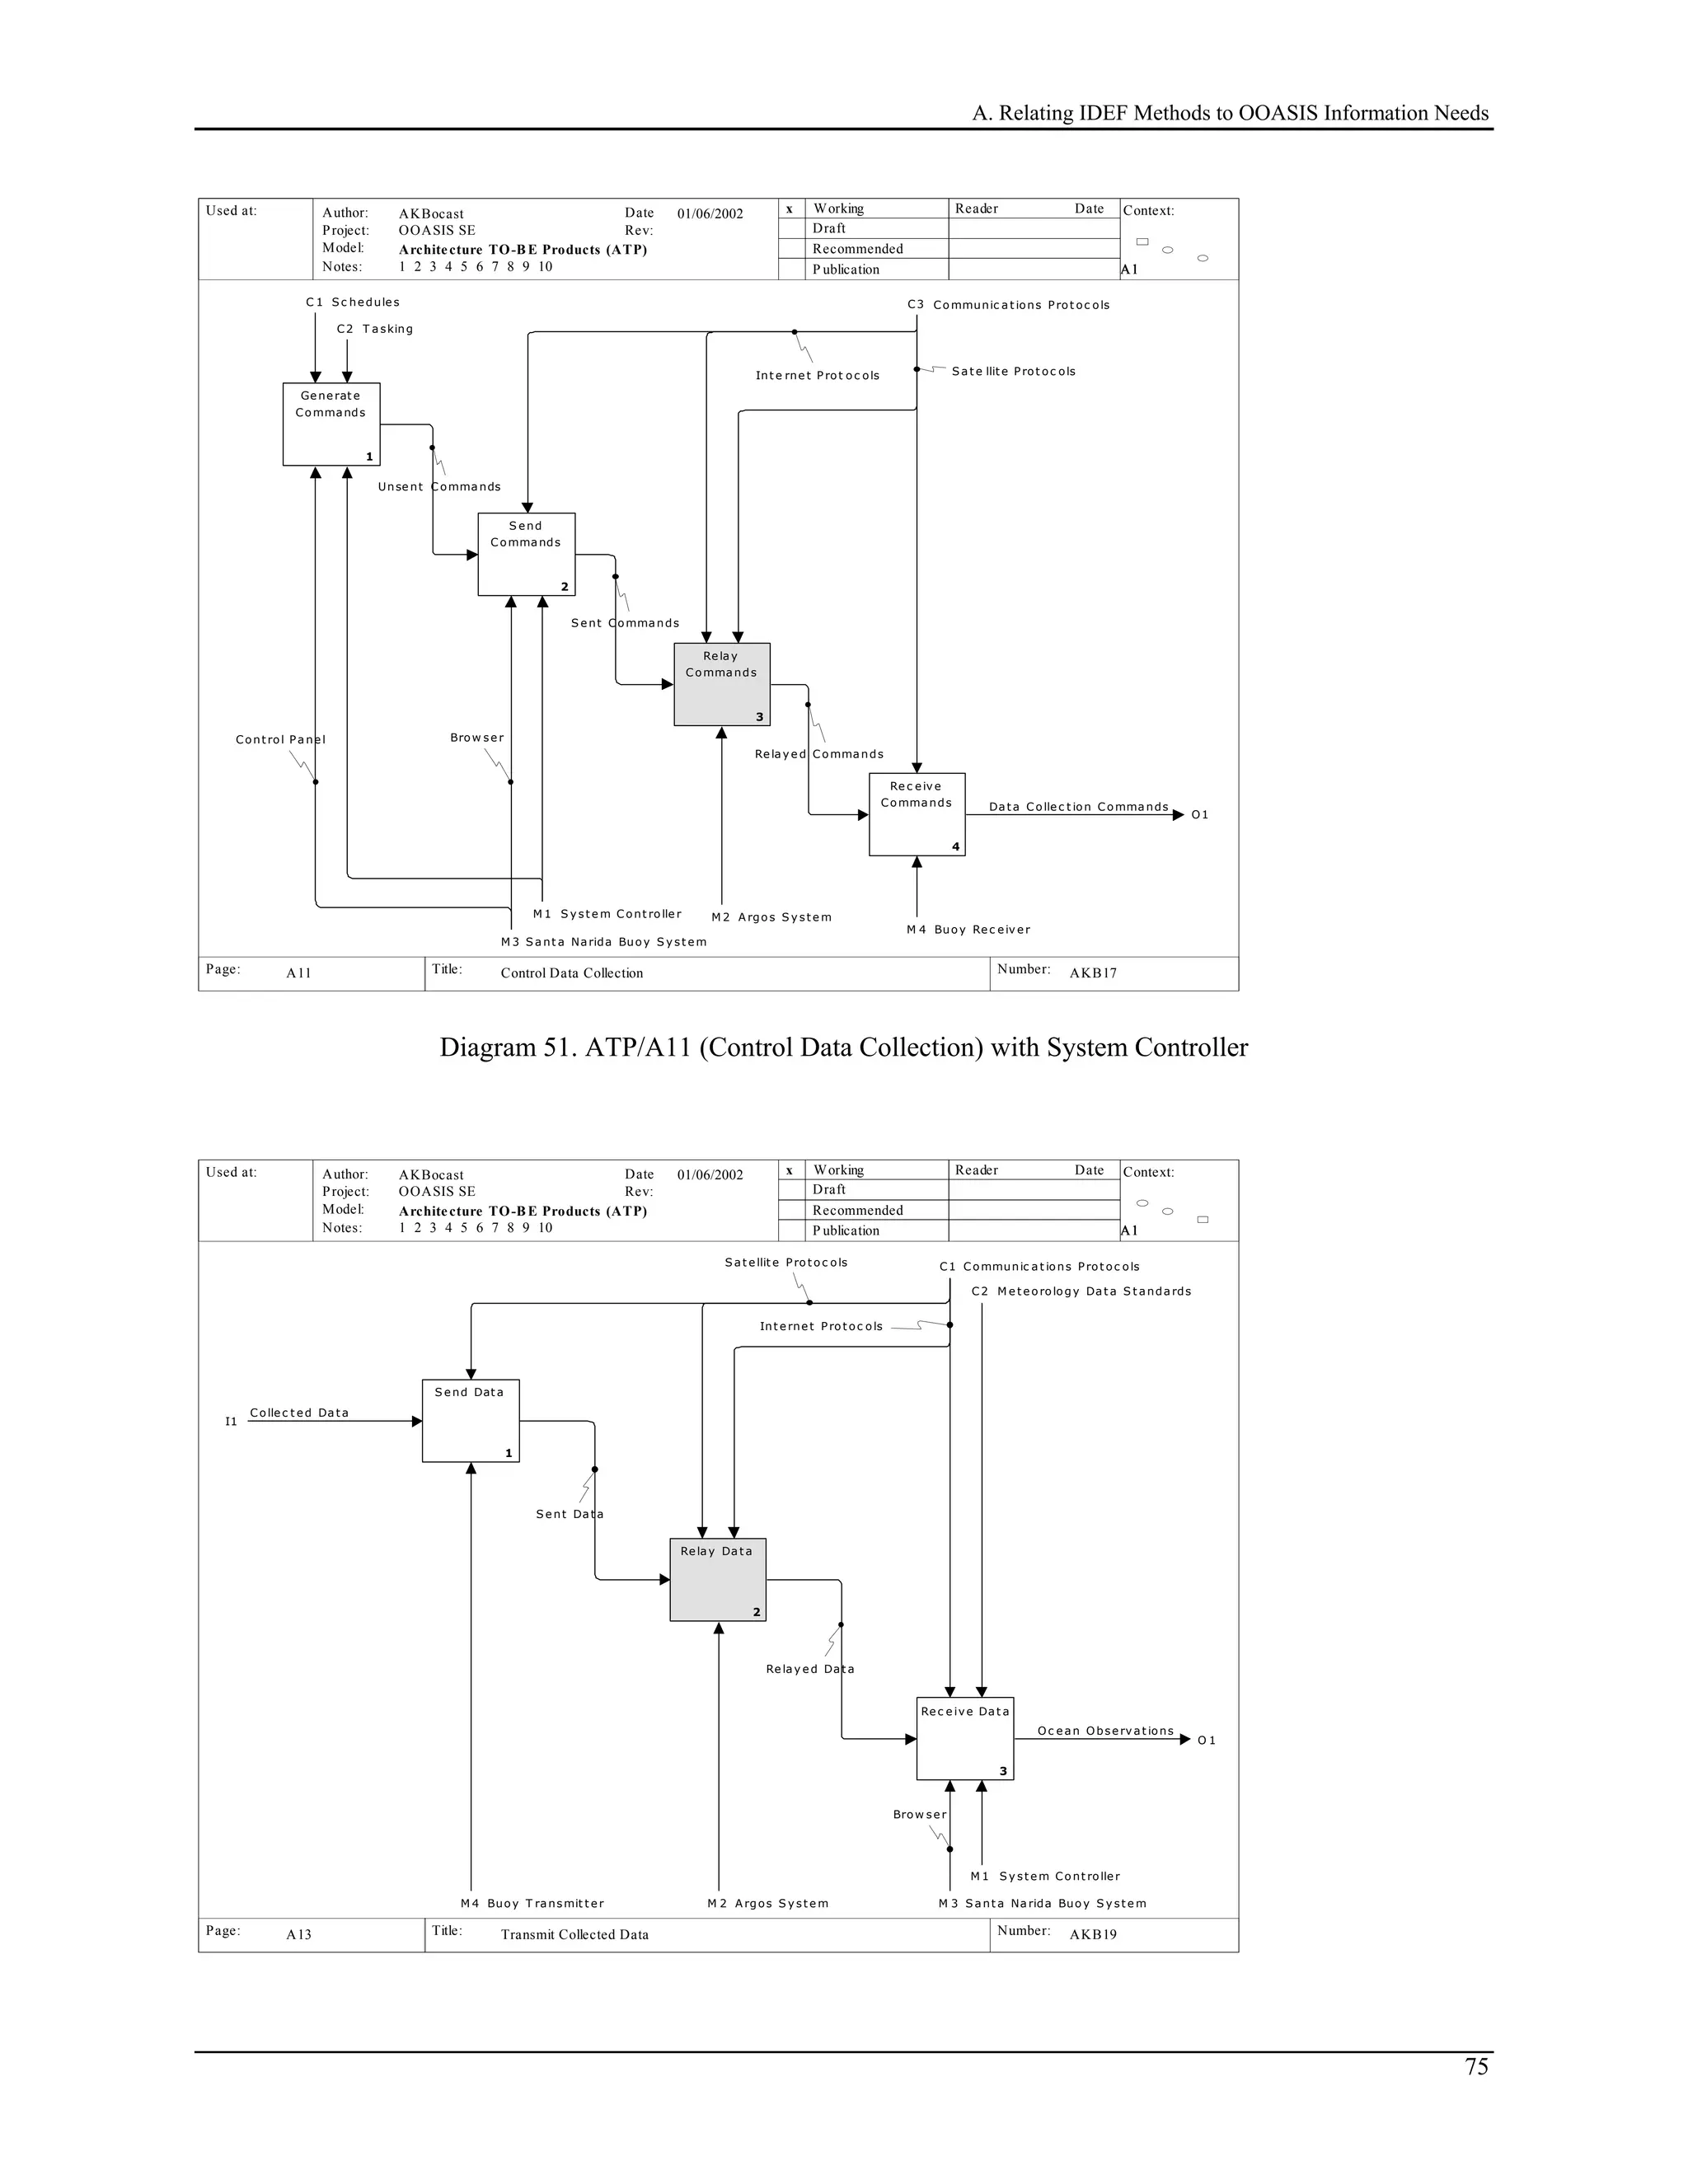
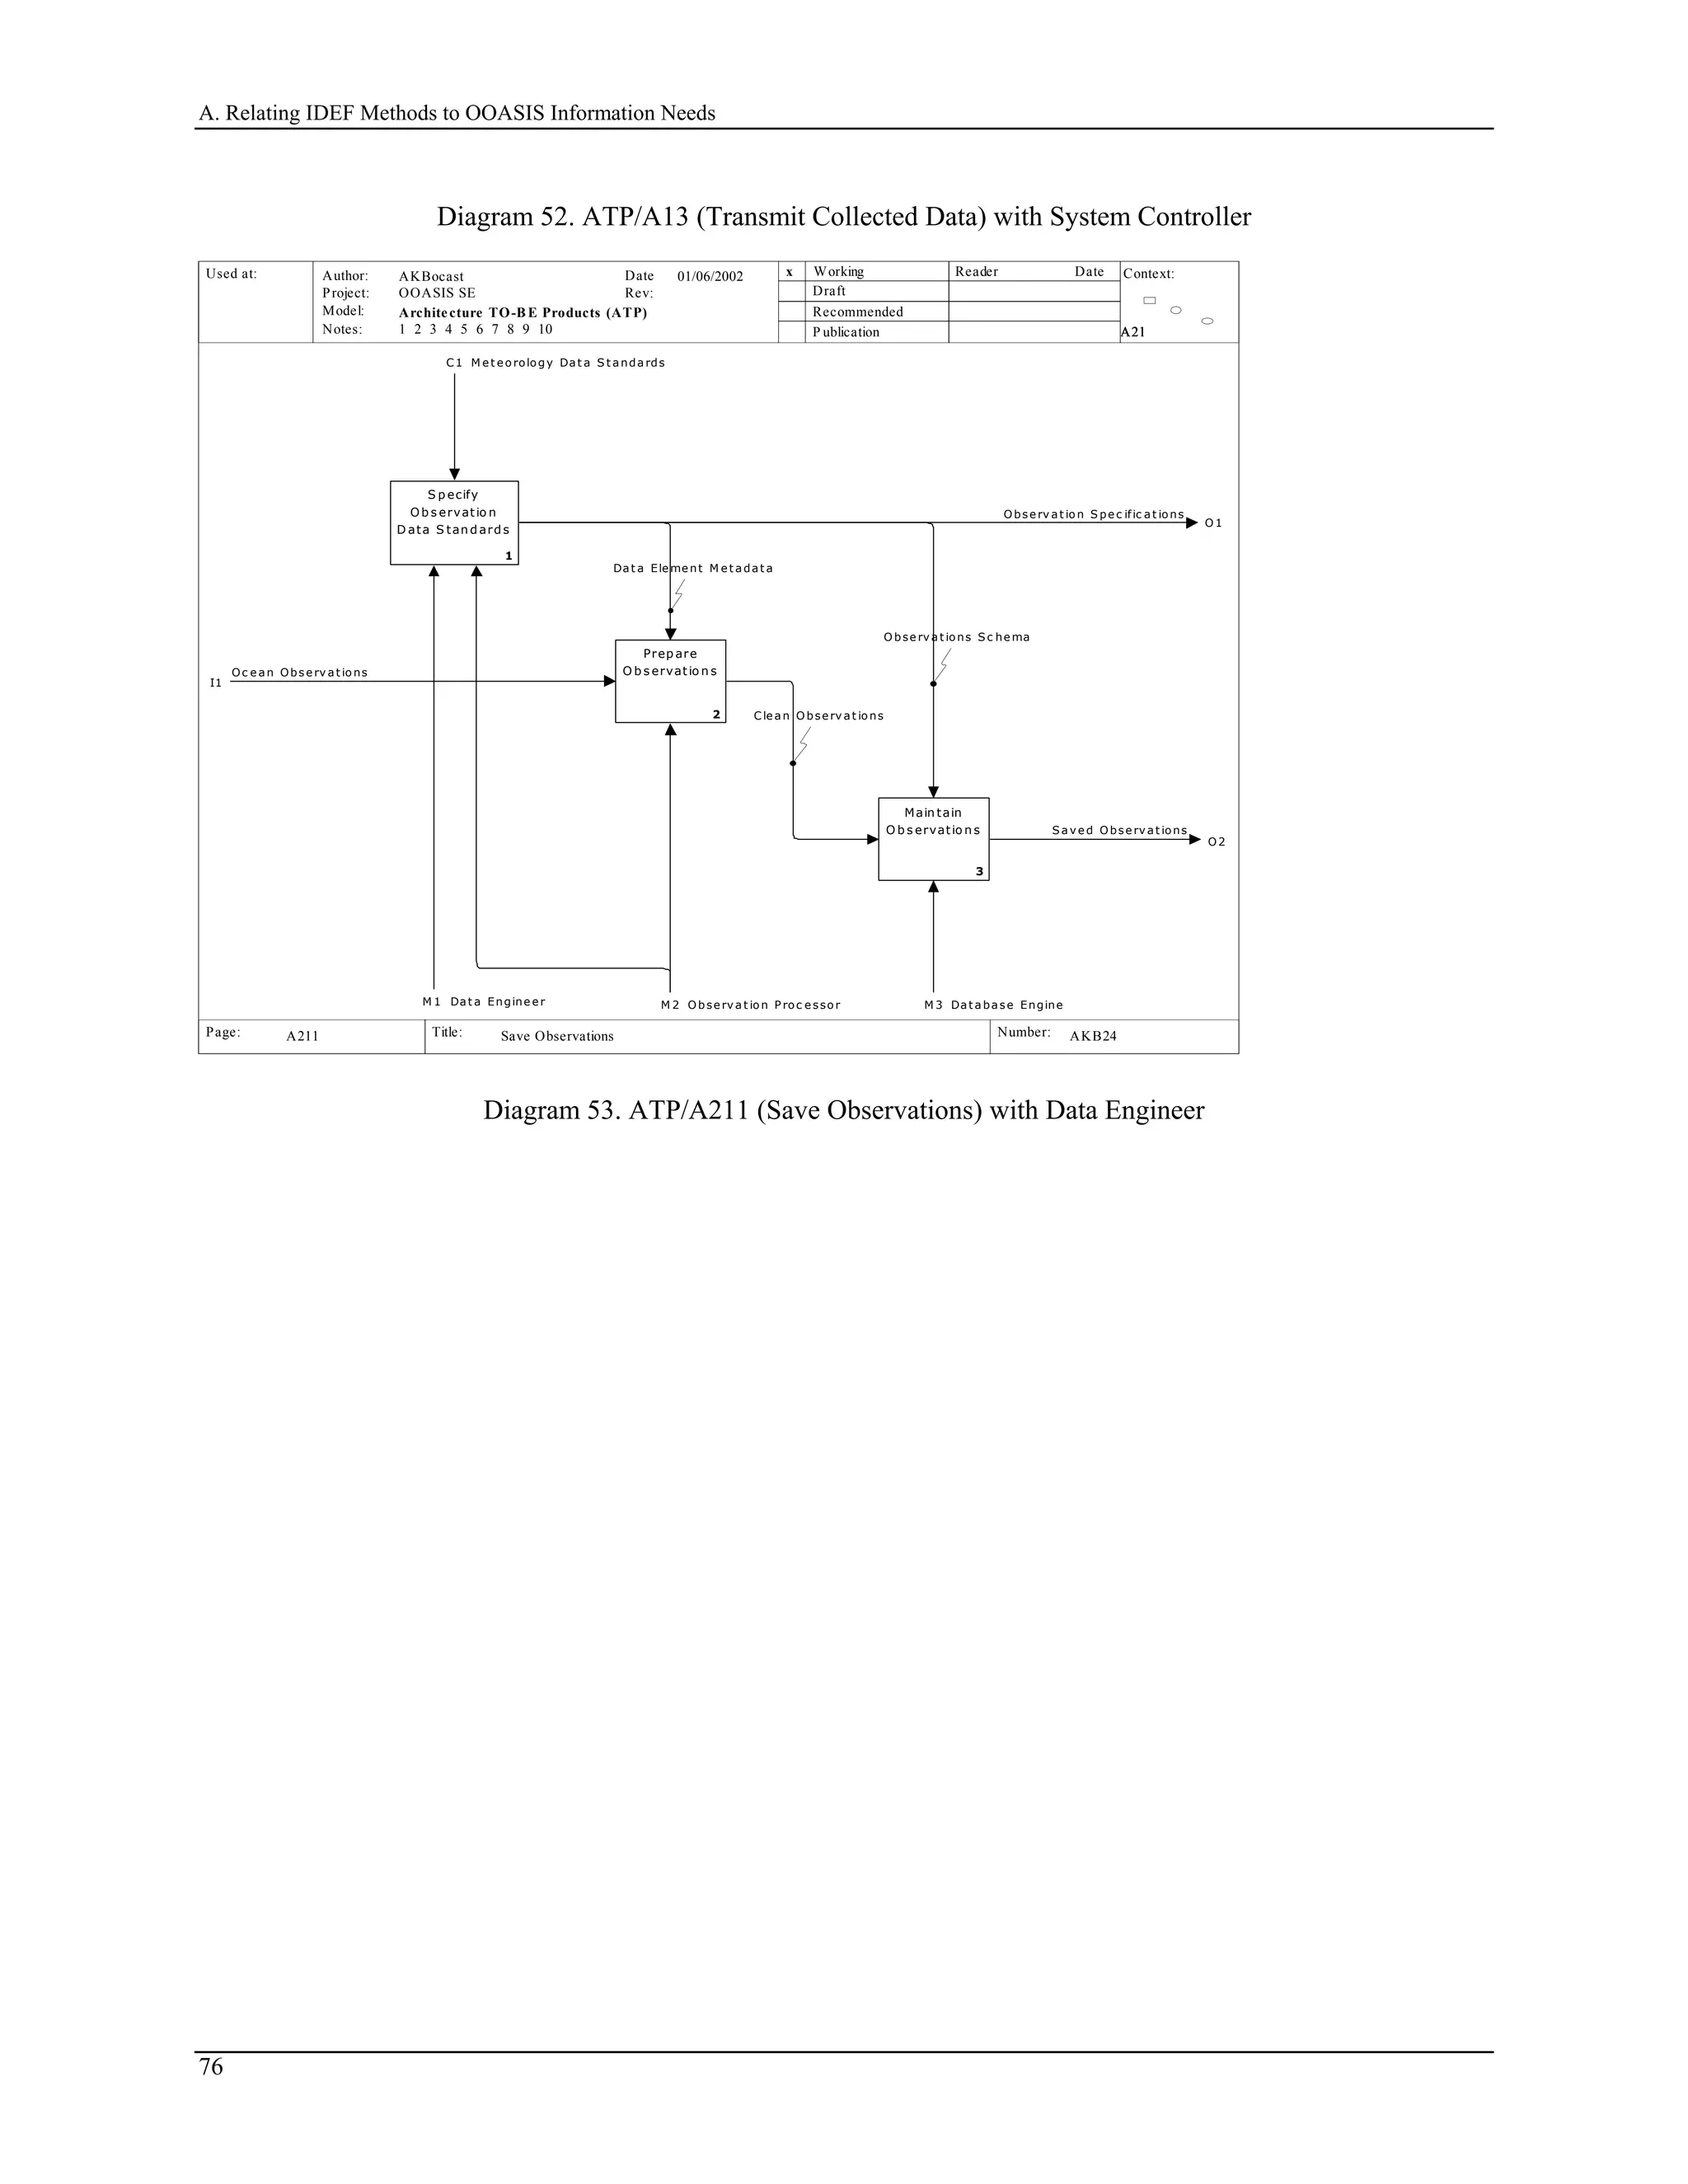
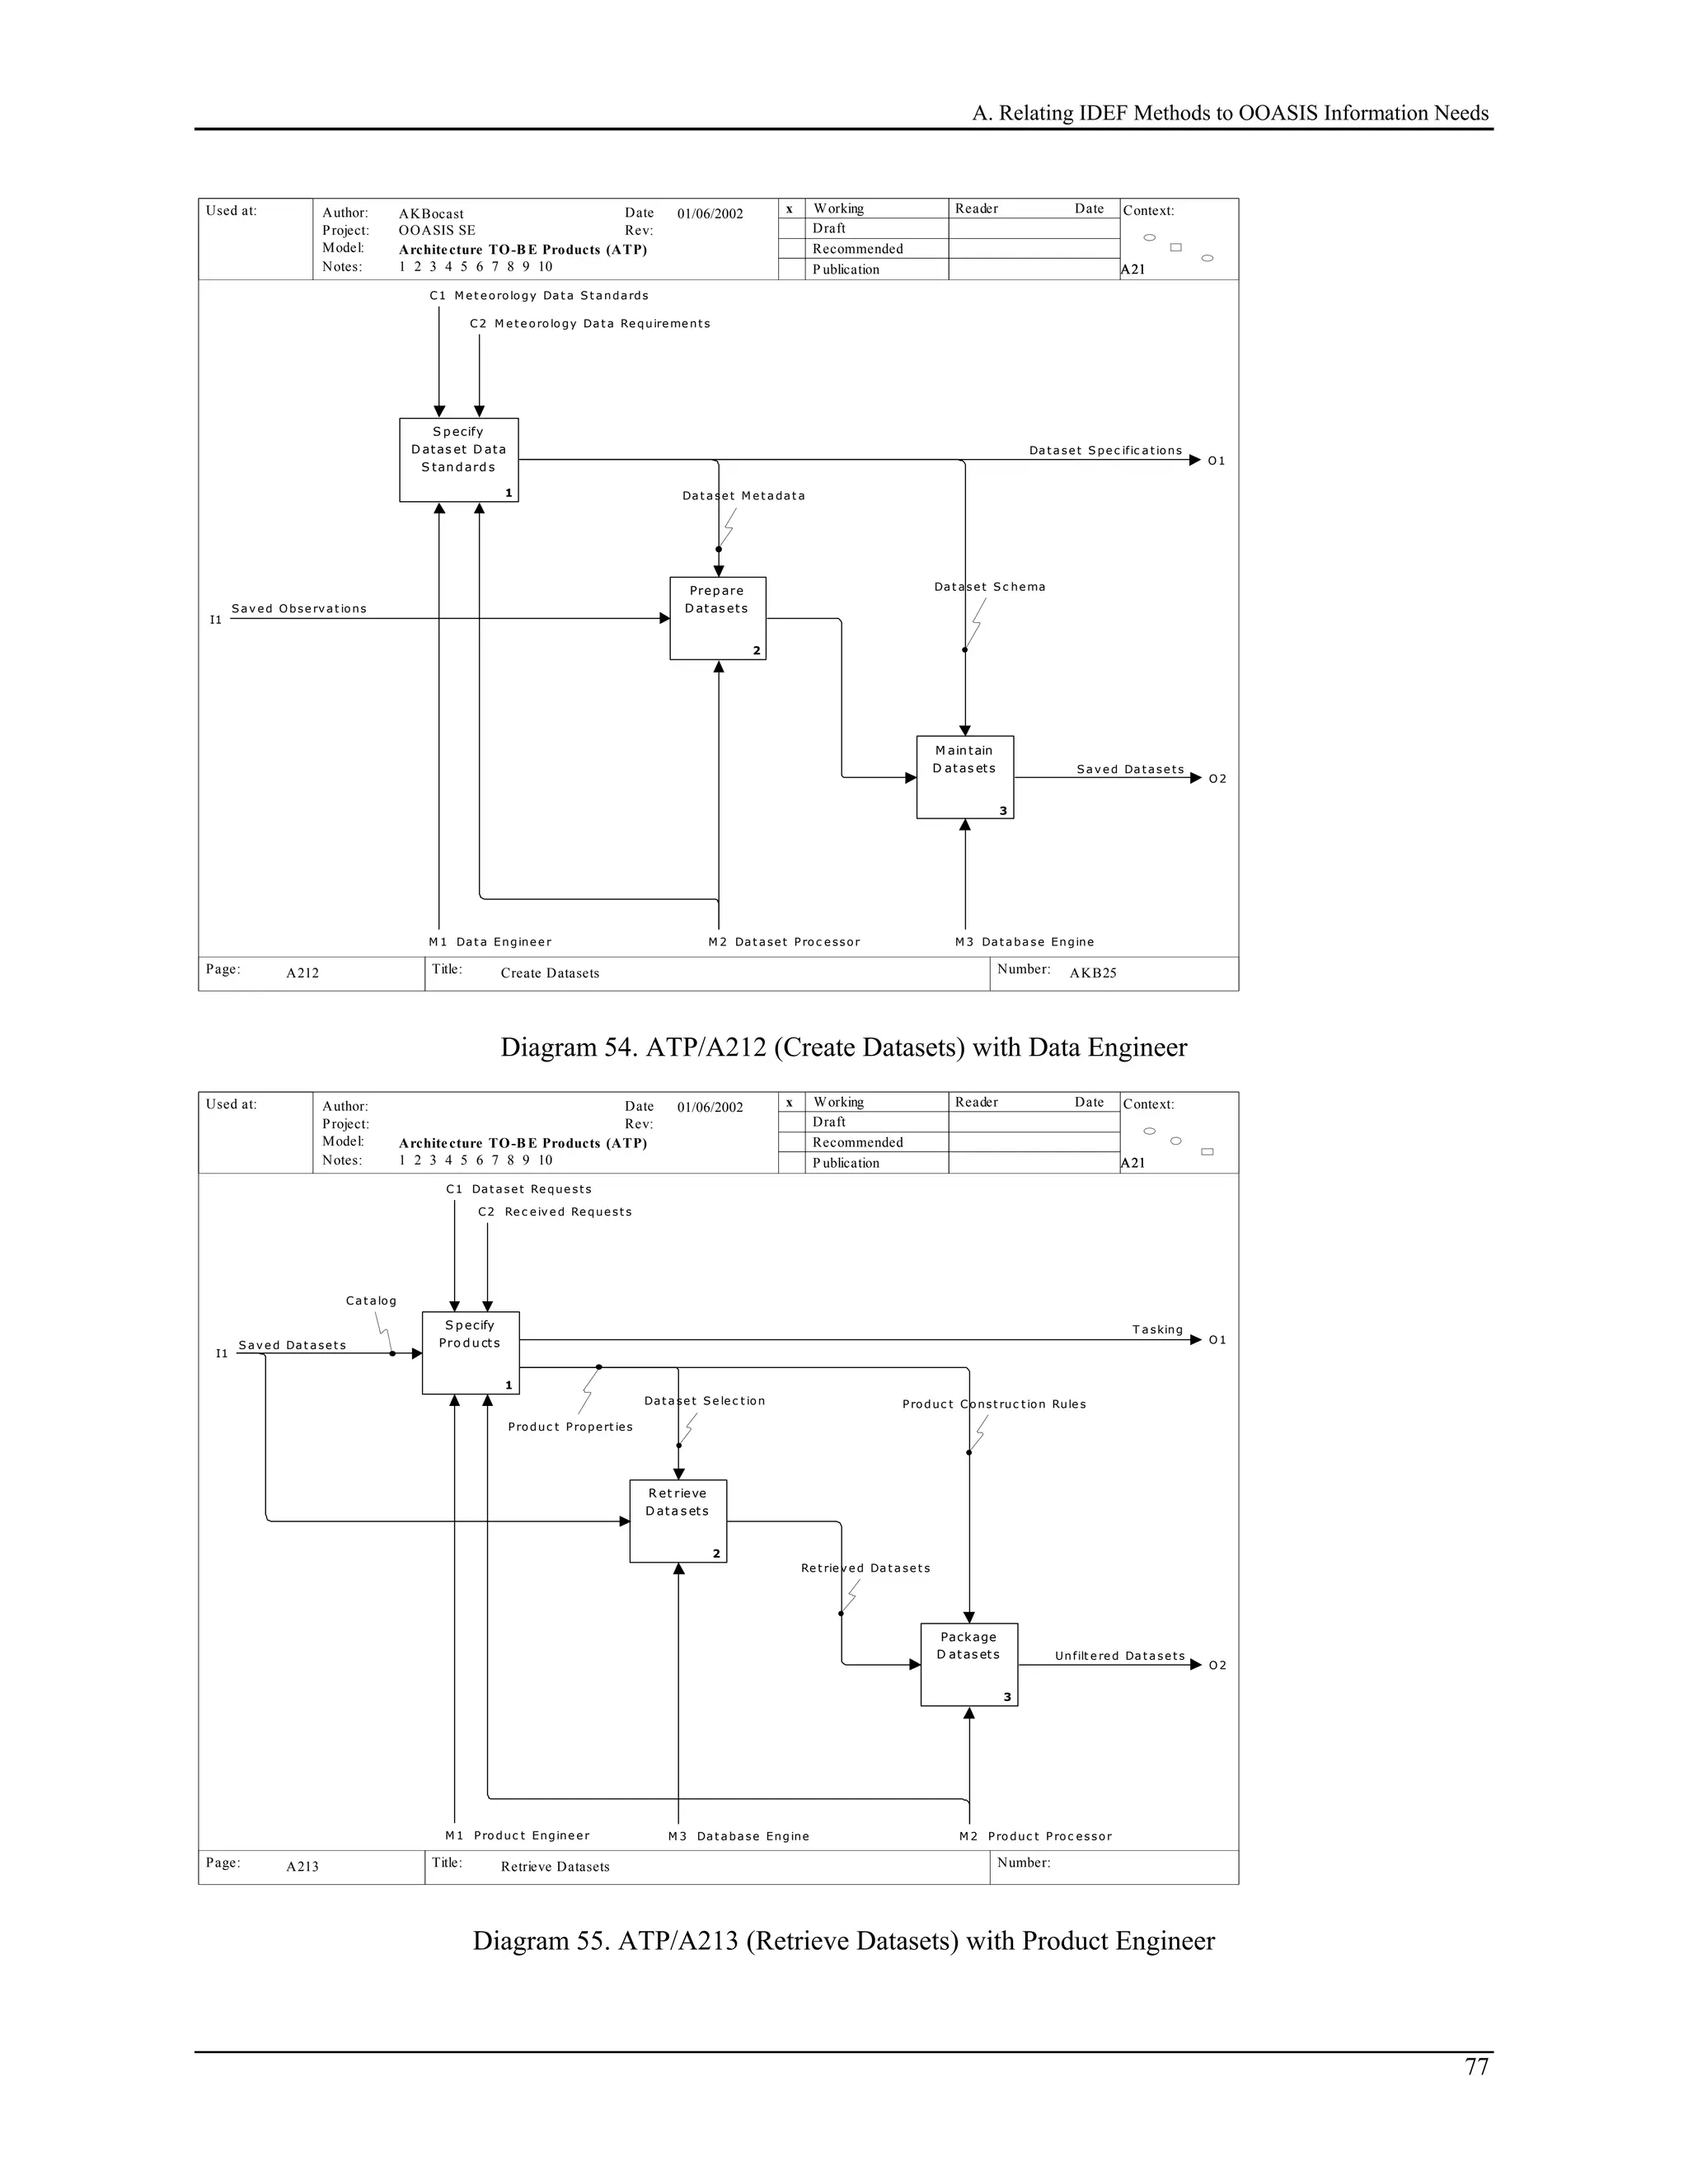
These steps generally refer to a “family of models.” This does not imply that every exercise will
necessarily generate multiple models; a family may have only one model. How large such a family might
be will depend upon the complexity of the prospective system and the intensity of issues to be resolved to
provide adequate requirements and design guidance.
This paper discusses a recommended method for accomplishing Steps 1 though 8. Steps 9 through 11 will
be treated in a subsequent release.
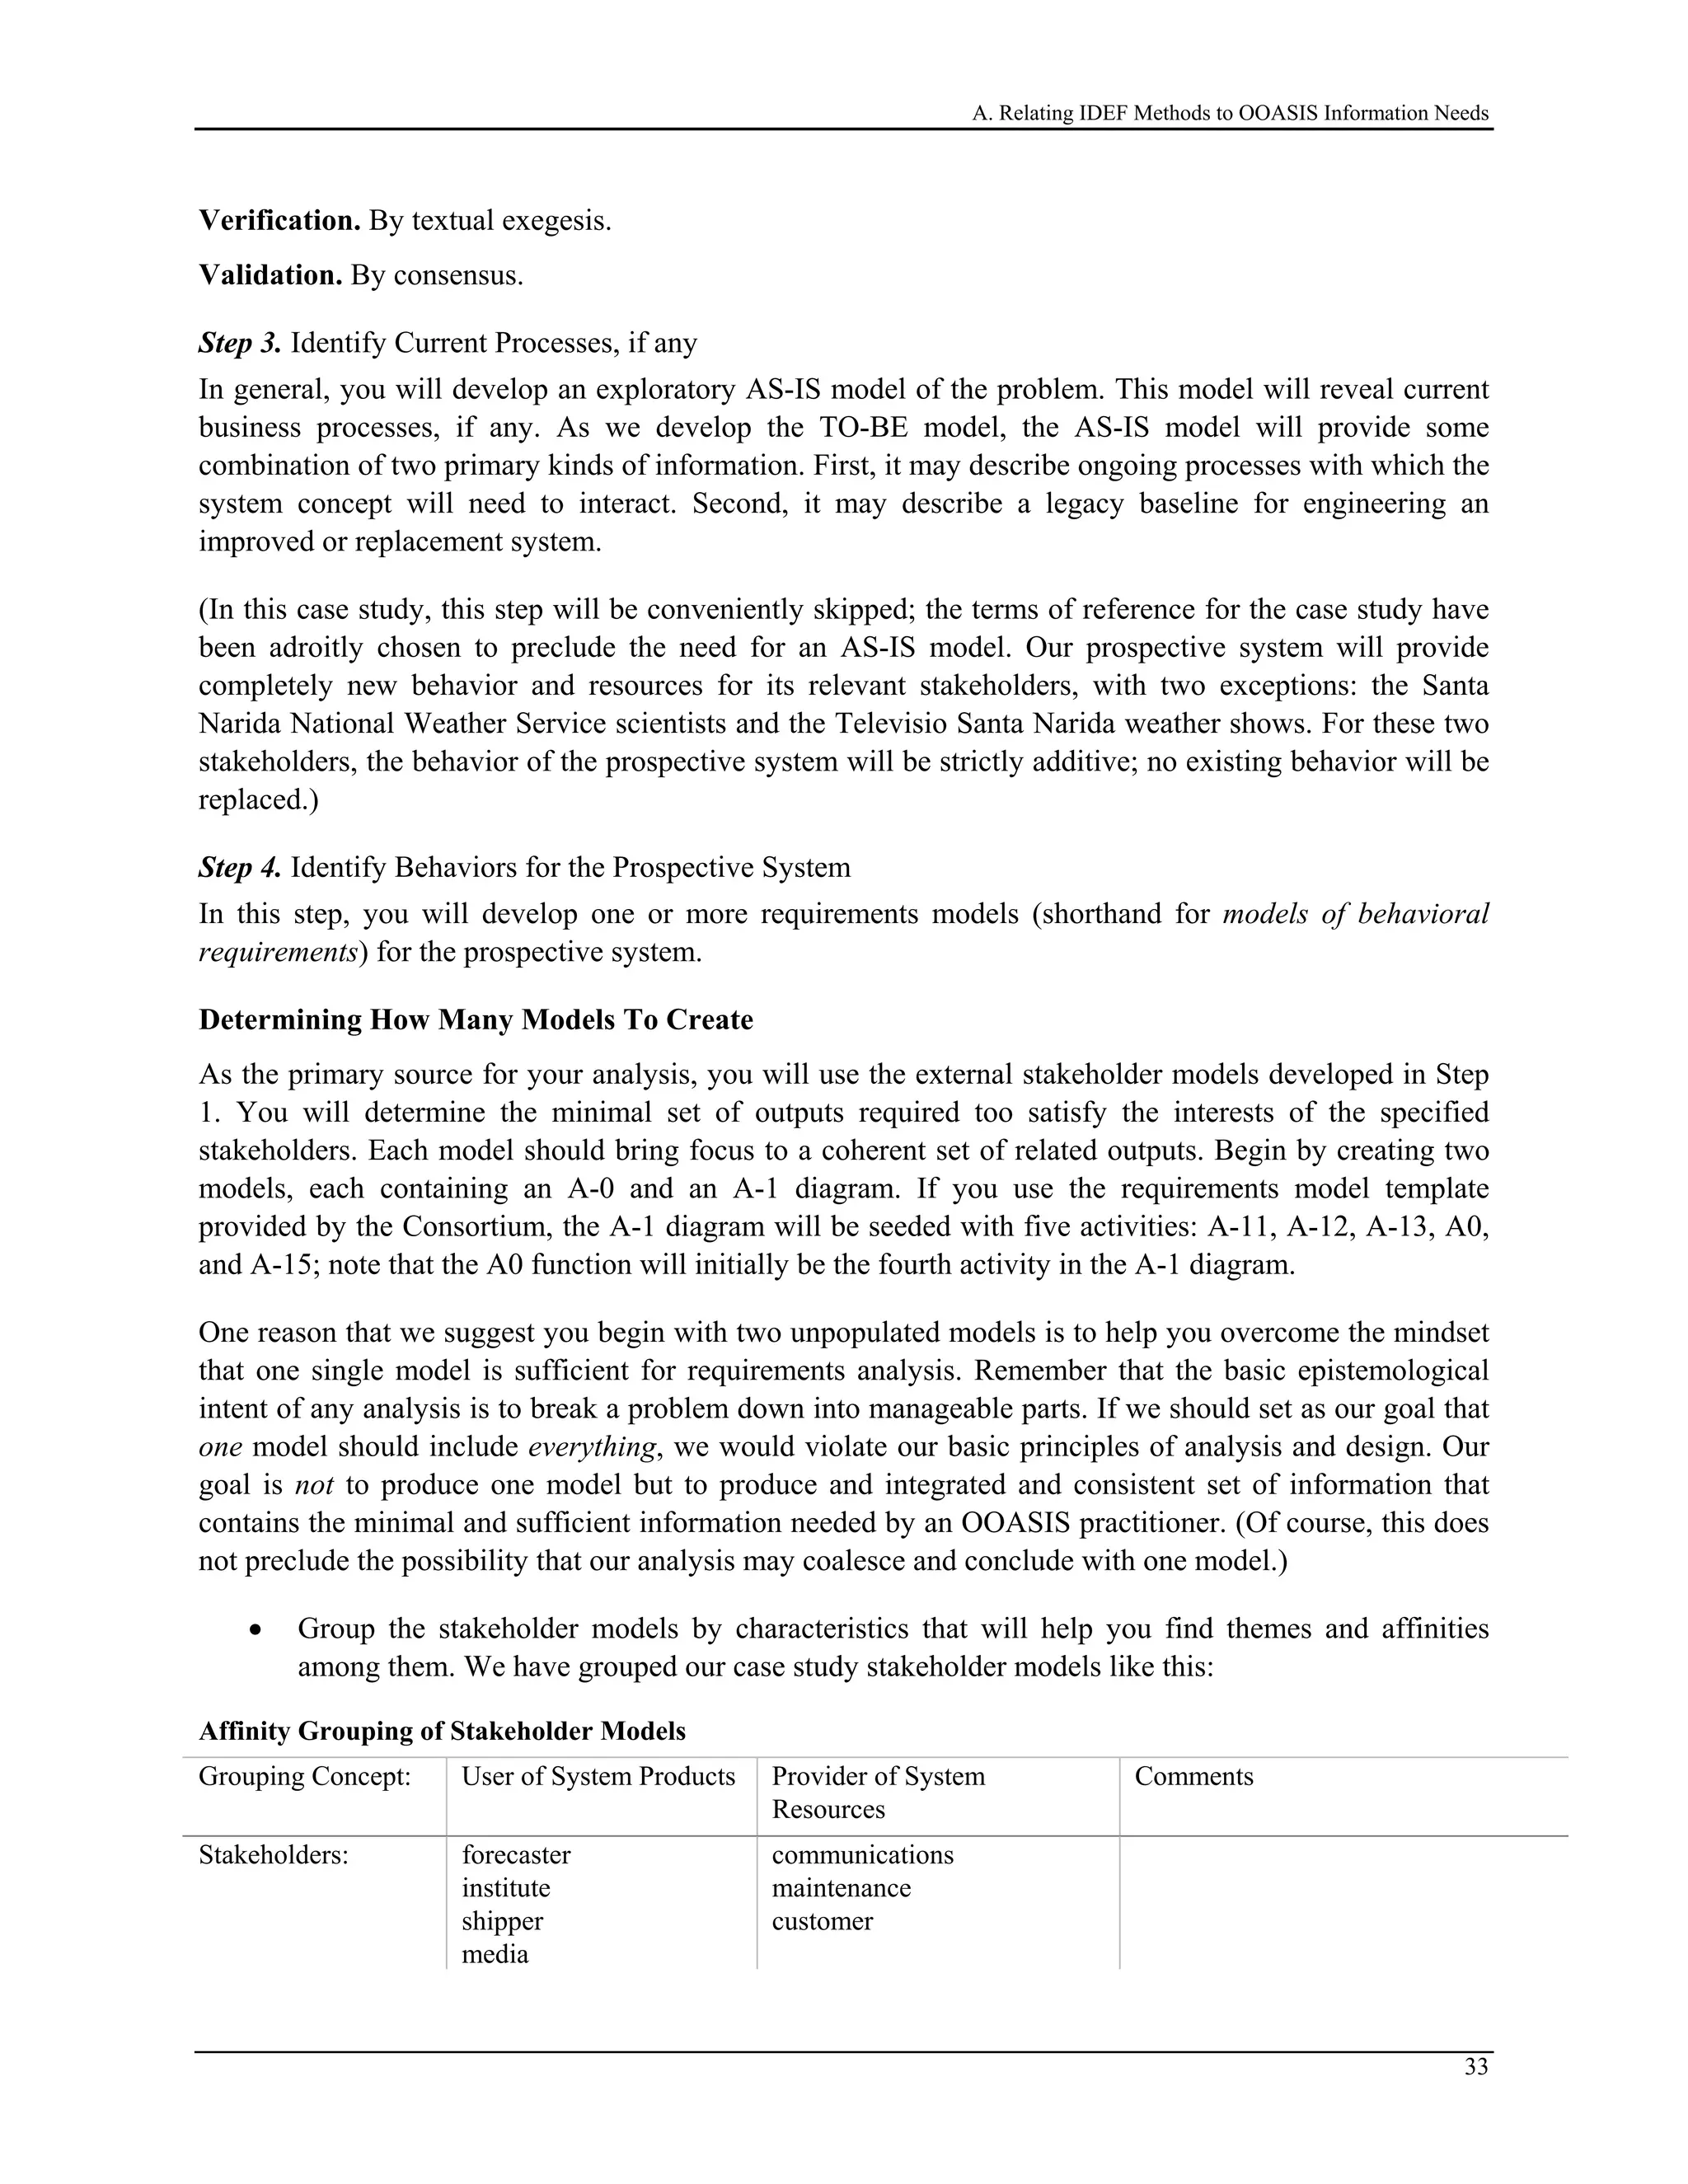
Step 1. Develop a consistent understanding of system need.
• Identify and gather existing source fragments that state various aspects of the stakeholders’
problems. As in the real world, fragments of useful information are in different places. For this
case study, one set of fragments comes from the OOASIS website, another from the OOASIS
course, and the final set is the Santa Narida backstory. The OOASIS website and OOASIS course
material have been slightly edited to ensure that they are consistent with the Santa Narida
backstory. The OOASIS website teaches:
25](https://image.slidesharecdn.com/armstrongbocastintegrationofsystemsengineeringandsoftwaredevelopment2003-libre-150404105226-conversion-gate01/75/Armstrong-bocast-integration_of_systems_engineering_and_software_development_2003-libre-41-2048.jpg)