This document summarizes two scientific research projects:
1. Project 1 analyzes daily ozone concentration data in Tampa-St.Petersburg region using non-parametric statistical techniques like ANOVA due to non-normally distributed data. It finds significant variation among days with some day pairs like Saturday differing from others.
2. Project 2 investigates gas-phase oxidation products of isoprene under varying conditions like NOx levels. It identifies key products like methacrolein and methyl vinyl ketone and observes greater MVK formation with NOx. Challenges in fully understanding peroxy radical and secondary reactions are also noted.
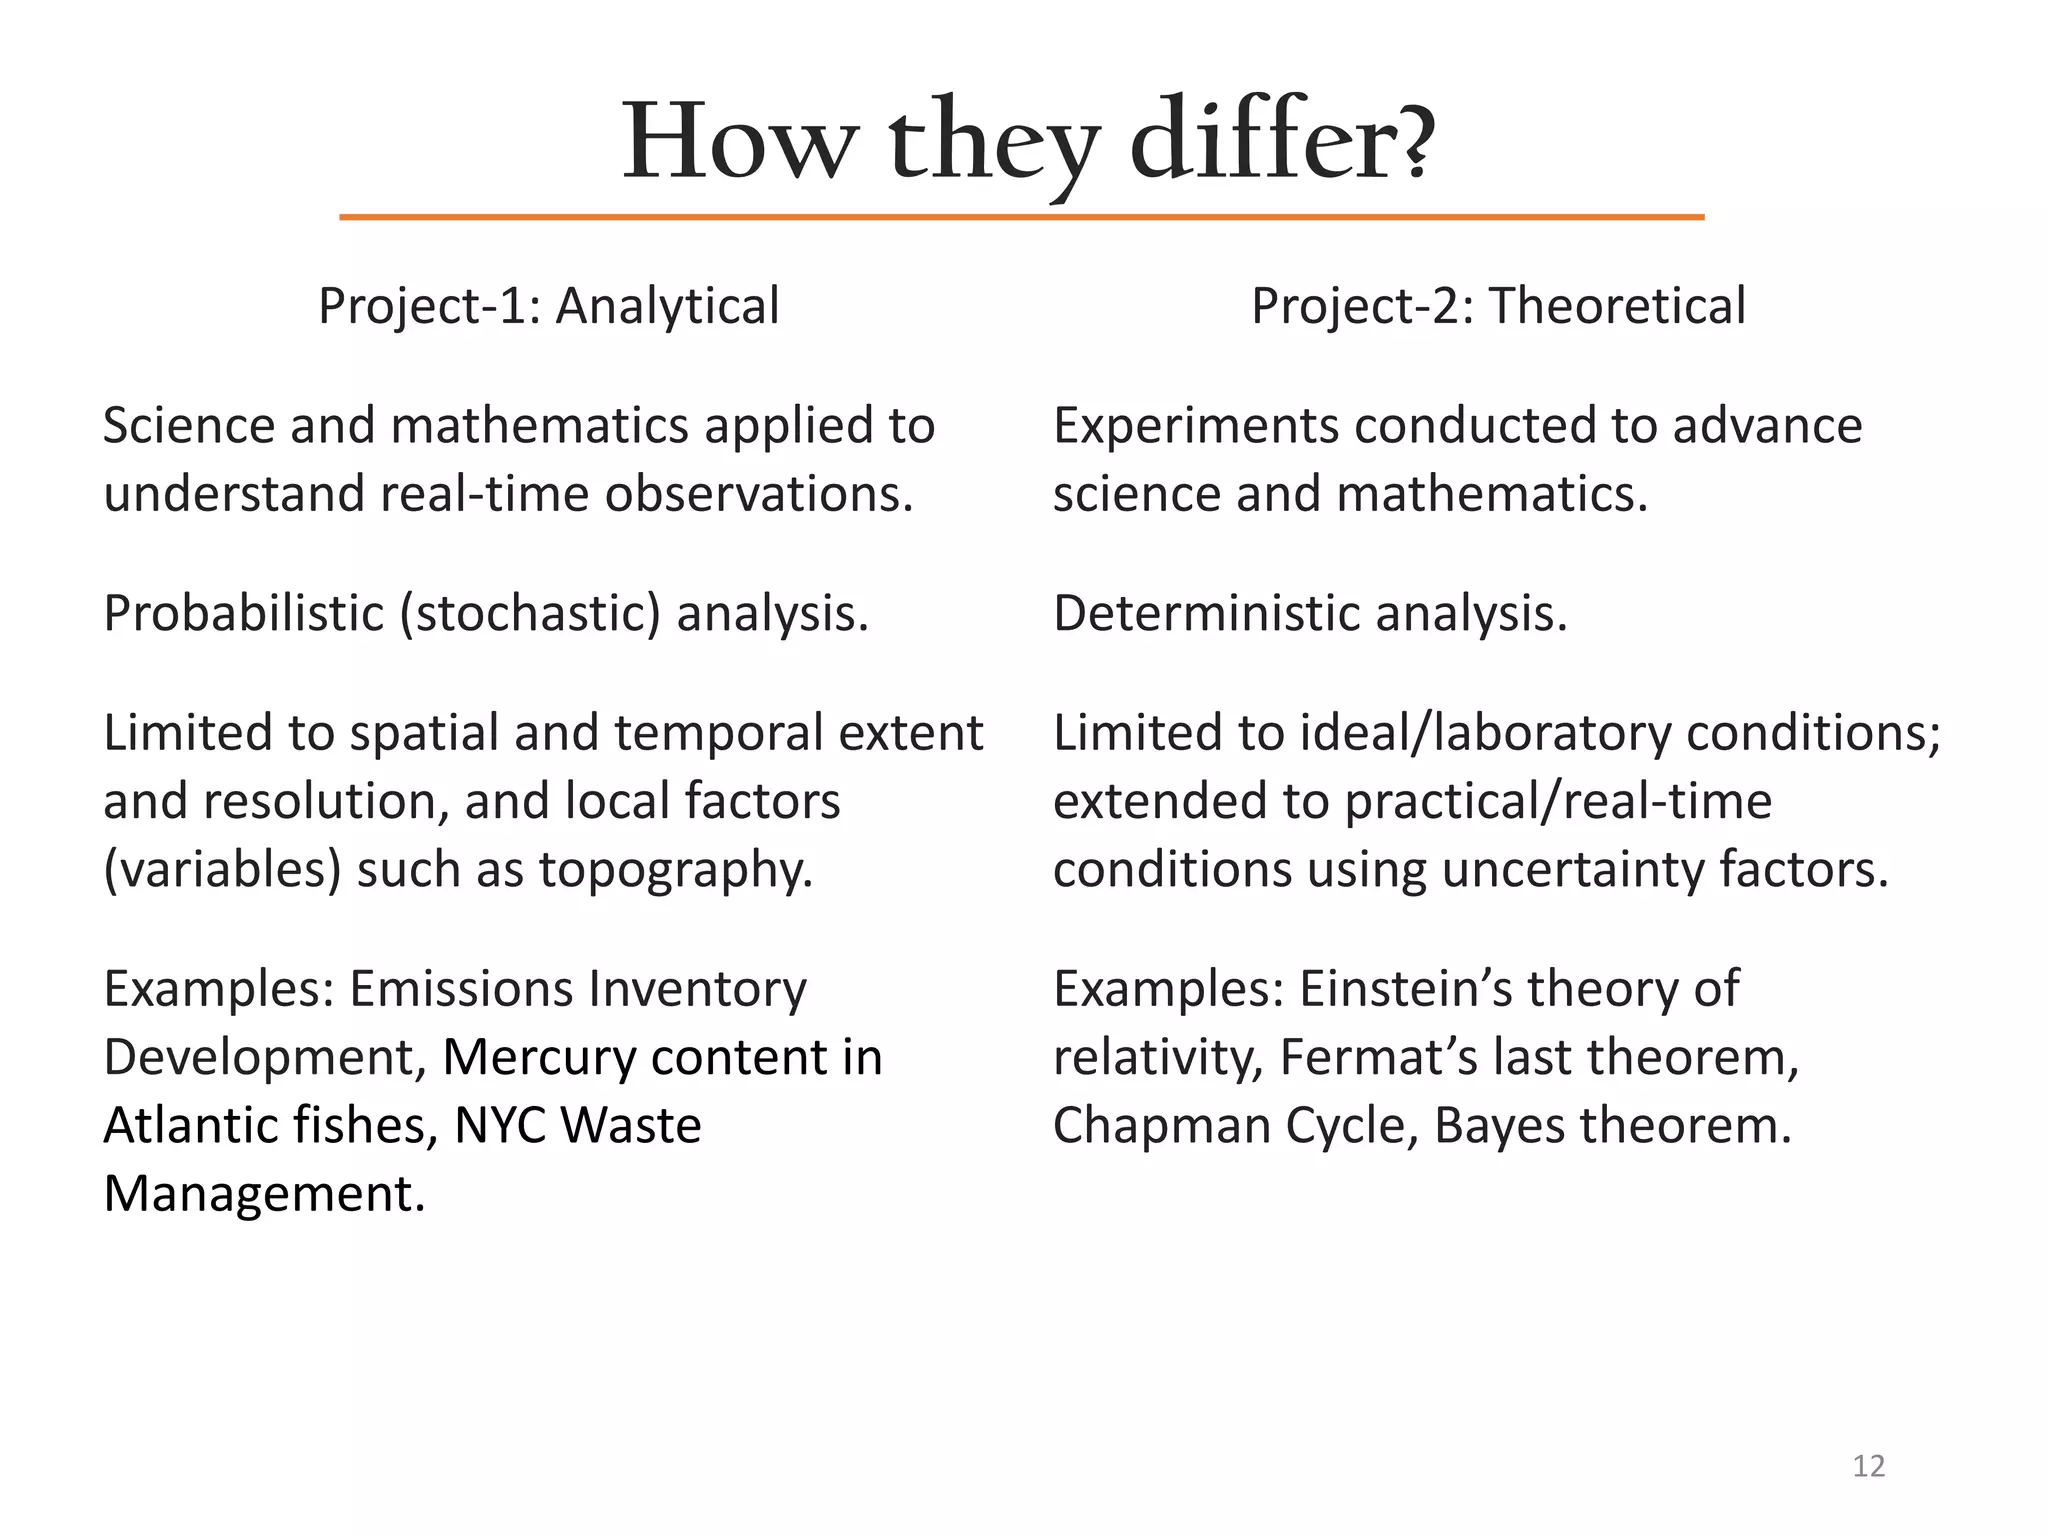
3. The projects differ in their approach, with Project 1 taking an analytical
Computations of Acoustic Wave Propagation in II-VI Hexagonal Semiconductor Compounds
Original Research Article
Journal of Chemistry and Materials Research Vol. 1 (3), 2014, 65–70
Pramod Kumar Yadawa *
An Evaluation of Biofield Treatment on Thermal, Physical and Structural Prope...albertdivis
Cadmium is widely utilized in nickel-cadmium batteries, stabilizers, and coating applications due to its versatile physico-chemical properties. The aim of present study was to evaluate the impact of biofield treatment on atomic, thermal, and physical properties of cadmium powder.
THEORETICAL AND EXPERIMENTAL STUDIES ON STEPPED SOLAR STILLIAEME Publication
In the present work, an attempt has been made to study the performance of a solar still. Many thermal models were developed by researchers to predict the performance of solar still. Thermal models developed by Dunkle and by Tsilingiris to predict the performance of the still is considered for the present study. A stepped solar still is fabricated for experimental study in the premises of SHIATS Allahabad (U.P.) India. It is observed that the daily productivity of more than 5 kg is obtained by still area of 1 m2. It is further observed that the daily productivity predicted by Tsilingiris model is closer than the Dunkle model.
Study the effects of yadnya fumes on s ox and nox levels in the surrounding e...Pranay Abhang
Yadnya is a ritual of offerings accompanied by chanting of Vedic mantras derived from the practice in Vedic times. Due to Yadnya fumes and overall process it affects environmental elements, hence its effects on oxides of sulphur and nitrogen were studied as they are the major air pollutants. Effects of Agnihotra Yadnya, Shrisukta Yadnya and somyag Yadnya were studied by collecting surrounding air using handy sampler. SOx and NOx levels before Yadnya, during Yadnya and after Yadnya were calculated and compared from collected air. As per our results, SOx levels decreases up to 10 times (almost reduces to 90%) that of initial levels due to all three Yadnyas. NOx levels increases 10 -20 % that of initial levels, but at the end of all Yadnyas NOx level reduces that to initial. Hence by performing Yadnya SOx and NOx pollution can be controlled.
IJRET : International Journal of Research in Engineering and Technology is an international peer reviewed, online journal published by eSAT Publishing House for the enhancement of research in various disciplines of Engineering and Technology. The aim and scope of the journal is to provide an academic medium and an important reference for the advancement and dissemination of research results that support high-level learning, teaching and research in the fields of Engineering and Technology. We bring together Scientists, Academician, Field Engineers, Scholars and Students of related fields of Engineering and Technology
Evaluation of the mass attenuation coefficient and Effective Atomic Number of...IOSRJAP
The potential of the Eremurus spp. root as a binder in Rhizophora-Eremurus spp. particleboard mammography phantom had been approved. In this study, the potential of Eremurus spp. as a phantom material has been investigated. The effective atomic number of the Eremurus spp. was calculated as an important parameter in the low energy range. Also, the mass attenuation coefficient of the Eremurus spp. root was measured in the 16.63 keV – 25.30 keV photon energy as a mammography range. Although, the effective atomic number of the Eremurus spp. was near to that of tissue, the mass attenuation of the Eremurus spp. root was not found close to those of breast tissue and water phantom. The results show that the Eremurus spp. root can be used just as a binder in phantom and it cannot be as a main phantom material.
Pairwise Comparison of Daily Ozone Concentration in Tampa-St.Petersburg Regio...Kalaivanan Murthy
A statistical examination of ozone variation between days.
(more description coming soon)
Please visit this link for abstract, and R code: https://www.slideshare.net/KalaivananMurthy/pairwise-comparison-of-daily-ozone-concentration-in-tampastpetersburg-region-abstract-r-program
AERMOD Tiering Approach Case Study for 1-Hour NO2BREEZE Software
This study reviews 1-hour NO2 concentrations predicted by AERMOD for a hypothetical source at four locations throughout the United States with hourly varying background ozone concentrations.
Pairing aermod concentrations with the 50th percentile monitored valueSergio A. Guerra
Presentation delivered to the Background Concentrations Workgroup for Air Dispersion Modeling organized by the Minnesota Pollution Control Agency. delivered on May 29, 2014. Three topics covered include 1) Screening monitoring data, 2) AERMOD’s time-space mismatch, and
3) Proposed 50th % Bkg Method
An Argo based estimate of Oxygen (O_2) at 150 m is presented for the Southern Ocean (SO) from T/S, O_2 Argo profiles collected during 2008-2012. The method is based on supervised machine learning, i.e. Random Forest (RF) regression, and provides an estimate for O_2 on gridded Argo T/S fields. Results show that the Southern Ocean State Estimate (SOSE) and the World Ocean Atlas 2013 climatology may overestimate annual mean O_2 in the SO, both on a global and basin scale. A large regional bias is found east of Argentina, where high O_2 values in the Argo based estimate are closer to the coast compared to other products. SOSE may also underestimate the annual cycle of O_2. Regions where the RF method does not perform well
(e.g. eastern boundaries) are identified comparing the actual SOSE O_2 fields to the RF estimate from model profiles co-located with observations. The RF based method presented here has the potential to improve our understanding of O_2 annual mean fields and variability from available (sparse) O_2 measurements. Also, it may guide the design of future enhancements to the current array of O_2 profiling floats, and prove effective for other biogeochemical variables (e.g.
nutrients and carbon).
Forbes co2 and temperature presentation for earth day at cua april 22 2015 ...Kevin Forbes
Extended Abstract
Introduction
While the vast majority of climate scientists have concluded that the changes in the climate over the past few decades can be attributed to human activity [Doran and Zimmerman, 2009], there has been a degree of reluctance to attribute specific weather events to elevated CO2 concentrations. For example, Coumou and Rahmstorf [2012] have noted that there has been an exceptionally high incidence of extreme weather events over the past decade and that some of the events can be linked to climate change but nevertheless concede that particular events “cannot be directly attributed to global warming.” Moreover, the World Meteorological Organization has noted that the incidence of extreme weather events matches IPCC projections, but qualifies this conclusion by stating that “it is impossible to say that an individual weather or climate event was “caused” by climate change….” [World Meteorological Organization, 2011, p 15]. This claim of “attribution impossibility” is not a minor shortcoming; it leaves the causes of extreme events open to question, allowing climate skeptics to attribute the increased incidence of extreme events to so-called “natural variability.” In the United States, this has undermined the political consensus necessary to adopt robust, cost-effective policies to reduce CO2 emissions.
This paper explores the relationship between CO2 and weather by addressing whether there is a causal relationship between the atmospheric concentration level of carbon dioxide and hourly temperature. The analysis begins by noting that traditional correlation analysis is not capable of addressing whether there is a causal relationship between CO2 and temperature because statistical methods alone cannot render results that establish or reject causality between two variables that are contemporaneously correlated. Nevertheless, it is possible to address the issue of causality by using more advanced statistical techniques.
An Approach to Establishing Causality
This paper addresses the issue of causality between CO2 and temperature by following the research of the Nobel Laureate Clive Granger [1969], who defined causality in terms of whether lagged values of a variable lead to more accurate predictions of some other variable. In his words, “The definition of causality …is based entirely on the predictability of the some series, say Xt. If some other series Yt, contains information in past terms that helps in the prediction of Xt … then Yt is said to cause Xt.” [Granger, 1969, p 430]. This study embraces this view of causality by examining whether lagged values of CO2 lead to more accurate forecasts of temperature. The specific approach adopted here is to exploit the diurnal nature of the variation in the hourly CO2 concentration levels by using the CO2 concentration level in hour t – 24 as an explanatory variable. This variable has a 0.96 correlation with the CO2 level in hour t but i
Life Cycle Analysis of Greenhouse Gases for Sugarcane EthanolKalaivanan Murthy
Life cycle greenhouse gas emissions were estimated for two pathways of sugarcane ethanol production. This project was done as a case-study for an environmental agency in February 2020.
Analysis of Stratospheric Tropospheric Intrusion as a Function of Potential V...Kalaivanan Murthy
This work is done as a part of a graduate course on Global Air Pollutants in April 2016. The author was pursuing MS in Environmental Engineering Sciences at the University of Florida during the making of this project.
This work is done as a part of B.Tech. degree requirements in Spring 2013 (Jan-May'13). The author was pursuing B.Tech. in Civil Engineering at the National Institute of Technology Tiruchirappalli during the making of this project.
This presentation will give you an overview of the five essential qualities that every great leader has mastered in his/her journey. It includes the elements of different leadership styles. Hence it is named as 'Hybrid Leadership.'
The presentation was given for the Toastmasters club towards completion of Level-2 in the Dynamic Leadership pathway.
This presentation will take you through a set of five points that will give you an insight into writing better emails.
The presentation was given for the Toastmasters club towards completion of Level-1 in the Dynamic Leadership pathway.
This work is done as a part of degree requirement in Spring 2017. The author was pursuing MS in Environmental Engineering Sciences at University of Florida during the making of this project.
Pairwise Comparison of Daily Ozone Concentration in Tampa-St.Petersburg Regio...Kalaivanan Murthy
A statistical examination of ozone variation between days.
(more description coming soon)
Please visit this link for poster: https://www.slideshare.net/KalaivananMurthy/pairwise-comparison-of-daily-ozone-concentration-in-tampastpetersburg-region-a-research-poster
Biodiesel vs. Diesel: Air Quality and Economic AspectsKalaivanan Murthy
This work is done as a part of graduate course in Air Quality in Spring 2017. The author was pursuing MS in Environmental Engineering Sciences at University of Florida during the making of this presentation.
(description coming soon)
The project report can be accessed at https://goo.gl/9MQNVV
This work is done as a part of graduate course in Air Quality in Spring 2017. The author was pursuing MS in Environmental Engineering Sciences at University of Florida during the making of this project.
(description coming soon)
Presentation: https://goo.gl/2MnAmG
This presentation outlines project on building an fully autonomous line follower project using infrared sensors and microcontroller.
The project was jointly developed by Kalaivanan Murthy and Surendhar Somasundaram in February 2010. The authors were freshmen at National Institute of Technology - Tiruchirappalli during the making of this project.
Application of Regression Analysis: Model Building and Validation Kalaivanan Murthy
Part-1/4: This project is first part of the four parts in series. This project demonstrates the application of regression analysis which include model building and validation.
This work is done as a part of graduate course titled Statistical Methods in Research in Spring 2017. The author was pursuing MS in Environmental Engineering Sciences at University of Florida during the making of this project.
This project enumerates the attributes of Performance Appraisal in a visual form of representation. It explains 'what is performance appraisal' through pictures, and is best accompanied with the presenter in front.
Performance Appraisal is a method by which the job performance of an employee is evaluated. It is a crucial part of any successful organization, and tries to align individual and group strengths to the organization's vision. There are many different methods of Performance Appraisal, and each has its own perks and limitations. This project discusses some of the most common methods practiced by successful organizations.
This is the Part-2 of the two parts in the series. Please refer to Part-1 for more comprehensive information and technical description. It is presented in a conventional representation with texts and flow-charts. Please refer this website for the Part-1: http://www.slideshare.net/secret/dM2jnMkaKP9c1h
This work is done as a part of undergraduate course titled Management Concepts and Practices in Spring 2013. The author was pursuing B.Tech in Civil Engineering at National Institute of Technology at Tiruchirappalli INDIA during the making of this project.
Presentation Link: http://www.slideshare.net/KalaivananMurthy/gasphase-oxidation-products-of-isoprene
Subject: Advanced Atmospheric Chemistry
This project investigates the oxidation process of isoprene in ambient atmosphere. Oxidation is the main destruction pathway of isoprene. The primary oxidants are hydroxyl radical (OH), nitrate radical (NO3) and ozone (O3).The major products produced in the oxidation are methacrolein (C4H6O), methyl vinyl ketone (C4H6O) and formaldehyde (HCHO). This project emphasis on the reaction pathways of oxidation, the products formed and their yields in different scenarios which are daylight and nighttime, high-NOx and low-NOx.
Isoprene is the most reactive organic compound and the most abundant non-methane organic compound in the atmosphere [troposphere]. It is produced from biogenic sources (trees and plants) in the presence of sunlight. Isoprene in atmosphere is important to be studied because it is a major precursor of ozone in troposphere, and for its active participation in photochemical reactions.
This work is done as a part of graduate course titled Advanced Atmospheric Chemisty in Fall 2016. The author was pursuing MS in Environmental Engineering Sciences at University of Florida during the making of this project.
Respiratory Illness Mortality: Global Health Burden due to Ozone and PM2.5Kalaivanan Murthy
This project discusses global health burden due to ozone and PM2.5. The number of deaths due to ozone is calculated using guidelines from Anenberg S.C. (2010). Ozone and PM2.5 are the main pollutants causing respiratory illness. The impact of these pollutants depends on the concentration and sensitivity of population. The concentration is determined by air quality modeling and the sensitivity is determined by epidemiology.
Attributable Fraction, the fraction of mortality caused by air pollution, is a function of concentration response factor (beta) and concentration-change (dX). CRF for North America is 0.0004. The baseline concentration is taken as preindustrial concentrations for each location. The AF is determined and factored by baseline mortality rate and exposed population to get mortality due to ozone.
AF for ozone is mapped using ArcGIS. The red area is where ozone mortality is highest. The green area is where mortality due to ozone is lowest. It is observed mortality is higher in rural and semi-urban areas than urban areas. It is because ozone is concentrated in urban centers which appears diluted in coarse gridded resolution.
The figures on mortality is provided in the project. Reference: Anenberg, S. C., Horowitz, L. W., Tong, D. Q., & West, J. J. (2010). An estimate of the global burden of anthropogenic ozone and fine particulate matter on premature human mortality using atmospheric modeling. Environmental health perspectives, 118(9), 1189.
This work is done as a part of graduate course titled Global Air Pollutants instructed by Prof. Dr. Henderson in Spring 2016. The author was pursuing MS in Environmental Engineering Sciences at University of Florida during the making of this project.
This project enumerates ways to mitigate climate change through eight strategies. Each strategy, called as 'wedge', when implemented could reduce carbon emission by 1b ton by 2055. This project prioritizes these strategies based on cost of implementation and public opinion. Ranks are assigned from 1 to 8, with 1 for highly feasible [low cost and less criticism] and 8 for hardly feasible.
As seen from the presentation, adopting to biofuels is found to be least feasible (rank-8), followed by fuel switching for electricity (rank-7). In contrast, improving transport efficiency is found to be highly feasible (rank-1), followed by efficiency in electricity production (rank-2). Justifications (qualitative and quantitative) are provided for the ranking of each strategy.
In the concluding slides, stakeholder perspectives are provided for automobile industry and industrial/developing nations. The climate wedges concept was developed by Princeton University, Ford and BP to find solutions to greenhouse gas problem (see references).
Reference:
- Carbon Mitigation Initiative http://cmi.princeton.edu/wedges/
- Stabilization Wedges Game https://cmi.princeton.edu/wedges/pdfs/teachers_guide.pdf
This work is done as a part of graduate course titled Global Air Pollutants in Spring 2016. The author was pursuing MS in Environmental Engineering Sciences at University of Florida during the making of this project.
Application of Multivariate Regression Analysis and Analysis of VarianceKalaivanan Murthy
The work is done as part of graduate coursework at University of Florida. The author studied master's in environmental engineering sciences during the making of the presentation.
The presentation discusses about oxidation of Isoprene, the most reactive organic compound. It is also the highest present non-methane organic compound in the atmosphere. Isoprene is produced by plants and is highly reactive in the atmosphere. The major destruction of this compound is by oxidation. The major oxidants, the products formed and their yields in the oxidation process is discussed in the presentation.
The presentation is done as part of graduate coursework at University of Florida. The author studied master's in environmental engineering sciences during the making of the presentation.
The presentation introduces remote sensing technology and how it is used in studying atmospheric aerosols. Remote Sensing technology uses the optical property of aerosols to detect the presence and the type of aerosol. The type or the characteristics of an aerosol is determined by seven factors which are interpreted from the satellite image. The satellite image is retrieved from geosynchronous and polar satellites, of which the latter is preferred for aerosol applications.
In addition, features and terminologies associated with remote sensing, satellite and aerosol optical properties are discussed. This project emphasizes on an interactive material that is best supplemented with lecture video. It is not designed to be conventional lecture slide. Point to note: the question mark appearing in bottom of the slides indicates the author raised a question during the lecture.
This presentation was delivered in coming-of-age lecture style, in contrast to old-school conventional style. This presentation stimulates audiences to think and act than a banal display of abstract data. The lecture videos can be found at:
[1] Part-1/2 (52 minutes): https://youtu.be/-O_mYoeg-us
[2] Part-2/2 (51 minutes): https://youtu.be/IhHHHZYcY0o
This presentation is done as a part of graduate course titled Aerosol Mechanics in Spring 2016. The author was pursuing MS in Environmental Engineering Sciences at University of Florida during the making of this project.
THE IMPORTANCE OF MARTIAN ATMOSPHERE SAMPLE RETURN.Sérgio Sacani
The return of a sample of near-surface atmosphere from Mars would facilitate answers to several first-order science questions surrounding the formation and evolution of the planet. One of the important aspects of terrestrial planet formation in general is the role that primary atmospheres played in influencing the chemistry and structure of the planets and their antecedents. Studies of the martian atmosphere can be used to investigate the role of a primary atmosphere in its history. Atmosphere samples would also inform our understanding of the near-surface chemistry of the planet, and ultimately the prospects for life. High-precision isotopic analyses of constituent gases are needed to address these questions, requiring that the analyses are made on returned samples rather than in situ.
Earliest Galaxies in the JADES Origins Field: Luminosity Function and Cosmic ...Sérgio Sacani
We characterize the earliest galaxy population in the JADES Origins Field (JOF), the deepest
imaging field observed with JWST. We make use of the ancillary Hubble optical images (5 filters
spanning 0.4−0.9µm) and novel JWST images with 14 filters spanning 0.8−5µm, including 7 mediumband filters, and reaching total exposure times of up to 46 hours per filter. We combine all our data
at > 2.3µm to construct an ultradeep image, reaching as deep as ≈ 31.4 AB mag in the stack and
30.3-31.0 AB mag (5σ, r = 0.1” circular aperture) in individual filters. We measure photometric
redshifts and use robust selection criteria to identify a sample of eight galaxy candidates at redshifts
z = 11.5 − 15. These objects show compact half-light radii of R1/2 ∼ 50 − 200pc, stellar masses of
M⋆ ∼ 107−108M⊙, and star-formation rates of SFR ∼ 0.1−1 M⊙ yr−1
. Our search finds no candidates
at 15 < z < 20, placing upper limits at these redshifts. We develop a forward modeling approach to
infer the properties of the evolving luminosity function without binning in redshift or luminosity that
marginalizes over the photometric redshift uncertainty of our candidate galaxies and incorporates the
impact of non-detections. We find a z = 12 luminosity function in good agreement with prior results,
and that the luminosity function normalization and UV luminosity density decline by a factor of ∼ 2.5
from z = 12 to z = 14. We discuss the possible implications of our results in the context of theoretical
models for evolution of the dark matter halo mass function.
Cancer cell metabolism: special Reference to Lactate PathwayAADYARAJPANDEY1
Normal Cell Metabolism:
Cellular respiration describes the series of steps that cells use to break down sugar and other chemicals to get the energy we need to function.
Energy is stored in the bonds of glucose and when glucose is broken down, much of that energy is released.
Cell utilize energy in the form of ATP.
The first step of respiration is called glycolysis. In a series of steps, glycolysis breaks glucose into two smaller molecules - a chemical called pyruvate. A small amount of ATP is formed during this process.
Most healthy cells continue the breakdown in a second process, called the Kreb's cycle. The Kreb's cycle allows cells to “burn” the pyruvates made in glycolysis to get more ATP.
The last step in the breakdown of glucose is called oxidative phosphorylation (Ox-Phos).
It takes place in specialized cell structures called mitochondria. This process produces a large amount of ATP. Importantly, cells need oxygen to complete oxidative phosphorylation.
If a cell completes only glycolysis, only 2 molecules of ATP are made per glucose. However, if the cell completes the entire respiration process (glycolysis - Kreb's - oxidative phosphorylation), about 36 molecules of ATP are created, giving it much more energy to use.
IN CANCER CELL:
Unlike healthy cells that "burn" the entire molecule of sugar to capture a large amount of energy as ATP, cancer cells are wasteful.
Cancer cells only partially break down sugar molecules. They overuse the first step of respiration, glycolysis. They frequently do not complete the second step, oxidative phosphorylation.
This results in only 2 molecules of ATP per each glucose molecule instead of the 36 or so ATPs healthy cells gain. As a result, cancer cells need to use a lot more sugar molecules to get enough energy to survive.
introduction to WARBERG PHENOMENA:
WARBURG EFFECT Usually, cancer cells are highly glycolytic (glucose addiction) and take up more glucose than do normal cells from outside.
Otto Heinrich Warburg (; 8 October 1883 – 1 August 1970) In 1931 was awarded the Nobel Prize in Physiology for his "discovery of the nature and mode of action of the respiratory enzyme.
WARNBURG EFFECT : cancer cells under aerobic (well-oxygenated) conditions to metabolize glucose to lactate (aerobic glycolysis) is known as the Warburg effect. Warburg made the observation that tumor slices consume glucose and secrete lactate at a higher rate than normal tissues.
Professional air quality monitoring systems provide immediate, on-site data for analysis, compliance, and decision-making.
Monitor common gases, weather parameters, particulates.
(May 29th, 2024) Advancements in Intravital Microscopy- Insights for Preclini...Scintica Instrumentation
Intravital microscopy (IVM) is a powerful tool utilized to study cellular behavior over time and space in vivo. Much of our understanding of cell biology has been accomplished using various in vitro and ex vivo methods; however, these studies do not necessarily reflect the natural dynamics of biological processes. Unlike traditional cell culture or fixed tissue imaging, IVM allows for the ultra-fast high-resolution imaging of cellular processes over time and space and were studied in its natural environment. Real-time visualization of biological processes in the context of an intact organism helps maintain physiological relevance and provide insights into the progression of disease, response to treatments or developmental processes.
In this webinar we give an overview of advanced applications of the IVM system in preclinical research. IVIM technology is a provider of all-in-one intravital microscopy systems and solutions optimized for in vivo imaging of live animal models at sub-micron resolution. The system’s unique features and user-friendly software enables researchers to probe fast dynamic biological processes such as immune cell tracking, cell-cell interaction as well as vascularization and tumor metastasis with exceptional detail. This webinar will also give an overview of IVM being utilized in drug development, offering a view into the intricate interaction between drugs/nanoparticles and tissues in vivo and allows for the evaluation of therapeutic intervention in a variety of tissues and organs. This interdisciplinary collaboration continues to drive the advancements of novel therapeutic strategies.
Multi-source connectivity as the driver of solar wind variability in the heli...Sérgio Sacani
The ambient solar wind that flls the heliosphere originates from multiple
sources in the solar corona and is highly structured. It is often described
as high-speed, relatively homogeneous, plasma streams from coronal
holes and slow-speed, highly variable, streams whose source regions are
under debate. A key goal of ESA/NASA’s Solar Orbiter mission is to identify
solar wind sources and understand what drives the complexity seen in the
heliosphere. By combining magnetic feld modelling and spectroscopic
techniques with high-resolution observations and measurements, we show
that the solar wind variability detected in situ by Solar Orbiter in March
2022 is driven by spatio-temporal changes in the magnetic connectivity to
multiple sources in the solar atmosphere. The magnetic feld footpoints
connected to the spacecraft moved from the boundaries of a coronal hole
to one active region (12961) and then across to another region (12957). This
is refected in the in situ measurements, which show the transition from fast
to highly Alfvénic then to slow solar wind that is disrupted by the arrival of
a coronal mass ejection. Our results describe solar wind variability at 0.5 au
but are applicable to near-Earth observatories.
Nutraceutical market, scope and growth: Herbal drug technologyLokesh Patil
As consumer awareness of health and wellness rises, the nutraceutical market—which includes goods like functional meals, drinks, and dietary supplements that provide health advantages beyond basic nutrition—is growing significantly. As healthcare expenses rise, the population ages, and people want natural and preventative health solutions more and more, this industry is increasing quickly. Further driving market expansion are product formulation innovations and the use of cutting-edge technology for customized nutrition. With its worldwide reach, the nutraceutical industry is expected to keep growing and provide significant chances for research and investment in a number of categories, including vitamins, minerals, probiotics, and herbal supplements.
Richard's entangled aventures in wonderlandRichard Gill
Since the loophole-free Bell experiments of 2020 and the Nobel prizes in physics of 2022, critics of Bell's work have retreated to the fortress of super-determinism. Now, super-determinism is a derogatory word - it just means "determinism". Palmer, Hance and Hossenfelder argue that quantum mechanics and determinism are not incompatible, using a sophisticated mathematical construction based on a subtle thinning of allowed states and measurements in quantum mechanics, such that what is left appears to make Bell's argument fail, without altering the empirical predictions of quantum mechanics. I think however that it is a smoke screen, and the slogan "lost in math" comes to my mind. I will discuss some other recent disproofs of Bell's theorem using the language of causality based on causal graphs. Causal thinking is also central to law and justice. I will mention surprising connections to my work on serial killer nurse cases, in particular the Dutch case of Lucia de Berk and the current UK case of Lucy Letby.
2. Contents
1. Project-1: Ozone Data Analysis
“A pairwise comparison of daily ozone concentration in Tampa-
St.Petersburg region by Analysis of Variance (ANOVA) statistical technique.”
2. Project-2: Isoprene Oxidation
“An investigation of products formed in gas-phase oxidation of isoprene at
high- and low-NOx conditions.”
3. Differences: Project-1 vs. Project-2
“A comparison between the perspectives of project-1 and project-2.”
Appendix-1: R Code for Project-1
Appendix-2: References for Project-2
2
4. Part-2 Plots by Group
for each treatment
Pairwise Comparison of Daily Ozone Concentration in
Tampa-St.Petersburg Region
Kalaivanan Murthy, MS
Department of Environmental Engineering Sciences, University of Florida
Kalaivanan Murthy
Email: kalaivananmurthy@ufl.edu
Website: https://www.linkedin.com/in/km007
Phone: (352) 870-2352
Contact
1. Altshuler, S. L., Arcado, T. D., & Lawson, D. R. (1995).Weekday vs. weekend ambient ozone concentrations: discussion and hypotheses with focus on northern California. Journal of the Air & Waste ManagementAssociation,45(12), 967-972.
2. Heuss, J. M., Kahlbaum, D. F., & Wolff, G. T. (2003).Weekday/weekend ozone differences: what can we learn from them?. Journal of the Air & Waste ManagementAssociation, 53(7), 772-788.
3. Ott, R. L., & Longnecker, M. T. (2015).Chapter-8 Inferences about more than two population central values, An introduction to statistical methods and data analysis, pp 402-450.Nelson Education.
4. Mächler, M. (n.d.). Friedman Rank Sum Test. Retrieved October 09, 2017, from https://stat.ethz.ch/R-manual/R-devel/library/stats/html/friedman.test.html
5. Zimmerman,D. W., & Zumbo, B. D. (1993).Relative power of the Wilcoxon test, the Friedman test, and repeated-measures ANOVA on ranks. The Journal of Experimental Education,62(1), 75-86.
6. “Air Data: Air Quality Data Collected at Outdoor Monitors Across the US.” Environmental Protection Agency, 12 Sept. 2017, www.epa.gov/outdoor-air-quality-data.
References
The variation of ozone by day has grabbed the
attention of scientists in recent times.[1][2] This
project aims to examine this variation by statistical
methods.
Hourly ozone data is downloaded from EPA and non-
parametric methods are applied to examine the
trend. Non-parametric methods are used because
the residuals are not normally distributed.
Kruskal-Wallis, a non-parametric 1-way ANOVA test,
is used to identify variation among days.[3] Friedman,
a non-parametric 2-way ANOVA test, is used to
identify the variation between a pair of days.[4]
Introduction
Objective
Results
The results convey the following points.
1. Summary Statistics. The central tendency (mean,
mean, mode) and box-and-whisker plot show that
the data is positive-skewed. This implies an
asymmetric distribution, and that the outliers are
greater than the mean. (mode<median<mean =
positive-skewed, also known as right-skewed.)
2. ANOVA and Normality. The student’s
t-distribution based ANOVA results are invalidated
by the non-normal residuals, and this was
confirmed by Anderson-Darling test. This
necessitates use of non-parametric methods, and
implies that distribution of ozone concentration
by time is not bound to z- or t-distribution.
3. Plots by Group. The group effect is very evident
for treatments month and hour but scant for day
and not evident. This prompts use of advanced
statistical methods to study the day effect.
4. Test for Group Variation. Kruskal-Wallis test,
which is a non-parametric one-way ANOVA test,
shows that day effect is significant at 5%
significance level. Friedman test, which is a non-
parametric two-way ANOVA test, shows ‘what
pairs of days differ.’ The list of p-values and their
inference is provided in the table below.
Discussion
MON TUE WED THU FRI SAT SUN
MON - 0.000 0.683 0.102 0.004 0.000 0.001
TUE 0.000 - 0.000 1.000 0.000 0.000 0.221
WED 0.683 0.000 - 0.014 0.414 0.000 0.000
THU 0.102 1.000 0.014 - 0.683 0.001 0.414
FRI 0.004 0.000 0.414 0.683 - 0.000 0.414
SAT 0.000 0.000 0.000 0.001 0.000 - 0.000
SUN 0.001 0.221 0.000 0.414 0.414 0.000 -
This project aims to answer two main questions
about daily ozone concentration.
1. Is there any significant variation among days?
2. If yes, what pairs of days differ? (For e.g., ‘is
Monday same as Friday?’)
Table 4.1 Friedmanp-values for each pair of days. Grey cells ⇒ days that ‘differ’.
Dr. Chang-Yu Wu, Professor and Assc. Chair, EES, UF.
Dr. Barron Henderson, former Asst. Professor, EES, UF.
Dr. Lawrence H. Winner, Professor, Statistics, UF.
Dr. Demetris Athienitis, Lecturer, Statistics, UF.
Acknowledgements
• The procedure can be extended to other variables
such as site-location, year, month, and hour; and
for other pollutants, particularly, PM2.5.
• The results can be combined with land-use and
urban activity; and spatial and temporal
association of air pollution can be studied.
Future Directions
Methodology
The data is screened for missing values and outliers.
It is then is factored (categorized) by the following
factors – site, year, month, day, and hour. Following
the data screening, the analysis is carried out in four
steps.
1. Summary Statistics. Basic analysis is performed
and key statistical parameters are determined.
2. ANOVA and Normality. ANOVA is run and the
resulting residuals are tested for normality using
Anderson-Darling test and Q-Q plot. The residuals
are found to violate normality. Hence, non-
parametric test is used.
3. Plots by Group. The data is plotted by groups for
the five treatments. (group=Mon, Tue, etc.;
treatment=year, month, day, etc.)
4. Test for Group Variation. The data is tested for
treatment effect for ‘day’ using Kruskal-Wallis
test. Once the day effect is confirmed, i.e., there
exists significant difference amongdays, pairwise
comparison is performed for all pairs of days using
Friedman test. Both Kruskal-Wallis and Friedman
are non-parametric tests, which can be applied
for non-normal data.[5]
Part-1 Summary Statistics
1.1 Summary Statistics
Mean 0.028 Median 0.027
Mode 0.014 Range [0, 0.104]
SD 0.014 IQR [0.018, 0.038]
(unit: parts per million volume)
Part-3 ANOVA and Normality
3.1 ANOVA
3.2.1 Normality: Anderson-Darling
p-value=3.7e-24 < 0.05
⇒ Ha: Normality is violated.
Part-4 Test for Group Variation
4.1 Kruskal-Wallis: ‘Is there variationamong days?’
p-value=1.2e-60 < 0.05 ⇒ Reject H0.
⇒ Accept Ha: Significant variation exists among days.
4.2 Friedman: ‘What pair of days differ?’
group factor: day, block factor: hour
For the pair, say, Monday-Friday,
p-value=0.004 < 0.05 ⇒Reject H0: The groups are same.
⇒ Accept Ha: Significant difference exists between the
two groups(Mon, Fri).
The p-values for other pairs are given in the table.
The project concludes the following hypothesis.
1. There is a significant variation among days.
2. The pairs of days that differ are shown as grey
color in the table.
In particular, Saturday is different from all other
days. The plots also show evidence that there is a
significant variation among years, months and hours.
Conclusion
Figure 2.1. Ozone vs. Site-Location.
Figure 2.4. Ozone vs. Month.
Figure 2.5. Ozone vs. Hour.
Poster Number
4Florida A&WMA
53rd Annual Conference
& Exhibition
Figure 1.1. Box-and-whiskerplot.
Figure 3.1. Normal Q-Q Plot.
Fig. 2.3. O3 vs. Year.
https://goo.gl/wumGJL
Figure 2.2. Ozone vs. Day.
6. Overview
• Objective: to study the pathways, products, and yields of gas-phase oxidation
of isoprene under different conditions.
• Isoprene (C5H8): the most reactive hydrocarbon, the most abundant non-
methane hydrocarbon, an alkene, source – biogenic (plants and trees) under
sunlight, global generation – 550 Tg/yr.
• Oxidants: [OH·], [O3], [NO3·] (“·” denotes radical)
• Major Products: methacrolein (C4H6O), methyl vinyl ketone (C4H6O),
formaldehyde (HCHO), and nitratocarbonyl.
6
Isoprene
(2-methyl-1,3-buta-diene)
Methacrolein
(2-methyl-prop-2-enal)
Methyl vinyl ketone
(but-3-en-2-one)
7. Oxidation Products
• Isoprene + OH: kOH = 2.54 x 10⁻¹¹ exp(410 / T)[5] cm3 molecule-1 s-1 100E-12 (298K)
• Isoprene + O3: kO3
= 7.86 x 10⁻¹⁵ exp(-1913 / T)[5] cm3 molecule-1 s-1 0.00001E-12 (298K)
MACR MVK
From OH:
0.23[3]
From OH:
0.32[14]
From O3:
0.39[9]
From O3:
0.16[9]
From NO3:
0.02[15]
From NO3:
0.05[15]
Reactivity with:
OH : 0.33*kOH
[9]
O3 : 0.09*kO3
[9]
Reactivity with:
OH : 0.19*kOH
[9]
O3 : 0.36*kO3
[9]
• MVK/MACR = 3:2
• ISOP MACR MVK are less
reactive to O3.
• But [O3] > [OH], O3 oxidation
is significant.
• MACR is more reactive to OH,
whereas MVK is more reactive
to O3.
• OH reaction more sensitive to
temperature.
• In absence of NOx,
MVK/MACR = 0.8.
• MACR MVK oxidation by NO3
is negligible.
7
8. Oxidation Pathways: NO3 , HO2
Isoprene + NO3:
• k = 0.66E-12298K
[15]
• NO2 reacts with O3 to form nitrate radicals
NO3·, which oxidizes isoprene to form
condensable SOA.
• Products formed:
Nitrooxycarbonyl
Hydroxynitrate
• Minor products include hydroxycarbonyl,
MACR MVK and HCHO.
RO2 + HO2
• k = 3.4 x 10⁻¹³ exp (800 / T) cm3 molecule s-1
• C5 unsaturated dihydroxy compounds (diols).
(Rupert and Becker, 2000). This provides
evidence for peroxy radical reactions. (Diol –
OH–R–OH)
• Oxidation products of peroxy radicals:
carboxylic acids –COOH, organic nitrate –ONO2,
alkoxy radical RO·, produces products of low
volatility, and hence formation of SOA.[13]
Peroxy Radical Reactions [k] cm3 molecule-1 s-1 [15]
RO2 + HO2 → ROOH + O2 k = 22E-12 (22*10-12)
RO2 + NO → RO + NO2 k = 4E-12
[12]
RO2 + NO → RONO2 ..organic nitrate
RO2 + NO2 → ROONO2m k = 9E-12 ..peroxy nitrate
RO2 + RO2 → 2RO + O2 k = 0.1E-12
60% yield
O2NO–R–C=O
O2NO–R–OH
8
9. Observations
• In the presence of NOx, formation of methyl vinyl ketone is
closely 1.3x molar methacrolein, and formation of
formaldehyde is 60% molar yield.
• In the absence of NOx, alkyl peroxy and hydroperoxy radicals
dominate, and produces carboxylic acid.
• In a very-low NOx environment, alkoxy radicals and nitrogen-
dioxide becomes dominant, besides peroxy radical reaction.
In addition, organonitrates are formed in significant amounts,
and peroxy nitrates are formed in negligible amounts.
• The products, carboxylic acids, organonitrates, and furans, are
less volatile than their parent compounds, and thus likely to
produce secondary organic aerosols (SOA).
• The alkoxy radicals oxidizes to produce carbonyls and
hydroperoxides. The hydroxyalkyl radicals, formed as
intermediate, has potential to isomerize, then oxidize, and
eventually to form dihydrofuran.
RO2·
alkyl peroxy
radical
HO2 ·
hydro peroxy
radical
RO ·
alkoxy radical
RCOOH
carboxylic acid
RONO2
organonitrate
ROONO2
peroxynitrate
>C=O
carbonyl
9
10. Challenges
• Second generation reactions.
• Although oxidation of MACR MVK by [O3] and [NO3] are ignored, the reactions
are found to exist.
• Photolysis of primary oxidation products.
• Recent studies show that even MACR and MVK undergo photolysis.
• Peroxy Radical reactions are less understood.
• In the absence NOx, the RO2-RO2 and RO2-HO2 reactions are significant but the
mechanisms and yields of the products are yet unclear.
• Condensed mechanisms and ‘representative compounds’
• Acetaldehyde and propanal for carbonyl oxidation products disguises the true
property of alkyl compounds.
10
12. How they differ?
Project-1: Analytical
Science and mathematics applied to
understand real-time observations.
Probabilistic (stochastic) analysis.
Limited to spatial and temporal extent
and resolution, and local factors
(variables) such as topography.
Examples: Emissions Inventory
Development, Mercury content in
Atlantic fishes, NYC Waste
Management.
12
Project-2: Theoretical
Experiments conducted to advance
science and mathematics.
Deterministic analysis.
Limited to ideal/laboratory conditions;
extended to practical/real-time
conditions using uncertainty factors.
Examples: Einstein’s theory of
relativity, Fermat’s last theorem,
Chapman Cycle, Bayes theorem.
13. Acknowledgements
• Texas Commission on Environmental Quality (TCEQ)
• JSW Steel Limited
• University of Florida
• National Institute of Technology - Tiruchirappalli (NIT-Trichy)
13
15. Approaches in
Scientific Research
Kal Murthy
M.S. Environmental Engineering Sciences
May 17, 2019
A presentation on different approaches in scientific research.
The End
Appendices >>
20. References
1. Tuazon, E. C., & Atkinson, R. (1990). A product study of the gas‐phase reaction of Isoprene with the OH radical
in the presence of NOx. International Journal of Chemical Kinetics, 22(12), 1221-1236.
2. Chameides, W. L., Lindsay, R. W., Richardson, J., & Kiang, C. S. (1988). The role of biogenic hydrocarbons in
urban photochemical smog: Atlanta as a case study. Science(Washington), 241(4872), 1473-1475.
3. Jenkin, M. E., Young, J. C., & Rickard, A. R. (2015). The MCM v3. 3.1 degradation scheme for isoprene. Atmos.
Chem. Phys, 15(20), 11433-11459.
4. Guenther, C. C. (2006). Estimates of global terrestrial isoprene emissions using MEGAN (Model of Emissions
of Gases and Aerosols from Nature). Atmospheric Chemistry and Physics, 6.
5. Karl, M., Brauers, T., Dorn, H. P., Holland, F., Komenda, M., Poppe, D., ... & Wahner, A. (2004). Kinetic Study of
the OH‐isoprene and O3‐isoprene reaction in the atmosphere simulation chamber, SAPHIR. Geophysical
research letters, 31(5).
6. Seinfeld, J. H., & Pandis, S. N. (2016). Atmospheric chemistry and physics: from air pollution to climate
change. John Wiley & Sons.
7. Perring, A. E., Wisthaler, A., Graus, M., Wooldridge, P. J., Lockwood, A. L., Mielke, L. H., ... & Cohen, R. C.
(2009). A product study of the isoprene+ NO 3 reaction. Atmospheric Chemistry and Physics, 9(14), 4945-
4956.
8. Skov, H., Hjorth, J., Lohse, C., Jensen, N. R., & Restelli, G. (1992). Products and mechanisms of the reactions of
the nitrate radical (NO3) with isoprene, 1, 3-butadiene and 2, 3-dimethyl-1, 3-butadiene in air. Atmospheric
Environment. Part A. General Topics, 26(15), 2771-2783.
9. Aschmann, S. M., & Atkinson, R. (1994). Formation yields of methyl vinyl ketone and methacrolein from the
gas-phase reaction of O3 with isoprene. Environmental science & technology, 28(8), 1539-1542..
10. Barket, D. J., Grossenbacher, J. W., Hurst, J. M., Shepson, P. B., Olszyna, K., Thornberry, T., ... & Biesenthal, T.
(2004). A study of the NOx dependence of isoprene oxidation. Journal of Geophysical Research:
Atmospheres, 109(D11).
20
21. References (cntd.)
11. Von Schneidemesser, E., Monks, P. S., & Plass-Duelmer, C. (2010). Global comparison of VOC and CO
observations in urban areas. Atmospheric Environment, 44(39), 5053-5064.
12. Ruppert, L., & Becker, K. H. (2000). A product study of the OH radical-initiated oxidation of isoprene:
Formation of C 5-unsaturated diols. Atmospheric environment, 34(10), 1529-1542.
13. Kroll, J. H., & Seinfeld, J. H. (2008). Chemistry of secondary organic aerosol: Formation and evolution of low-
volatility organics in the atmosphere. Atmospheric Environment, 42(16), 3593-3624.
14. Sprengnether, M., Demerjian, K. L., Donahue, N. M., & Anderson, J. G. (2002). Product analysis of the OH
oxidation of isoprene and 1, 3‐butadiene in the presence of NO. Journal of Geophysical Research:
Atmospheres, 107(D15).
15. Kwan, A. J., Chan, A. W. H., Ng, N. L., Kjærgaard, H. G., Seinfeld, J. H., & Wennberg, P. O. (2012). Peroxy radical
chemistry and OH radical production during the NO3-initiated oxidation of isoprene. Atmospheric Chemistry
and Physics, 12(16), 7499-7515.
16. Paulson, S. E., & Seinfeld, J. H. (1992). Development and evaluation of a photooxidation mechanism for
isoprene. Journal of Geophysical Research: Atmospheres, 97(D18), 20703-20715.
21