SlideShare a Scribd company logo
1 of 7
Download to read offline
1
STA6166 (5842): STATISTICAL METHODS FOR RESEARCH – 1
Project Assignment
Kalaivanan Murthy
Problem 1: Parametric Multiple Regression Model
Steps:
i. Develop a fuller model with all predictors, with powers 1 and without interaction terms.
ii. Develop a correlation matrix, and observe for highly correlated terms.
iii. Observe results of above steps and remove the predictors with high p-value and highly correlated predictors.
While removing highly correlated predictors, remove the one which has high p-value and keep the other.
iv. Develop a reduced model and add interaction terms based on your observation. Make sure the number of
predictors including interaction does not exceed one-tenth of number of observations.
v. Check the model for four assumptions.
vi. If assumptions are violated do Power Transformation. If model fit is major assumption violated, transform the
predictor. If normality, independence or homogeneity is violated transform response.
vii. If the power is close to 1 or violates assumptions, no transformation is necessary as such.
viii. Look for higher R2 and to arrive at a precise model, and R2
-adj and Akaike Inference Coefficient for an
effective model.
Illustrated:
i. A fuller model:
R2
=0.46 R2
adj=0.42 AIC=952.16
ii. Correlation Matrix
iii. Assumptions for a Reduced Model ( .~. –Weight–Penetration–Age+SVI.Score) R2
adj=0.49
Normality seems to be violated.
Independence is OK.
Homogeneity of variance seems to be violated
in some regions.
Fit of model is OK.
vii. Estimated Power = 0.1256. It enhances normality but slightly violated independence. It is accepted and transformation
is done.
Final Model:
Estimate Std. Error t value Pr(>|t|)
(Intercept) -15.24264 40.53932 -0.376 0.707814
Cancer.Volume 2.03225 0.59359 3.424 0.000936
Weight 0.01132 0.07395 0.153 0.878708
Age -0.53721 0.47588 -1.129 0.261977
BPH 1.29831 1.20168 1.08 0.282878
SVI 19.60957 10.89184 1.8 0.075187
Penetration 1.09877 1.33377 0.824 0.412253
Score 7.05922 5.19452 1.359 0.177589
PSA Cancer.VolumeWeight Age BPH SVI PenetrationScore
PSA 1 0.624 0.026 0.017 -0.016 0.529 0.551 0.43
Cancer.Volume 0.624 1 0.005 0.039 -0.133 0.582 0.693 0.481
Weight 0.026 0.005 1 0.164 0.322 -0.002 0.002 -0.024
Age 0.017 0.039 0.164 1 0.366 0.118 0.1 0.226
BPH -0.016 -0.133 0.322 0.366 1 -0.12 -0.083 0.027
SVI 0.529 0.582 -0.002 0.118 -0.12 1 0.68 0.429
Penetration 0.551 0.693 0.002 0.1 -0.083 0.68 1 0.462
Score 0.43 0.481 -0.024 0.226 0.027 0.429 0.462 1
2
ln (PSA) = -1.156 + 0.092*Cancer.Volume - 0.03*Penetration + 0.489*Score - 0.919*SVI +
0.268*Score*SVI
This has an R2
=0.57 R2
-adj=0.55 AIC=298.1 (lowest) λ=0.1256
Prediction Interval: ln (PSA) = (0.352, 3.994) [PSA] – mg/ml.
Point estimate for the given data: ln(PSA) = 2.173 ln(mg/ml)
Problem-2: Parametric Completely Random Design
Steps:
i. Read the data and sort it to two columns: values and treatment. If the lengths are different, use factor
argument in data.frame.
ii. Check for distribution by qq-plot. If normal, use parametric procedures. If not, use non-parametric.
iii. Create an analysis of variance table.
iv. Check for four assumptions: normality, independence, homogeneity, fit. If follows, model is valid.
v. Compare pairwise treatment and check if ‘0’ is in interval. If yes, then means differ (statistically).
vi. The data is found to be normal. Bonferroni and Tukey’s method at 95% confidence interval is used here.
iii. Analysis of Variance Table
iv. Model Validity: Check for Assumptions
v. Pairwise Treatment
 Bonferroni (level of significance=5%)  Tukey (level of significance=5%)
From the analysis, it is observed that difference in sorption rates exist for following treatments:
 Aromatics and Esters (observed in both)
 Chloroalkanes and Esters (observed only in
Bonferroni) 𝐴 𝐶̅̅̅̅̅ 𝐸
Response: S.Rate
Df Sum Sq Mean Sq F value Pr(>F)
Solvent 2 3.3054 1.65270 24.512 5.855e-07 ***
Residuals 29 1.9553 0.06743
---
Signif. codes: 0 ‘***’ 0.001 ‘**’ 0.01 ‘*’ 0.05 ‘.’ 0.1 ‘ ’ 1
[1] "95 % Pairwise CIs"
Diff. Lower Upper Differ?
A - C -0.064 -0.385 0.257 0
A - E 0.612 0.334 0.890 1
C - E 0.676 0.387 0.965 1
Tukey multiple comparisons of means
95% family-wise confidence level
Fit: aov(formula = S.Rate ~ Solvent, data = io)
$Solvent
diff lwr upr p adj
C-A 0.06402778 -0.2475781 0.3756337 0.8683140
E-A -0.61222222 -0.8826095 -0.3418350 0.0000143
E-C -0.67625000 -0.9570006 -0.3954994 0.0000054
3
In Bonferroni's, Chloroalkanes and Esters are found to differ. But in Tukey’s, it is not. Since Bonferroni’s is more
conservative, we adopt it for conclusion. Unit: mole percentage
Problem-3: Nonparametric Randomized Block Design
Steps:
i. Determine the factor (treatment) and the block. Here a machine is assigned to an operator, Machine is taken
as block and Operator is taken as treatment. However to the problem requires to check for both cases.
ii. Create a dataframe and arrange the values at given levels (also known as factors).
iii. Make an anova table to find if treatments differ, atleast one.
iv. If the sample size is too small, adopt a non-parametric test. (Friedman’s test is done here)
v. Use the function friedman.test or friedman.test2.
vi. Check if zero is in the interval. If yes, then the factors do not differ.
ii. Dataframe with levels/factors: iii. Analysis of Variance Table
At level of significance=10%, the Machine and Operator treatment differs.
v. Friedman Nonparametric Test
 Observation as Factor  Machine as Factor
From the analysis, it is observed that the difference in Time exist for following treatments:
 Operator: 1-5, 1-6, 2-5, 2-6
 Machine: 1-4, 2-3, 2-4
𝑂2 𝑂1̅̅̅̅̅̅̅̅̅ 𝑂3 𝑂4̅̅̅̅̅̅̅̅ 𝑂6 𝑂5
𝑀1 𝑀2̅̅̅̅̅̅̅̅̅̅ 𝑀3̅̅̅̅ 𝑀4
[Time]: s
Operator
Machine O1 O2 O3 O4 O5 O6
M1 42.5 39.3 39.6 39.9 42.9 43.6
M2 39.8 40.1 40.5 42.3 42.5 43.1
M3 40.2 40.5 41.3 43.4 44.9 45.1
M4 41.3 42.2 43.5 44.2 45.9 42.3
Df Sum Sq Mean Sq F value Pr(>F)
Machine 3 15.92 5.308 3.339 0.04790 *
Operator 5 42.09 8.417 5.294 0.00533 **
Residuals 15 23.85 1.590
---
Signif. codes: 0 ‘***’ 0.001 ‘**’ 0.01 ‘*’ 0.05 ‘.’ 0.1 ‘ ’ 1
[1] "90 % Pairwise CIs on rank sums"
Difference Lower Upper Differ?
O1 - O2 0 -9.9522 9.9522 0
O1 - O3 -5 -14.9522 4.9522 0
O1 - O4 -9 -18.9522 0.9522 0
O1 - O5 -14 -23.9522 -4.0478 1
O1 - O6 -14 -23.9522 -4.0478 1
O2 - O3 -5 -14.9522 4.9522 0
O2 - O4 -9 -18.9522 0.9522 0
O2 - O5 -14 -23.9522 -4.0478 1
O2 - O6 -14 -23.9522 -4.0478 1
O3 - O4 -4 -13.9522 5.9522 0
O3 - O5 -9 -18.9522 0.9522 0
O3 - O6 -9 -18.9522 0.9522 0
O4 - O5 -5 -14.9522 4.9522 0
O4 - O6 -5 -14.9522 4.9522 0
O5 - O6 0 -9.9522 9.9522 0
Friedman TS: 14.57143 on df= 5 with p-value= 0.01235945443
[1] "90 % Pairwise CIs on rank sums"
Difference Lower Upper Differ?
M1 - M2 2 -4.4378 8.4378 0
M1 - M3 -6 -12.4378 0.4378 0
M1 - M4 -8 -14.4378 -1.5622 1
M2 - M3 -8 -14.4378 -1.5622 1
M2 - M4 -10 -16.4378 -3.5622 1
M3 - M4 -2 -8.4378 4.4378 0
Friedman TS: 6.80 on df= 3 with p-value= 0.07855315984
4
Program in R:
#PROBLEM-1:MULTIPLE REGRESSION MODEL
alcohol=read.csv("C:/Users/Kalaivanan
Murthy/Desktop/Project
Data/P1.csv",header=T)
ls.str(alcohol)
View(alcohol)
#NAIVE MODEL
vintage=lm(PSA~Cancer.Volume+Weight+Age+BPH+
SVI+Penetration+Score,data=alcohol)
summary(vintage)
AIC(vintage)
#CORRELATION
round(cor(alcohol[c("PSA","Cancer.Volume","W
eight","Age",
"BPH","SVI","Penetration","Score")]),3)
#UPDATE MODEL
vintage.new=update(vintage,.~. -Weight-
Penetration-Age+SVI*Score)
summary(vintage.new)
AIC(vintage.new)
#CHECK ASSUMPTIONS
source("http://www.stat.ufl.edu/~athienit/ch
eck.R")
check(vintage.new,tests=T)
#TRY TRANSFORMATION
library(car)
red.wine=powerTransform(vintage.new)
summary(red.wine)
PSA.new=bcPower(alcohol$PSA,0.1118)
vintage.transform=update(vintage.new, .~. -
PSA+PSA.new)
summary(vintage.transform)
AIC(vintage.transform)
check(vintage.transform,tests=T)
#TRY HIGHER ORDER TERMS
Score.new=bcPower(alcohol$Score,2)
vintage.x=update(vintage.new, .~. -
Score+Score.new-SVI:Score+SVI:Score.new)
summary(vintage.x)
check(vintage.x,tests=T)
#PREDICTION INTERVALS
predict.lm(vintage.x,newdata=data.frame(Canc
er.Volume=4.2633,Weight=22.783,
Age=68,BPH=1.3500,SVI=0,Penetration=0,Score.
new=36),
interval="prediction",level=0.90,se.fit=F)
#PROBLEM-2:PARAMETRIC COMPLETELY RANDOM
DESIGN
jupiter.moon=read.csv("C:/Users/Kalaivanan
Murthy/Desktop/Project
Data/P2.csv",header=T)
ls.str(jupiter.moon)
attach(jupiter.moon)
A=Aromatics[!is.na(Aromatics)];
length(Aromatics)
C=Chloroalkanes[!is.na(Chloroalkanes)];
length (Chloroalkanes)
E=Esters[!is.na(Esters)]; length(Esters)
#CHECK FOR NORMALITY
qqnorm(A,datax=T); qqline(A,datax=T)
qqnorm(C,datax=T); qqline(C,datax=T)
qqnorm(E,datax=T); qqline(E,datax=T)
#CREATE NEW DATAFRAME & ANOVA TABLE
io=data.frame(S.Rate=c(A,C,E),
Solvent=factor(rep(c("A","C","E"),
times=c(length(A),length(C),length(E)))))
callisto=aov(S.Rate~Solvent,data=io)
anova(callisto) #QUESTION:
Sou:Internet: 'Callisto' is already aov
table. why is done again?
summary(callisto)
#BONFERRONI ANALYSIS
source("http://www.stat.ufl.edu/~athienit/Bo
nf.R")
Bonf(S.Rate~Solvent,data=io)
#TUKEY ANALYSIS
ganymede=TukeyHSD(callisto)
print(ganymede)
#CHECK ASSUMPTIONS
source("http://www.stat.ufl.edu/~athienit/ch
eck.R")
check(callisto)
5
#PROBLEM-3: NONPARAMETRIC RANDOMIZED BLOCK
DESIGN
milky.way=read.csv("C:/Users/Kalaivanan
Murthy/Desktop/Project
Data/P3.csv",header=T)
print(milky.way)
attach(milky.way)
#DATAFRAME & LEVELS
andromeda=data.frame(Time=c(O1,O2,O3,O4,O5,O
6),
Operator=factor(rep(c("O1","O2","O3","O4","O
5","O6"),each=4)),
Machine=factor(rep(c("M1","M2","M3","M4"))))
attach(andromeda)
tadpole=aov(Time~Machine+Operator)
summary(tadpole)
xtabs(Time~Machine+Operator,data=andromeda)
#RANK MATRIX
lmc.rank=tapply(Time,Machine,rank);
print(lmc.rank)
lmc.table=matrix(0,4,6,dimnames=list(c(),c("
O1","O2","O3","O4","O5","O6")))
for(i in 1:4){
lmc.table[i,]=lmc.rank[[i]]
}
print(lmc.table)
#FRIEDMAN TEST
friedman.test(Time~Operator|Machine,
data=andromeda)
#FRIEDMAN TEST-2 (DR.ATHIENITIS)
source("http://www.stat.ufl.edu/~athienit/fr
iedman.test2.R")
friedman.test2(Time~Operator|Machine,mc=TRUE
,data=andromeda,level=0.90)
friedman.test2(Time~Machine|Operator,mc=TRUE
,data=andromeda,level=0.90)
1. A university medical center urology group was interested in modeling prostate-specific
antigen (PSA) and a number of prognostic clinical measurements in men with advanced
prostate cancer. Data were collected on 97 men who were about to undergo radical
prostectomies.
http://www.stat.ufl.edu/~athienit/STA6166/assignment3_1.txt
Each line of the data set ha an identification number and provides information on 8
other variables
Variable
Number
Variable Name Description
1 ID number 1-97
2 PSA level Serum prostate-specific antigen level (mg/ml)
3 Cancer volume Estimate of prostate cancer volume (cc)
4 Weight Prostate weight (gramms)
5 Age Age of patient (years)
6 Benign prostatic
hyperplasia
Amount of benign prostatic hyperplasia (cm2
)
7 Seminal vesicle in-
vasion
Presence of seminal vesicle invasion: 1 yes; 0
otherwise
8 Capsular penetra-
tion
Degree of capsular penetration (cm)
9 Gleason score Pathologically determined grade of disease.
(Scores were either 6, 7, or 8 with higher scores
indicating worse prognosis)
Develop a “best” model for predicting PSA and interpret. In addition, create a 90%
prediction interval for PSA levels for an individual who has the following values.
Variable
Number
Variable Name Value
3 Cancer volume 4.2633
4 Weight 22.783
5 Age 68
6 Benign prostatic hyperplasia 1.3500
7 Seminal vesicle invasion 0
8 Capsular penetration 0
9 Gleason score 6
Problem Statement
6
2. Three chemical cleaning solvents are a potential hazardous waste. Independent samples
of solvents from each type were tested and their sorption rates were recorded as a mole
percentage.
Aromatics Chloroalkanes Esters
1.06 0.95 1.58 1.12 0.29 0.43 0.06
0.79 0.65 1.45 0.91 0.06 0.51 0.09
0.82 1.15 0.57 0.83 0.44 0.10 0.17
0.89 1.12 1.16 0.43 0.55 0.53 0.17
1.05 0.61 0.34 0.60
Analyze the dataset (using appropriate methodology) and determine if there are dif-
ferences in the mean sorption rate. If so, what are the differences?
3. Four different machines are being considered in an assembly plant. It is decided that
6 different operators are to be used in a randomized block experiment. The machines
are assigned in a random order to each operator. The amount of time (in seconds)
were recorded:
Operator
Machine 1 2 3 4 5 6
1 42.5 39.3 39.6 39.9 42.9 43.6
2 39.8 40.1 40.5 42.3 42.5 43.1
3 40.2 40.5 41.3 43.4 44.9 45.1
4 41.3 42.2 43.5 44.2 45.9 42.3
Do the machines perform at the same rate using α = 0.10? If not, which differ, by
how much, etc. Give a complete analysis. Does the operator play a significant effect?
Explain.
7

More Related Content

Viewers also liked

Multivariate Regression Analysis
Multivariate Regression AnalysisMultivariate Regression Analysis
Multivariate Regression AnalysisKalaivanan Murthy
 
Respiratory Illness Mortality: Global Health Burden due to Ozone and PM2.5
Respiratory Illness Mortality: Global Health Burden due to Ozone and PM2.5Respiratory Illness Mortality: Global Health Burden due to Ozone and PM2.5
Respiratory Illness Mortality: Global Health Burden due to Ozone and PM2.5Kalaivanan Murthy
 
Application of Regression Analysis: Model Building and Validation
Application of Regression Analysis: Model Building and Validation  Application of Regression Analysis: Model Building and Validation
Application of Regression Analysis: Model Building and Validation Kalaivanan Murthy
 
Gasphase Oxidation Products of Isoprene
Gasphase Oxidation Products of IsopreneGasphase Oxidation Products of Isoprene
Gasphase Oxidation Products of IsopreneKalaivanan Murthy
 
Seismic Analysis of Elevated Water Tank
Seismic Analysis of Elevated Water TankSeismic Analysis of Elevated Water Tank
Seismic Analysis of Elevated Water TankKalaivanan Murthy
 

Viewers also liked (6)

Multivariate Regression Analysis
Multivariate Regression AnalysisMultivariate Regression Analysis
Multivariate Regression Analysis
 
Respiratory Illness Mortality: Global Health Burden due to Ozone and PM2.5
Respiratory Illness Mortality: Global Health Burden due to Ozone and PM2.5Respiratory Illness Mortality: Global Health Burden due to Ozone and PM2.5
Respiratory Illness Mortality: Global Health Burden due to Ozone and PM2.5
 
Application of Regression Analysis: Model Building and Validation
Application of Regression Analysis: Model Building and Validation  Application of Regression Analysis: Model Building and Validation
Application of Regression Analysis: Model Building and Validation
 
Gasphase Oxidation Products of Isoprene
Gasphase Oxidation Products of IsopreneGasphase Oxidation Products of Isoprene
Gasphase Oxidation Products of Isoprene
 
Remote Sensing of Aerosols
Remote Sensing of AerosolsRemote Sensing of Aerosols
Remote Sensing of Aerosols
 
Seismic Analysis of Elevated Water Tank
Seismic Analysis of Elevated Water TankSeismic Analysis of Elevated Water Tank
Seismic Analysis of Elevated Water Tank
 

Similar to Parametric Regression Modeling and Nonparametric Tests

Statistics project2
Statistics project2Statistics project2
Statistics project2shri1984
 
Repeated events analyses
Repeated events analysesRepeated events analyses
Repeated events analysesMike LaValley
 
Paper id 21201434
Paper id 21201434Paper id 21201434
Paper id 21201434IJRAT
 
week 1 ScoreWeek 1.Measurement and Description - chapters 1 and 2.docx
week 1 ScoreWeek 1.Measurement and Description - chapters 1 and 2.docxweek 1 ScoreWeek 1.Measurement and Description - chapters 1 and 2.docx
week 1 ScoreWeek 1.Measurement and Description - chapters 1 and 2.docxmelbruce90096
 
Med day presentation
Med day presentationMed day presentation
Med day presentationCarsten Lund
 
Lab 4 – Energy Sources and Alternative EnergyExperiment 1.docx
Lab 4 – Energy Sources and Alternative EnergyExperiment 1.docxLab 4 – Energy Sources and Alternative EnergyExperiment 1.docx
Lab 4 – Energy Sources and Alternative EnergyExperiment 1.docxDIPESH30
 
7. evaluation of diagnostic test
7. evaluation of diagnostic test7. evaluation of diagnostic test
7. evaluation of diagnostic testAshok Kulkarni
 
Troubleshooting QC Problems: Your QC has failed, what do you do next?
Troubleshooting QC Problems: Your QC has failed, what do you do next?Troubleshooting QC Problems: Your QC has failed, what do you do next?
Troubleshooting QC Problems: Your QC has failed, what do you do next?Randox
 
MSc Finance_EF_0853352_Kartik Malla
MSc Finance_EF_0853352_Kartik MallaMSc Finance_EF_0853352_Kartik Malla
MSc Finance_EF_0853352_Kartik MallaKartik Malla
 
Six Sigma Methods and Formulas for Successful Quality Management
Six Sigma Methods and Formulas for Successful Quality ManagementSix Sigma Methods and Formulas for Successful Quality Management
Six Sigma Methods and Formulas for Successful Quality ManagementIJERA Editor
 
33151-33161.ppt
33151-33161.ppt33151-33161.ppt
33151-33161.pptdawitg2
 
Chapter 3.pptx
Chapter 3.pptxChapter 3.pptx
Chapter 3.pptxmahamoh6
 
Basic QC Statistics - Improving Laboratory Performance Through Quality Contro...
Basic QC Statistics - Improving Laboratory Performance Through Quality Contro...Basic QC Statistics - Improving Laboratory Performance Through Quality Contro...
Basic QC Statistics - Improving Laboratory Performance Through Quality Contro...Randox
 
Download-manuals-water quality-technicalpapers-within-labaq-cfindings-2ndround
 Download-manuals-water quality-technicalpapers-within-labaq-cfindings-2ndround Download-manuals-water quality-technicalpapers-within-labaq-cfindings-2ndround
Download-manuals-water quality-technicalpapers-within-labaq-cfindings-2ndroundhydrologywebsite1
 
Econometric (Indonesia's Economy).pptx
Econometric (Indonesia's Economy).pptxEconometric (Indonesia's Economy).pptx
Econometric (Indonesia's Economy).pptxIndraYu2
 

Similar to Parametric Regression Modeling and Nonparametric Tests (20)

Statistics project2
Statistics project2Statistics project2
Statistics project2
 
Repeated events analyses
Repeated events analysesRepeated events analyses
Repeated events analyses
 
Paper id 21201434
Paper id 21201434Paper id 21201434
Paper id 21201434
 
week 1 ScoreWeek 1.Measurement and Description - chapters 1 and 2.docx
week 1 ScoreWeek 1.Measurement and Description - chapters 1 and 2.docxweek 1 ScoreWeek 1.Measurement and Description - chapters 1 and 2.docx
week 1 ScoreWeek 1.Measurement and Description - chapters 1 and 2.docx
 
Med day presentation
Med day presentationMed day presentation
Med day presentation
 
Two Variances or Standard Deviations
Two Variances or Standard DeviationsTwo Variances or Standard Deviations
Two Variances or Standard Deviations
 
Lab 4 – Energy Sources and Alternative EnergyExperiment 1.docx
Lab 4 – Energy Sources and Alternative EnergyExperiment 1.docxLab 4 – Energy Sources and Alternative EnergyExperiment 1.docx
Lab 4 – Energy Sources and Alternative EnergyExperiment 1.docx
 
Unit-5.-t-test.ppt
Unit-5.-t-test.pptUnit-5.-t-test.ppt
Unit-5.-t-test.ppt
 
report
reportreport
report
 
7. evaluation of diagnostic test
7. evaluation of diagnostic test7. evaluation of diagnostic test
7. evaluation of diagnostic test
 
Troubleshooting QC Problems: Your QC has failed, what do you do next?
Troubleshooting QC Problems: Your QC has failed, what do you do next?Troubleshooting QC Problems: Your QC has failed, what do you do next?
Troubleshooting QC Problems: Your QC has failed, what do you do next?
 
Statistical control to monitor
Statistical control to monitorStatistical control to monitor
Statistical control to monitor
 
MSc Finance_EF_0853352_Kartik Malla
MSc Finance_EF_0853352_Kartik MallaMSc Finance_EF_0853352_Kartik Malla
MSc Finance_EF_0853352_Kartik Malla
 
Spss & minitab
Spss & minitabSpss & minitab
Spss & minitab
 
Six Sigma Methods and Formulas for Successful Quality Management
Six Sigma Methods and Formulas for Successful Quality ManagementSix Sigma Methods and Formulas for Successful Quality Management
Six Sigma Methods and Formulas for Successful Quality Management
 
33151-33161.ppt
33151-33161.ppt33151-33161.ppt
33151-33161.ppt
 
Chapter 3.pptx
Chapter 3.pptxChapter 3.pptx
Chapter 3.pptx
 
Basic QC Statistics - Improving Laboratory Performance Through Quality Contro...
Basic QC Statistics - Improving Laboratory Performance Through Quality Contro...Basic QC Statistics - Improving Laboratory Performance Through Quality Contro...
Basic QC Statistics - Improving Laboratory Performance Through Quality Contro...
 
Download-manuals-water quality-technicalpapers-within-labaq-cfindings-2ndround
 Download-manuals-water quality-technicalpapers-within-labaq-cfindings-2ndround Download-manuals-water quality-technicalpapers-within-labaq-cfindings-2ndround
Download-manuals-water quality-technicalpapers-within-labaq-cfindings-2ndround
 
Econometric (Indonesia's Economy).pptx
Econometric (Indonesia's Economy).pptxEconometric (Indonesia's Economy).pptx
Econometric (Indonesia's Economy).pptx
 

More from Kalaivanan Murthy

Life Cycle Analysis of Greenhouse Gases for Sugarcane Ethanol
Life Cycle Analysis of Greenhouse Gases for Sugarcane EthanolLife Cycle Analysis of Greenhouse Gases for Sugarcane Ethanol
Life Cycle Analysis of Greenhouse Gases for Sugarcane EthanolKalaivanan Murthy
 
Analysis of Stratospheric Tropospheric Intrusion as a Function of Potential V...
Analysis of Stratospheric Tropospheric Intrusion as a Function of Potential V...Analysis of Stratospheric Tropospheric Intrusion as a Function of Potential V...
Analysis of Stratospheric Tropospheric Intrusion as a Function of Potential V...Kalaivanan Murthy
 
Seismic Analysis of Elevated Water Tank
Seismic Analysis of Elevated Water TankSeismic Analysis of Elevated Water Tank
Seismic Analysis of Elevated Water TankKalaivanan Murthy
 
Approaches in Scientific Research
Approaches in Scientific ResearchApproaches in Scientific Research
Approaches in Scientific ResearchKalaivanan Murthy
 
Impact of Greenhouse Gases on Climate Policy
Impact of Greenhouse Gases on Climate PolicyImpact of Greenhouse Gases on Climate Policy
Impact of Greenhouse Gases on Climate PolicyKalaivanan Murthy
 
Pairwise Comparison of Daily Ozone Concentration in Tampa-St.Petersburg Regio...
Pairwise Comparison of Daily Ozone Concentration in Tampa-St.Petersburg Regio...Pairwise Comparison of Daily Ozone Concentration in Tampa-St.Petersburg Regio...
Pairwise Comparison of Daily Ozone Concentration in Tampa-St.Petersburg Regio...Kalaivanan Murthy
 
Biodiesel vs. Diesel: Air Quality and Economic Aspects
Biodiesel vs. Diesel: Air Quality and Economic AspectsBiodiesel vs. Diesel: Air Quality and Economic Aspects
Biodiesel vs. Diesel: Air Quality and Economic AspectsKalaivanan Murthy
 
Performance of Biodiesel against Petroleum Diesel
Performance of Biodiesel against Petroleum DieselPerformance of Biodiesel against Petroleum Diesel
Performance of Biodiesel against Petroleum DieselKalaivanan Murthy
 
Near-field Gaussian Dispersion Analysis in AERMOD: A demonstration project (I...
Near-field Gaussian Dispersion Analysis in AERMOD: A demonstration project (I...Near-field Gaussian Dispersion Analysis in AERMOD: A demonstration project (I...
Near-field Gaussian Dispersion Analysis in AERMOD: A demonstration project (I...Kalaivanan Murthy
 
Performance Appraisal (Part-2/2: Graphical Representation)
Performance Appraisal (Part-2/2: Graphical Representation)Performance Appraisal (Part-2/2: Graphical Representation)
Performance Appraisal (Part-2/2: Graphical Representation)Kalaivanan Murthy
 
Gasphase Oxidation Products of Isoprene
Gasphase Oxidation Products of IsopreneGasphase Oxidation Products of Isoprene
Gasphase Oxidation Products of IsopreneKalaivanan Murthy
 
Indian Economy: Part-1 Everyday Economics
Indian Economy: Part-1 Everyday EconomicsIndian Economy: Part-1 Everyday Economics
Indian Economy: Part-1 Everyday EconomicsKalaivanan Murthy
 

More from Kalaivanan Murthy (18)

Life Cycle Analysis of Greenhouse Gases for Sugarcane Ethanol
Life Cycle Analysis of Greenhouse Gases for Sugarcane EthanolLife Cycle Analysis of Greenhouse Gases for Sugarcane Ethanol
Life Cycle Analysis of Greenhouse Gases for Sugarcane Ethanol
 
Analysis of Stratospheric Tropospheric Intrusion as a Function of Potential V...
Analysis of Stratospheric Tropospheric Intrusion as a Function of Potential V...Analysis of Stratospheric Tropospheric Intrusion as a Function of Potential V...
Analysis of Stratospheric Tropospheric Intrusion as a Function of Potential V...
 
Seismic Analysis of Elevated Water Tank
Seismic Analysis of Elevated Water TankSeismic Analysis of Elevated Water Tank
Seismic Analysis of Elevated Water Tank
 
Approaches in Scientific Research
Approaches in Scientific ResearchApproaches in Scientific Research
Approaches in Scientific Research
 
Hybrid Leadership
Hybrid LeadershipHybrid Leadership
Hybrid Leadership
 
How to write better emails?
How to write better emails?How to write better emails?
How to write better emails?
 
Impact of Greenhouse Gases on Climate Policy
Impact of Greenhouse Gases on Climate PolicyImpact of Greenhouse Gases on Climate Policy
Impact of Greenhouse Gases on Climate Policy
 
Pairwise Comparison of Daily Ozone Concentration in Tampa-St.Petersburg Regio...
Pairwise Comparison of Daily Ozone Concentration in Tampa-St.Petersburg Regio...Pairwise Comparison of Daily Ozone Concentration in Tampa-St.Petersburg Regio...
Pairwise Comparison of Daily Ozone Concentration in Tampa-St.Petersburg Regio...
 
Pairwise Comparison of Daily Ozone Concentration in Tampa-St.Petersburg Regio...
Pairwise Comparison of Daily Ozone Concentration in Tampa-St.Petersburg Regio...Pairwise Comparison of Daily Ozone Concentration in Tampa-St.Petersburg Regio...
Pairwise Comparison of Daily Ozone Concentration in Tampa-St.Petersburg Regio...
 
Biodiesel vs. Diesel: Air Quality and Economic Aspects
Biodiesel vs. Diesel: Air Quality and Economic AspectsBiodiesel vs. Diesel: Air Quality and Economic Aspects
Biodiesel vs. Diesel: Air Quality and Economic Aspects
 
Performance of Biodiesel against Petroleum Diesel
Performance of Biodiesel against Petroleum DieselPerformance of Biodiesel against Petroleum Diesel
Performance of Biodiesel against Petroleum Diesel
 
Near-field Gaussian Dispersion Analysis in AERMOD: A demonstration project (I...
Near-field Gaussian Dispersion Analysis in AERMOD: A demonstration project (I...Near-field Gaussian Dispersion Analysis in AERMOD: A demonstration project (I...
Near-field Gaussian Dispersion Analysis in AERMOD: A demonstration project (I...
 
Autonomous Line Follower
Autonomous Line FollowerAutonomous Line Follower
Autonomous Line Follower
 
Performance Appraisal (Part-2/2: Graphical Representation)
Performance Appraisal (Part-2/2: Graphical Representation)Performance Appraisal (Part-2/2: Graphical Representation)
Performance Appraisal (Part-2/2: Graphical Representation)
 
Gasphase Oxidation Products of Isoprene
Gasphase Oxidation Products of IsopreneGasphase Oxidation Products of Isoprene
Gasphase Oxidation Products of Isoprene
 
Climate Wedges
Climate Wedges Climate Wedges
Climate Wedges
 
Indian Economy: Part-1 Everyday Economics
Indian Economy: Part-1 Everyday EconomicsIndian Economy: Part-1 Everyday Economics
Indian Economy: Part-1 Everyday Economics
 
Graduate Training at JSW
Graduate Training at JSWGraduate Training at JSW
Graduate Training at JSW
 

Recently uploaded

Study on Air-Water & Water-Water Heat Exchange in a Finned Tube Exchanger
Study on Air-Water & Water-Water Heat Exchange in a Finned Tube ExchangerStudy on Air-Water & Water-Water Heat Exchange in a Finned Tube Exchanger
Study on Air-Water & Water-Water Heat Exchange in a Finned Tube ExchangerAnamika Sarkar
 
chaitra-1.pptx fake news detection using machine learning
chaitra-1.pptx  fake news detection using machine learningchaitra-1.pptx  fake news detection using machine learning
chaitra-1.pptx fake news detection using machine learningmisbanausheenparvam
 
Application of Residue Theorem to evaluate real integrations.pptx
Application of Residue Theorem to evaluate real integrations.pptxApplication of Residue Theorem to evaluate real integrations.pptx
Application of Residue Theorem to evaluate real integrations.pptx959SahilShah
 
Software and Systems Engineering Standards: Verification and Validation of Sy...
Software and Systems Engineering Standards: Verification and Validation of Sy...Software and Systems Engineering Standards: Verification and Validation of Sy...
Software and Systems Engineering Standards: Verification and Validation of Sy...VICTOR MAESTRE RAMIREZ
 
Gurgaon ✡️9711147426✨Call In girls Gurgaon Sector 51 escort service
Gurgaon ✡️9711147426✨Call In girls Gurgaon Sector 51 escort serviceGurgaon ✡️9711147426✨Call In girls Gurgaon Sector 51 escort service
Gurgaon ✡️9711147426✨Call In girls Gurgaon Sector 51 escort servicejennyeacort
 
What are the advantages and disadvantages of membrane structures.pptx
What are the advantages and disadvantages of membrane structures.pptxWhat are the advantages and disadvantages of membrane structures.pptx
What are the advantages and disadvantages of membrane structures.pptxwendy cai
 
HARMONY IN THE NATURE AND EXISTENCE - Unit-IV
HARMONY IN THE NATURE AND EXISTENCE - Unit-IVHARMONY IN THE NATURE AND EXISTENCE - Unit-IV
HARMONY IN THE NATURE AND EXISTENCE - Unit-IVRajaP95
 
VIP Call Girls Service Kondapur Hyderabad Call +91-8250192130
VIP Call Girls Service Kondapur Hyderabad Call +91-8250192130VIP Call Girls Service Kondapur Hyderabad Call +91-8250192130
VIP Call Girls Service Kondapur Hyderabad Call +91-8250192130Suhani Kapoor
 
Model Call Girl in Narela Delhi reach out to us at 🔝8264348440🔝
Model Call Girl in Narela Delhi reach out to us at 🔝8264348440🔝Model Call Girl in Narela Delhi reach out to us at 🔝8264348440🔝
Model Call Girl in Narela Delhi reach out to us at 🔝8264348440🔝soniya singh
 
Sachpazis Costas: Geotechnical Engineering: A student's Perspective Introduction
Sachpazis Costas: Geotechnical Engineering: A student's Perspective IntroductionSachpazis Costas: Geotechnical Engineering: A student's Perspective Introduction
Sachpazis Costas: Geotechnical Engineering: A student's Perspective IntroductionDr.Costas Sachpazis
 
Introduction to Microprocesso programming and interfacing.pptx
Introduction to Microprocesso programming and interfacing.pptxIntroduction to Microprocesso programming and interfacing.pptx
Introduction to Microprocesso programming and interfacing.pptxvipinkmenon1
 
Architect Hassan Khalil Portfolio for 2024
Architect Hassan Khalil Portfolio for 2024Architect Hassan Khalil Portfolio for 2024
Architect Hassan Khalil Portfolio for 2024hassan khalil
 
High Profile Call Girls Nagpur Isha Call 7001035870 Meet With Nagpur Escorts
High Profile Call Girls Nagpur Isha Call 7001035870 Meet With Nagpur EscortsHigh Profile Call Girls Nagpur Isha Call 7001035870 Meet With Nagpur Escorts
High Profile Call Girls Nagpur Isha Call 7001035870 Meet With Nagpur Escortsranjana rawat
 
IVE Industry Focused Event - Defence Sector 2024
IVE Industry Focused Event - Defence Sector 2024IVE Industry Focused Event - Defence Sector 2024
IVE Industry Focused Event - Defence Sector 2024Mark Billinghurst
 
Oxy acetylene welding presentation note.
Oxy acetylene welding presentation note.Oxy acetylene welding presentation note.
Oxy acetylene welding presentation note.eptoze12
 
High Profile Call Girls Nagpur Meera Call 7001035870 Meet With Nagpur Escorts
High Profile Call Girls Nagpur Meera Call 7001035870 Meet With Nagpur EscortsHigh Profile Call Girls Nagpur Meera Call 7001035870 Meet With Nagpur Escorts
High Profile Call Girls Nagpur Meera Call 7001035870 Meet With Nagpur EscortsCall Girls in Nagpur High Profile
 
(ANVI) Koregaon Park Call Girls Just Call 7001035870 [ Cash on Delivery ] Pun...
(ANVI) Koregaon Park Call Girls Just Call 7001035870 [ Cash on Delivery ] Pun...(ANVI) Koregaon Park Call Girls Just Call 7001035870 [ Cash on Delivery ] Pun...
(ANVI) Koregaon Park Call Girls Just Call 7001035870 [ Cash on Delivery ] Pun...ranjana rawat
 

Recently uploaded (20)

Study on Air-Water & Water-Water Heat Exchange in a Finned Tube Exchanger
Study on Air-Water & Water-Water Heat Exchange in a Finned Tube ExchangerStudy on Air-Water & Water-Water Heat Exchange in a Finned Tube Exchanger
Study on Air-Water & Water-Water Heat Exchange in a Finned Tube Exchanger
 
chaitra-1.pptx fake news detection using machine learning
chaitra-1.pptx  fake news detection using machine learningchaitra-1.pptx  fake news detection using machine learning
chaitra-1.pptx fake news detection using machine learning
 
Application of Residue Theorem to evaluate real integrations.pptx
Application of Residue Theorem to evaluate real integrations.pptxApplication of Residue Theorem to evaluate real integrations.pptx
Application of Residue Theorem to evaluate real integrations.pptx
 
★ CALL US 9953330565 ( HOT Young Call Girls In Badarpur delhi NCR
★ CALL US 9953330565 ( HOT Young Call Girls In Badarpur delhi NCR★ CALL US 9953330565 ( HOT Young Call Girls In Badarpur delhi NCR
★ CALL US 9953330565 ( HOT Young Call Girls In Badarpur delhi NCR
 
Software and Systems Engineering Standards: Verification and Validation of Sy...
Software and Systems Engineering Standards: Verification and Validation of Sy...Software and Systems Engineering Standards: Verification and Validation of Sy...
Software and Systems Engineering Standards: Verification and Validation of Sy...
 
Gurgaon ✡️9711147426✨Call In girls Gurgaon Sector 51 escort service
Gurgaon ✡️9711147426✨Call In girls Gurgaon Sector 51 escort serviceGurgaon ✡️9711147426✨Call In girls Gurgaon Sector 51 escort service
Gurgaon ✡️9711147426✨Call In girls Gurgaon Sector 51 escort service
 
What are the advantages and disadvantages of membrane structures.pptx
What are the advantages and disadvantages of membrane structures.pptxWhat are the advantages and disadvantages of membrane structures.pptx
What are the advantages and disadvantages of membrane structures.pptx
 
HARMONY IN THE NATURE AND EXISTENCE - Unit-IV
HARMONY IN THE NATURE AND EXISTENCE - Unit-IVHARMONY IN THE NATURE AND EXISTENCE - Unit-IV
HARMONY IN THE NATURE AND EXISTENCE - Unit-IV
 
young call girls in Rajiv Chowk🔝 9953056974 🔝 Delhi escort Service
young call girls in Rajiv Chowk🔝 9953056974 🔝 Delhi escort Serviceyoung call girls in Rajiv Chowk🔝 9953056974 🔝 Delhi escort Service
young call girls in Rajiv Chowk🔝 9953056974 🔝 Delhi escort Service
 
VIP Call Girls Service Kondapur Hyderabad Call +91-8250192130
VIP Call Girls Service Kondapur Hyderabad Call +91-8250192130VIP Call Girls Service Kondapur Hyderabad Call +91-8250192130
VIP Call Girls Service Kondapur Hyderabad Call +91-8250192130
 
Model Call Girl in Narela Delhi reach out to us at 🔝8264348440🔝
Model Call Girl in Narela Delhi reach out to us at 🔝8264348440🔝Model Call Girl in Narela Delhi reach out to us at 🔝8264348440🔝
Model Call Girl in Narela Delhi reach out to us at 🔝8264348440🔝
 
Sachpazis Costas: Geotechnical Engineering: A student's Perspective Introduction
Sachpazis Costas: Geotechnical Engineering: A student's Perspective IntroductionSachpazis Costas: Geotechnical Engineering: A student's Perspective Introduction
Sachpazis Costas: Geotechnical Engineering: A student's Perspective Introduction
 
Introduction to Microprocesso programming and interfacing.pptx
Introduction to Microprocesso programming and interfacing.pptxIntroduction to Microprocesso programming and interfacing.pptx
Introduction to Microprocesso programming and interfacing.pptx
 
Call Us -/9953056974- Call Girls In Vikaspuri-/- Delhi NCR
Call Us -/9953056974- Call Girls In Vikaspuri-/- Delhi NCRCall Us -/9953056974- Call Girls In Vikaspuri-/- Delhi NCR
Call Us -/9953056974- Call Girls In Vikaspuri-/- Delhi NCR
 
Architect Hassan Khalil Portfolio for 2024
Architect Hassan Khalil Portfolio for 2024Architect Hassan Khalil Portfolio for 2024
Architect Hassan Khalil Portfolio for 2024
 
High Profile Call Girls Nagpur Isha Call 7001035870 Meet With Nagpur Escorts
High Profile Call Girls Nagpur Isha Call 7001035870 Meet With Nagpur EscortsHigh Profile Call Girls Nagpur Isha Call 7001035870 Meet With Nagpur Escorts
High Profile Call Girls Nagpur Isha Call 7001035870 Meet With Nagpur Escorts
 
IVE Industry Focused Event - Defence Sector 2024
IVE Industry Focused Event - Defence Sector 2024IVE Industry Focused Event - Defence Sector 2024
IVE Industry Focused Event - Defence Sector 2024
 
Oxy acetylene welding presentation note.
Oxy acetylene welding presentation note.Oxy acetylene welding presentation note.
Oxy acetylene welding presentation note.
 
High Profile Call Girls Nagpur Meera Call 7001035870 Meet With Nagpur Escorts
High Profile Call Girls Nagpur Meera Call 7001035870 Meet With Nagpur EscortsHigh Profile Call Girls Nagpur Meera Call 7001035870 Meet With Nagpur Escorts
High Profile Call Girls Nagpur Meera Call 7001035870 Meet With Nagpur Escorts
 
(ANVI) Koregaon Park Call Girls Just Call 7001035870 [ Cash on Delivery ] Pun...
(ANVI) Koregaon Park Call Girls Just Call 7001035870 [ Cash on Delivery ] Pun...(ANVI) Koregaon Park Call Girls Just Call 7001035870 [ Cash on Delivery ] Pun...
(ANVI) Koregaon Park Call Girls Just Call 7001035870 [ Cash on Delivery ] Pun...
 

Parametric Regression Modeling and Nonparametric Tests

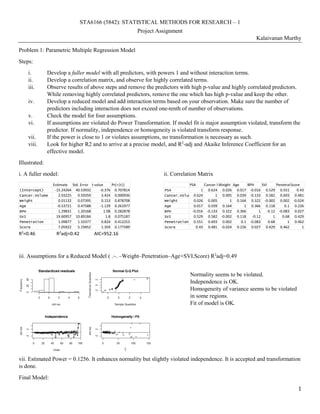
  • 1. 1 STA6166 (5842): STATISTICAL METHODS FOR RESEARCH – 1 Project Assignment Kalaivanan Murthy Problem 1: Parametric Multiple Regression Model Steps: i. Develop a fuller model with all predictors, with powers 1 and without interaction terms. ii. Develop a correlation matrix, and observe for highly correlated terms. iii. Observe results of above steps and remove the predictors with high p-value and highly correlated predictors. While removing highly correlated predictors, remove the one which has high p-value and keep the other. iv. Develop a reduced model and add interaction terms based on your observation. Make sure the number of predictors including interaction does not exceed one-tenth of number of observations. v. Check the model for four assumptions. vi. If assumptions are violated do Power Transformation. If model fit is major assumption violated, transform the predictor. If normality, independence or homogeneity is violated transform response. vii. If the power is close to 1 or violates assumptions, no transformation is necessary as such. viii. Look for higher R2 and to arrive at a precise model, and R2 -adj and Akaike Inference Coefficient for an effective model. Illustrated: i. A fuller model: R2 =0.46 R2 adj=0.42 AIC=952.16 ii. Correlation Matrix iii. Assumptions for a Reduced Model ( .~. –Weight–Penetration–Age+SVI.Score) R2 adj=0.49 Normality seems to be violated. Independence is OK. Homogeneity of variance seems to be violated in some regions. Fit of model is OK. vii. Estimated Power = 0.1256. It enhances normality but slightly violated independence. It is accepted and transformation is done. Final Model: Estimate Std. Error t value Pr(>|t|) (Intercept) -15.24264 40.53932 -0.376 0.707814 Cancer.Volume 2.03225 0.59359 3.424 0.000936 Weight 0.01132 0.07395 0.153 0.878708 Age -0.53721 0.47588 -1.129 0.261977 BPH 1.29831 1.20168 1.08 0.282878 SVI 19.60957 10.89184 1.8 0.075187 Penetration 1.09877 1.33377 0.824 0.412253 Score 7.05922 5.19452 1.359 0.177589 PSA Cancer.VolumeWeight Age BPH SVI PenetrationScore PSA 1 0.624 0.026 0.017 -0.016 0.529 0.551 0.43 Cancer.Volume 0.624 1 0.005 0.039 -0.133 0.582 0.693 0.481 Weight 0.026 0.005 1 0.164 0.322 -0.002 0.002 -0.024 Age 0.017 0.039 0.164 1 0.366 0.118 0.1 0.226 BPH -0.016 -0.133 0.322 0.366 1 -0.12 -0.083 0.027 SVI 0.529 0.582 -0.002 0.118 -0.12 1 0.68 0.429 Penetration 0.551 0.693 0.002 0.1 -0.083 0.68 1 0.462 Score 0.43 0.481 -0.024 0.226 0.027 0.429 0.462 1
  • 2. 2 ln (PSA) = -1.156 + 0.092*Cancer.Volume - 0.03*Penetration + 0.489*Score - 0.919*SVI + 0.268*Score*SVI This has an R2 =0.57 R2 -adj=0.55 AIC=298.1 (lowest) λ=0.1256 Prediction Interval: ln (PSA) = (0.352, 3.994) [PSA] – mg/ml. Point estimate for the given data: ln(PSA) = 2.173 ln(mg/ml) Problem-2: Parametric Completely Random Design Steps: i. Read the data and sort it to two columns: values and treatment. If the lengths are different, use factor argument in data.frame. ii. Check for distribution by qq-plot. If normal, use parametric procedures. If not, use non-parametric. iii. Create an analysis of variance table. iv. Check for four assumptions: normality, independence, homogeneity, fit. If follows, model is valid. v. Compare pairwise treatment and check if ‘0’ is in interval. If yes, then means differ (statistically). vi. The data is found to be normal. Bonferroni and Tukey’s method at 95% confidence interval is used here. iii. Analysis of Variance Table iv. Model Validity: Check for Assumptions v. Pairwise Treatment  Bonferroni (level of significance=5%)  Tukey (level of significance=5%) From the analysis, it is observed that difference in sorption rates exist for following treatments:  Aromatics and Esters (observed in both)  Chloroalkanes and Esters (observed only in Bonferroni) 𝐴 𝐶̅̅̅̅̅ 𝐸 Response: S.Rate Df Sum Sq Mean Sq F value Pr(>F) Solvent 2 3.3054 1.65270 24.512 5.855e-07 *** Residuals 29 1.9553 0.06743 --- Signif. codes: 0 ‘***’ 0.001 ‘**’ 0.01 ‘*’ 0.05 ‘.’ 0.1 ‘ ’ 1 [1] "95 % Pairwise CIs" Diff. Lower Upper Differ? A - C -0.064 -0.385 0.257 0 A - E 0.612 0.334 0.890 1 C - E 0.676 0.387 0.965 1 Tukey multiple comparisons of means 95% family-wise confidence level Fit: aov(formula = S.Rate ~ Solvent, data = io) $Solvent diff lwr upr p adj C-A 0.06402778 -0.2475781 0.3756337 0.8683140 E-A -0.61222222 -0.8826095 -0.3418350 0.0000143 E-C -0.67625000 -0.9570006 -0.3954994 0.0000054
  • 3. 3 In Bonferroni's, Chloroalkanes and Esters are found to differ. But in Tukey’s, it is not. Since Bonferroni’s is more conservative, we adopt it for conclusion. Unit: mole percentage Problem-3: Nonparametric Randomized Block Design Steps: i. Determine the factor (treatment) and the block. Here a machine is assigned to an operator, Machine is taken as block and Operator is taken as treatment. However to the problem requires to check for both cases. ii. Create a dataframe and arrange the values at given levels (also known as factors). iii. Make an anova table to find if treatments differ, atleast one. iv. If the sample size is too small, adopt a non-parametric test. (Friedman’s test is done here) v. Use the function friedman.test or friedman.test2. vi. Check if zero is in the interval. If yes, then the factors do not differ. ii. Dataframe with levels/factors: iii. Analysis of Variance Table At level of significance=10%, the Machine and Operator treatment differs. v. Friedman Nonparametric Test  Observation as Factor  Machine as Factor From the analysis, it is observed that the difference in Time exist for following treatments:  Operator: 1-5, 1-6, 2-5, 2-6  Machine: 1-4, 2-3, 2-4 𝑂2 𝑂1̅̅̅̅̅̅̅̅̅ 𝑂3 𝑂4̅̅̅̅̅̅̅̅ 𝑂6 𝑂5 𝑀1 𝑀2̅̅̅̅̅̅̅̅̅̅ 𝑀3̅̅̅̅ 𝑀4 [Time]: s Operator Machine O1 O2 O3 O4 O5 O6 M1 42.5 39.3 39.6 39.9 42.9 43.6 M2 39.8 40.1 40.5 42.3 42.5 43.1 M3 40.2 40.5 41.3 43.4 44.9 45.1 M4 41.3 42.2 43.5 44.2 45.9 42.3 Df Sum Sq Mean Sq F value Pr(>F) Machine 3 15.92 5.308 3.339 0.04790 * Operator 5 42.09 8.417 5.294 0.00533 ** Residuals 15 23.85 1.590 --- Signif. codes: 0 ‘***’ 0.001 ‘**’ 0.01 ‘*’ 0.05 ‘.’ 0.1 ‘ ’ 1 [1] "90 % Pairwise CIs on rank sums" Difference Lower Upper Differ? O1 - O2 0 -9.9522 9.9522 0 O1 - O3 -5 -14.9522 4.9522 0 O1 - O4 -9 -18.9522 0.9522 0 O1 - O5 -14 -23.9522 -4.0478 1 O1 - O6 -14 -23.9522 -4.0478 1 O2 - O3 -5 -14.9522 4.9522 0 O2 - O4 -9 -18.9522 0.9522 0 O2 - O5 -14 -23.9522 -4.0478 1 O2 - O6 -14 -23.9522 -4.0478 1 O3 - O4 -4 -13.9522 5.9522 0 O3 - O5 -9 -18.9522 0.9522 0 O3 - O6 -9 -18.9522 0.9522 0 O4 - O5 -5 -14.9522 4.9522 0 O4 - O6 -5 -14.9522 4.9522 0 O5 - O6 0 -9.9522 9.9522 0 Friedman TS: 14.57143 on df= 5 with p-value= 0.01235945443 [1] "90 % Pairwise CIs on rank sums" Difference Lower Upper Differ? M1 - M2 2 -4.4378 8.4378 0 M1 - M3 -6 -12.4378 0.4378 0 M1 - M4 -8 -14.4378 -1.5622 1 M2 - M3 -8 -14.4378 -1.5622 1 M2 - M4 -10 -16.4378 -3.5622 1 M3 - M4 -2 -8.4378 4.4378 0 Friedman TS: 6.80 on df= 3 with p-value= 0.07855315984
  • 4. 4 Program in R: #PROBLEM-1:MULTIPLE REGRESSION MODEL alcohol=read.csv("C:/Users/Kalaivanan Murthy/Desktop/Project Data/P1.csv",header=T) ls.str(alcohol) View(alcohol) #NAIVE MODEL vintage=lm(PSA~Cancer.Volume+Weight+Age+BPH+ SVI+Penetration+Score,data=alcohol) summary(vintage) AIC(vintage) #CORRELATION round(cor(alcohol[c("PSA","Cancer.Volume","W eight","Age", "BPH","SVI","Penetration","Score")]),3) #UPDATE MODEL vintage.new=update(vintage,.~. -Weight- Penetration-Age+SVI*Score) summary(vintage.new) AIC(vintage.new) #CHECK ASSUMPTIONS source("http://www.stat.ufl.edu/~athienit/ch eck.R") check(vintage.new,tests=T) #TRY TRANSFORMATION library(car) red.wine=powerTransform(vintage.new) summary(red.wine) PSA.new=bcPower(alcohol$PSA,0.1118) vintage.transform=update(vintage.new, .~. - PSA+PSA.new) summary(vintage.transform) AIC(vintage.transform) check(vintage.transform,tests=T) #TRY HIGHER ORDER TERMS Score.new=bcPower(alcohol$Score,2) vintage.x=update(vintage.new, .~. - Score+Score.new-SVI:Score+SVI:Score.new) summary(vintage.x) check(vintage.x,tests=T) #PREDICTION INTERVALS predict.lm(vintage.x,newdata=data.frame(Canc er.Volume=4.2633,Weight=22.783, Age=68,BPH=1.3500,SVI=0,Penetration=0,Score. new=36), interval="prediction",level=0.90,se.fit=F) #PROBLEM-2:PARAMETRIC COMPLETELY RANDOM DESIGN jupiter.moon=read.csv("C:/Users/Kalaivanan Murthy/Desktop/Project Data/P2.csv",header=T) ls.str(jupiter.moon) attach(jupiter.moon) A=Aromatics[!is.na(Aromatics)]; length(Aromatics) C=Chloroalkanes[!is.na(Chloroalkanes)]; length (Chloroalkanes) E=Esters[!is.na(Esters)]; length(Esters) #CHECK FOR NORMALITY qqnorm(A,datax=T); qqline(A,datax=T) qqnorm(C,datax=T); qqline(C,datax=T) qqnorm(E,datax=T); qqline(E,datax=T) #CREATE NEW DATAFRAME & ANOVA TABLE io=data.frame(S.Rate=c(A,C,E), Solvent=factor(rep(c("A","C","E"), times=c(length(A),length(C),length(E))))) callisto=aov(S.Rate~Solvent,data=io) anova(callisto) #QUESTION: Sou:Internet: 'Callisto' is already aov table. why is done again? summary(callisto) #BONFERRONI ANALYSIS source("http://www.stat.ufl.edu/~athienit/Bo nf.R") Bonf(S.Rate~Solvent,data=io) #TUKEY ANALYSIS ganymede=TukeyHSD(callisto) print(ganymede) #CHECK ASSUMPTIONS source("http://www.stat.ufl.edu/~athienit/ch eck.R") check(callisto)
  • 5. 5 #PROBLEM-3: NONPARAMETRIC RANDOMIZED BLOCK DESIGN milky.way=read.csv("C:/Users/Kalaivanan Murthy/Desktop/Project Data/P3.csv",header=T) print(milky.way) attach(milky.way) #DATAFRAME & LEVELS andromeda=data.frame(Time=c(O1,O2,O3,O4,O5,O 6), Operator=factor(rep(c("O1","O2","O3","O4","O 5","O6"),each=4)), Machine=factor(rep(c("M1","M2","M3","M4")))) attach(andromeda) tadpole=aov(Time~Machine+Operator) summary(tadpole) xtabs(Time~Machine+Operator,data=andromeda) #RANK MATRIX lmc.rank=tapply(Time,Machine,rank); print(lmc.rank) lmc.table=matrix(0,4,6,dimnames=list(c(),c(" O1","O2","O3","O4","O5","O6"))) for(i in 1:4){ lmc.table[i,]=lmc.rank[[i]] } print(lmc.table) #FRIEDMAN TEST friedman.test(Time~Operator|Machine, data=andromeda) #FRIEDMAN TEST-2 (DR.ATHIENITIS) source("http://www.stat.ufl.edu/~athienit/fr iedman.test2.R") friedman.test2(Time~Operator|Machine,mc=TRUE ,data=andromeda,level=0.90) friedman.test2(Time~Machine|Operator,mc=TRUE ,data=andromeda,level=0.90)
  • 6. 1. A university medical center urology group was interested in modeling prostate-specific antigen (PSA) and a number of prognostic clinical measurements in men with advanced prostate cancer. Data were collected on 97 men who were about to undergo radical prostectomies. http://www.stat.ufl.edu/~athienit/STA6166/assignment3_1.txt Each line of the data set ha an identification number and provides information on 8 other variables Variable Number Variable Name Description 1 ID number 1-97 2 PSA level Serum prostate-specific antigen level (mg/ml) 3 Cancer volume Estimate of prostate cancer volume (cc) 4 Weight Prostate weight (gramms) 5 Age Age of patient (years) 6 Benign prostatic hyperplasia Amount of benign prostatic hyperplasia (cm2 ) 7 Seminal vesicle in- vasion Presence of seminal vesicle invasion: 1 yes; 0 otherwise 8 Capsular penetra- tion Degree of capsular penetration (cm) 9 Gleason score Pathologically determined grade of disease. (Scores were either 6, 7, or 8 with higher scores indicating worse prognosis) Develop a “best” model for predicting PSA and interpret. In addition, create a 90% prediction interval for PSA levels for an individual who has the following values. Variable Number Variable Name Value 3 Cancer volume 4.2633 4 Weight 22.783 5 Age 68 6 Benign prostatic hyperplasia 1.3500 7 Seminal vesicle invasion 0 8 Capsular penetration 0 9 Gleason score 6 Problem Statement 6
  • 7. 2. Three chemical cleaning solvents are a potential hazardous waste. Independent samples of solvents from each type were tested and their sorption rates were recorded as a mole percentage. Aromatics Chloroalkanes Esters 1.06 0.95 1.58 1.12 0.29 0.43 0.06 0.79 0.65 1.45 0.91 0.06 0.51 0.09 0.82 1.15 0.57 0.83 0.44 0.10 0.17 0.89 1.12 1.16 0.43 0.55 0.53 0.17 1.05 0.61 0.34 0.60 Analyze the dataset (using appropriate methodology) and determine if there are dif- ferences in the mean sorption rate. If so, what are the differences? 3. Four different machines are being considered in an assembly plant. It is decided that 6 different operators are to be used in a randomized block experiment. The machines are assigned in a random order to each operator. The amount of time (in seconds) were recorded: Operator Machine 1 2 3 4 5 6 1 42.5 39.3 39.6 39.9 42.9 43.6 2 39.8 40.1 40.5 42.3 42.5 43.1 3 40.2 40.5 41.3 43.4 44.9 45.1 4 41.3 42.2 43.5 44.2 45.9 42.3 Do the machines perform at the same rate using α = 0.10? If not, which differ, by how much, etc. Give a complete analysis. Does the operator play a significant effect? Explain. 7