SlideShare a Scribd company logo
1 of 11
Download to read offline
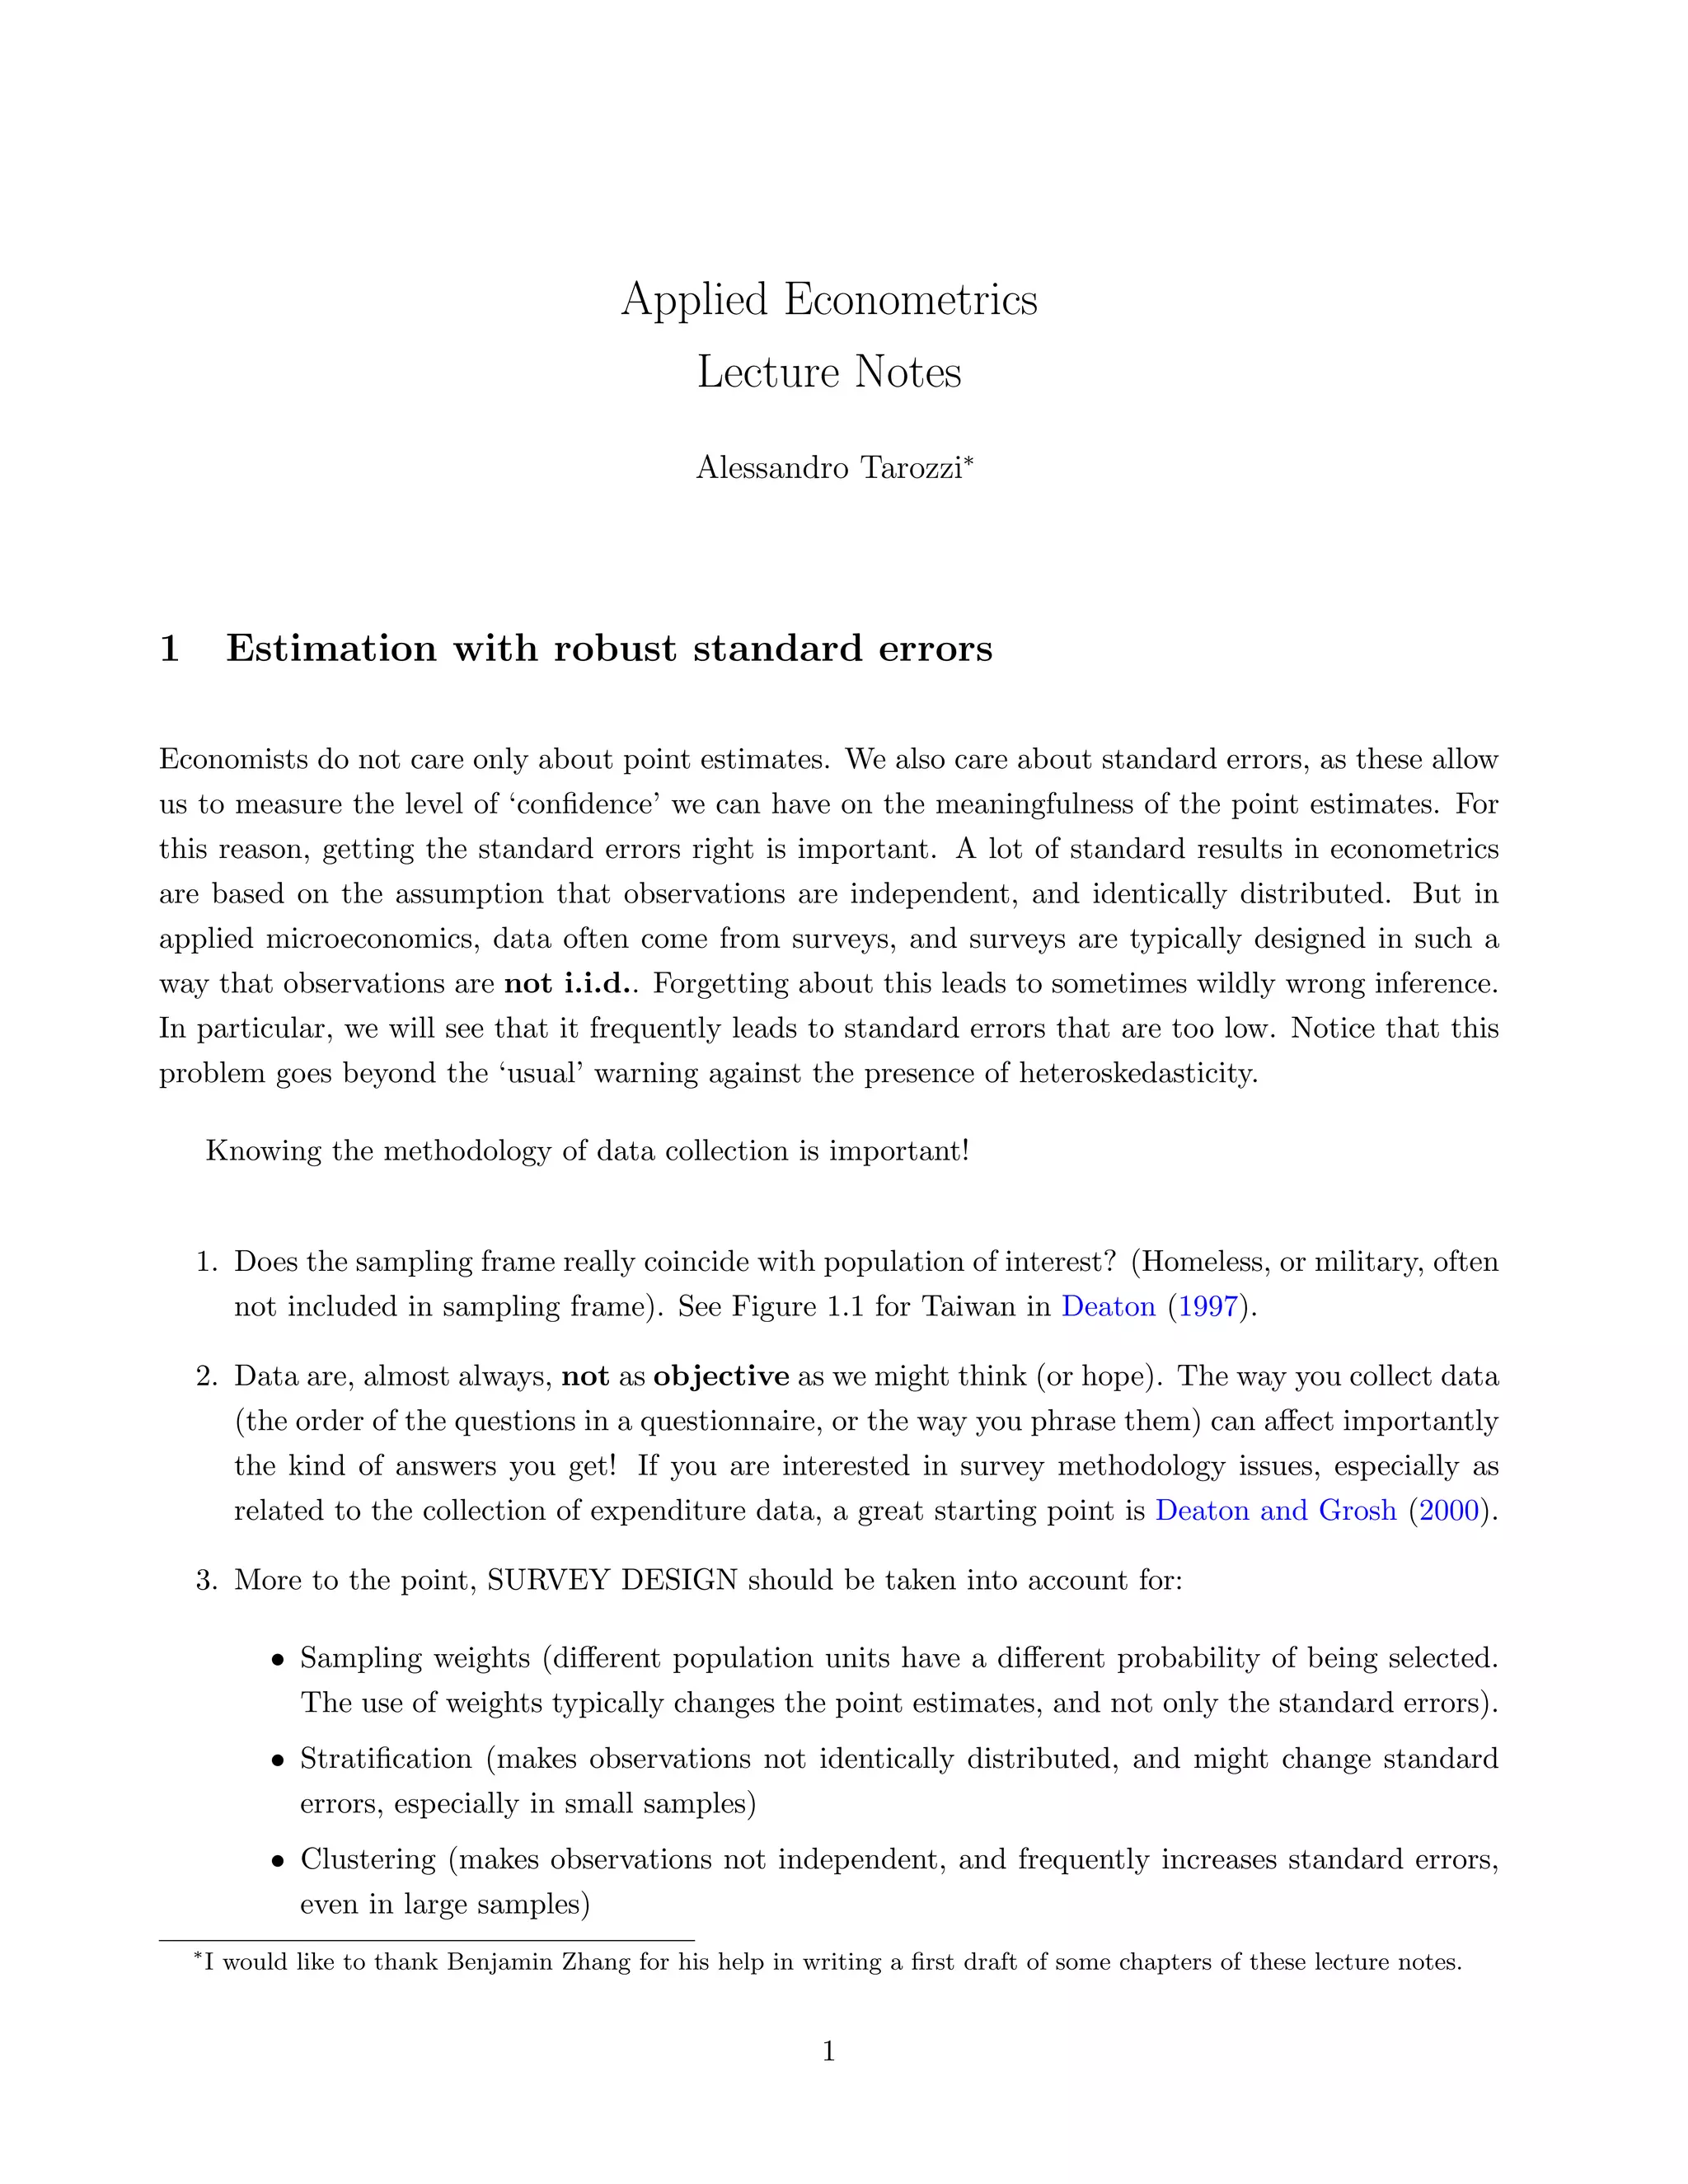
Applied Econometrics
                                                    Lecture Notes
                                                    Alessandro Tarozzi∗


1        Estimation with robust standard errors

Economists do not care only about point estimates. We also care about standard errors, as these allow
us to measure the level of ‘confidence’ we can have on the meaningfulness of the point estimates. For
this reason, getting the standard errors right is important. A lot of standard results in econometrics
are based on the assumption that observations are independent, and identically distributed. But in
applied microeconomics, data often come from surveys, and surveys are typically designed in such a
way that observations are not i.i.d.. Forgetting about this leads to sometimes wildly wrong inference.
In particular, we will see that it frequently leads to standard errors that are too low. Notice that this
problem goes beyond the ‘usual’ warning against the presence of heteroskedasticity.

        Knowing the methodology of data collection is important!


    1. Does the sampling frame really coincide with population of interest? (Homeless, or military, often
       not included in sampling frame). See Figure 1.1 for Taiwan in Deaton (1997).

    2. Data are, almost always, not as objective as we might think (or hope). The way you collect data
       (the order of the questions in a questionnaire, or the way you phrase them) can affect importantly
       the kind of answers you get! If you are interested in survey methodology issues, especially as
       related to the collection of expenditure data, a great starting point is Deaton and Grosh (2000).

    3. More to the point, SURVEY DESIGN should be taken into account for:

             • Sampling weights (different population units have a different probability of being selected.
               The use of weights typically changes the point estimates, and not only the standard errors).
             • Stratification (makes observations not identically distributed, and might change standard
               errors, especially in small samples)
             • Clustering (makes observations not independent, and frequently increases standard errors,
               even in large samples)
    ∗
        I would like to thank Benjamin Zhang for his help in writing a first draft of some chapters of these lecture notes.


                                                               1
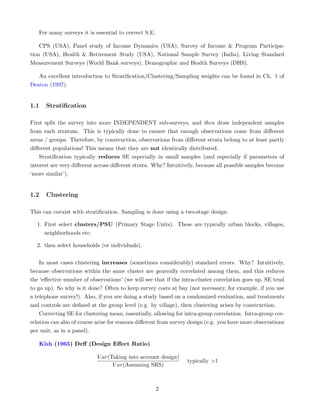
For many surveys it is essential to correct S.E.

    CPS (USA), Panel study of Income Dynamics (USA), Survey of Income & Program Participa-
tion (USA), Health & Retirement Study (USA), National Sample Survey (India), Living Standard
Measurement Surveys (World Bank surveys), Demographic and Health Surveys (DHS).

   An excellent introduction to Stratification/Clustering/Sampling weights can be found in Ch. 1 of
Deaton (1997).


1.1   Stratification

First split the survey into more INDEPENDENT sub-surveys, and then draw independent samples
from each stratum. This is typically done to ensure that enough observations come from different
areas / groups. Therefore, by construction, observations from different strata belong to at least partly
different populations! This means that they are not identically distributed.
    Stratification typically reduces SE especially in small samples (and especially if parameters of
interest are very different across different strata. Why? Intuitively, because all possible samples become
‘more similar’).


1.2   Clustering

This can coexist with stratification. Sampling is done using a two-stage design:

  1. First select clusters/PSU (Primary Stage Units). These are typically urban blocks, villages,
     neighborhoods etc.

  2. then select households (or individuals).


    In most cases clustering increases (sometimes considerably) standard errors. Why? Intuitively,
because observations within the same cluster are generally correlated among them, and this reduces
the ‘effective number of observations’ (we will see that if the intra-cluster correlation goes up, SE tend
to go up). So why is it done? Often to keep survey costs at bay (not necessary, for example, if you use
a telephone survey!). Also, if you are doing a study based on a randomized evaluation, and treatments
and controls are defined at the group level (e.g. by village), then clustering arises by construction.
    Correcting SE for clustering mean, essentially, allowing for intra-group correlation. Intra-group cor-
relation can also of course arise for reasons different from survey design (e.g. you have more observations
per unit, as in a panel).

   Kish (1965) Deff (Design Effect Ratio)

                           V ar(Taking into account design)
                                                                 typically >1
                                 V ar(Assuming SRS)


                                                      2
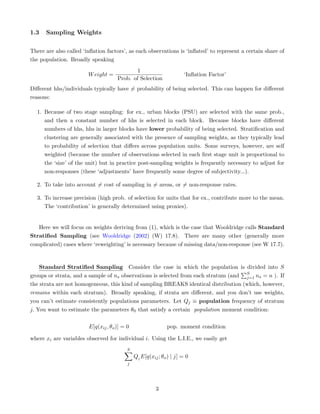
1.3   Sampling Weights

There are also called ‘inflation factors’, as each observations is ‘inflated’ to represent a certain share of
the population. Broadly speaking
                                             1
                        W eight =                                     ‘Inflation Factor’
                                     Prob. of Selection
Different hhs/individuals typically have = probability of being selected. This can happen for different
reasons:

  1. Because of two stage sampling: for ex., urban blocks (PSU) are selected with the same prob.,
     and then a constant number of hhs is selected in each block. Because blocks have different
     numbers of hhs, hhs in larger blocks have lower probability of being selected. Stratification and
     clustering are generally associated with the presence of sampling weights, as they typically lead
     to probability of selection that differs across population units. Some surveys, however, are self
     weighted (because the number of observations selected in each first stage unit is proportional to
     the ‘size’ of the unit) but in practice post-sampling weights is frequently necessary to adjust for
     non-responses (these ‘adjustments’ have frequently some degree of subjectivity...).

  2. To take into account = cost of sampling in = areas, or = non-response rates.

  3. To increase precision (high prob. of selection for units that for ex., contribute more to the mean.
     The ‘contribution’ is generally determined using proxies).


   Here we will focus on weights deriving from (1), which is the case that Wooldridge calls Standard
Stratified Sampling (see Wooldridge (2002) (W) 17.8). There are many other (generally more
complicated) cases where ‘reweighting’ is necessary because of missing data/non-response (see W 17.7).


    Standard Stratified Sampling Consider the case in which the population is divided into S
groups or strata, and a sample of ns observations is selected from each stratum (and S ns = n ). If
                                                                                     j=1
the strata are not homogeneous, this kind of sampling BREAKS identical distribution (which, however,
remains within each stratum). Broadly speaking, if strata are different, and you don’t use weights,
you can’t estimate consistently populations parameters. Let Qj ≡ population frequency of stratum
j. You want to estimate the parameters θ0 that satisfy a certain population moment condition:

                        E[q(xij , θo )] = 0                  pop. moment condition

where xi are variables observed for individual i. Using the L.I.E., we easily get
                                          S
                                              Qj E[q(xij ; θo ) | j] = 0
                                          j


                                                        3
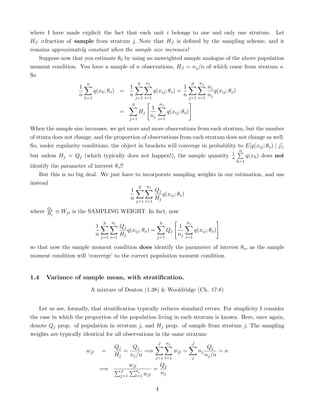
where I have made explicit the fact that each unit i belongs to one and only one stratum. Let
HJ ≡fraction of sample from stratum j. Note that HJ is defined by the sampling scheme, and it
remains approximately constant when the sample size increases!
   Suppose now that you estimate θ0 by using an unweighted sample analogue of the above population
moment condition. You have a sample of n observations, HJ = nj /n of which come from stratum s.
So
                          n                              S    nj                                 S     nj
                     1                             1                               1                         nj
                               q(xh ; θo ) =                        q(xij ; θo ) =                              q(xij ; θo )
                     n                             n                               n                         nj
                         h=1                            j=1 i=1                               j=1 i=1
                                                    S                       nj
                                                                   1
                                             =           Hj                      q(xij ; θo )
                                                                   nj
                                                   j=1                  i=1

When the sample size increases, we get more and more observations from each stratum, but the number
of strata does not change, and the proportion of observations from each stratum does not change as well.
So, under regularity conditions, the object in brackets will converge in probability to E[q(xij ; θo ) | j],
                                                                                                                                n
                                                                                                                          1
but unless Hj = Qj (which typically does not happen!), the sample quantity                                                n          q(xh ) does not
                                                                                                                               h=1
identify the parameter of interest θo !!
    But this is no big deal. We just have to incorporate sampling weights in our estimation, and use
instead
                                           S nj
                                         1        Qj
                                                     q(xij ; θo )
                                         n        Hj
                                                        j=1 i=1
        Qj
where   Hj   ≡ Wji is the SAMPLING WEIGHT. In fact, now

                                    S   nj                                  S               nj
                               1             Qj                                        1
                                                q(xij ; θo ) =                   Qj                  q(xij ; θo )
                               n             Hj                                        nj
                                   j=1 i=1                              j=1                 i=1

so that now the sample moment condition does identify the parameter of interest θo , as the sample
moment condition will ‘converge’ to the correct population moment condition.


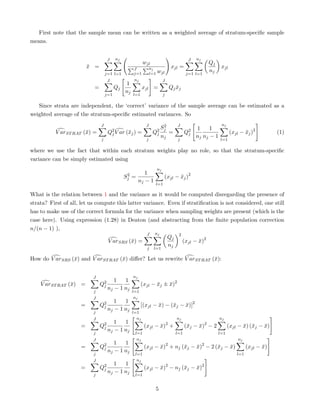
1.4     Variance of sample mean, with stratification.
                              A mixture of Deaton (1.38) & Wooldridge (Ch. 17.8)


   Let us see, formally, that stratification typically reduces standard errors. For simplicity I consider
the case in which the proportion of the population living in each stratum is known. Here, once again,
denote Qj prop. of population in stratum j, and Hj prop. of sample from stratum j. The sampling
weights are typically identical for all observations in the same stratum:
                                                                        J        nj              J
                                         Qj    Qj                                                            Qj
                         wjl       =        =       =⇒                                wjl =            nj         =n
                                         Hj   nj /n                                                         nj /n
                                                                     j=1 l=1                     j
                                                   wjl                      Qj
                                   =⇒        J          nj          =
                                             j=1        l=1 wjl
                                                                            nj

                                                                        4
First note that the sample mean can be written as a weighted average of stratum-specific sample
means.


                                    J    nj                                              J   nj
                                                          wjl                                             Qj
                         x =
                         ¯                         J           nj              xjl =                            xjl
                                                   j=1         l=1 wjl
                                                                                                          nj
                                   j=1 l=1                                              j=1 l=1
                                    J               nj                 J
                                              1
                           =             Qj               xjl =                Qj xj
                                                                                  ¯
                                              nj
                                   j=1             l=1                 j

   Since strata are independent, the ‘correct’ variance of the sample average can be estimated as a
weighted average of the stratum-specific estimated variances. So
                               J                           J           2          J                             nj
                                                                      Sj                     1     1
          V arST RAT (¯) =
                      x             Q2 V
                                     j     ar (¯j ) =
                                               x                Q2
                                                                 j       =             Q2
                                                                                        j                             (xjl − xj )2
                                                                                                                             ¯             (1)
                                                                      nj                     nj nj − 1
                               j                           j                      j                            l=1

where we use the fact that within each stratum weights play no role, so that the stratum-specific
variance can be simply estimated using
                                                                  nj
                                                        1
                                               2
                                              Sj   =                    (xjl − xj )2
                                                                               ¯
                                                     nj − 1
                                                                  l=1

What is the relation between 1 and the variance as it would be computed disregarding the presence of
strata? First of all, let us compute this latter variance. Even if stratification is not considered, one still
has to make use of the correct formula for the variance when sampling weights are present (which is the
case here). Using expression (1.28) in Deaton (and abstracting from the finite population correction
n/(n − 1) ),
                                                           J     nj                2
                                                                           Qj
                                    V arSRS (¯) =
                                             x                                         (xjl − x)2
                                                                                              ¯
                                                                           nj
                                                           j     l=1

How do V arSRS (¯) and V arST RAT (¯) differ? Let us rewrite V arST RAT (¯):
                x                  x                                    x


                           J                       nj
                                       1   1
    V arST RAT (¯) =
                x              Q2
                                j                        (xjl − xj ± x)2
                                                                ¯    ¯
                                    nj − 1 nj
                           j                       l=1
                           J                        nj
                                       1   1
                     =         Q2
                                j                        [(xjl − x) − (¯j − x)]2
                                                                 ¯     x    ¯
                                    nj − 1 nj
                           j                       l=1
                           J                         nj                           nj                           nj
                                       1   1                               2                          2
                     =         Q2
                                j                         (xjl − x) +
                                                                 ¯                     (¯j − x) − 2
                                                                                        x    ¯                       (xjl − x) (¯j − x)
                                                                                                                            ¯ x      ¯
                                    nj − 1 nj
                           j                        l=1                          l=1                           l=1
                           J                         nj                                                                   nj
                                       1   1                               2                      2
                     =         Q2
                                j                         (xjl − x) + nj (¯j − x) − 2 (¯j − x)
                                                                 ¯        x    ¯       x    ¯                                  (xjl − x)
                                                                                                                                      ¯
                                    nj − 1 nj
                           j                        l=1                                                                  l=1
                           J                         nj
                                       1   1
                     =         Q2
                                j                         (xjl − x)2 − nj (¯j − x)2
                                                                 ¯         x    ¯
                                    nj − 1 nj
                           j                        l=1


                                                                  5
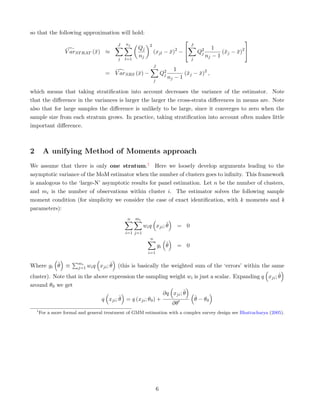
so that the following approximation will hold:
                                                                                                                
                                           J   nj            2                           J
                                                      Qj                                           1
                   V arST RAT (¯) ≈
                               x                                 (xjl − x)2 − 
                                                                        ¯                    Q2
                                                                                              j        (¯j − x)2 
                                                                                                        x    ¯
                                                      nj                                        nj − 1
                                           j   l=1                                       j
                                                                 J
                                                                                 1
                                      = V arSRS (¯) −
                                                 x                       Q2
                                                                          j          (¯j − x)2 ,
                                                                                      x    ¯
                                                                              nj − 1
                                                                 j

which means that taking stratification into account decreases the variance of the estimator. Note
that the difference in the variances is larger the larger the cross-strata differences in means are. Note
also that for large samples the difference is unlikely to be large, since it converges to zero when the
sample size from each stratum grows. In practice, taking stratification into account often makes little
important difference.


2        A unifying Method of Moments approach
We assume that there is only one stratum.1 Here we loosely develop arguments leading to the
asymptotic variance of the MoM estimator when the number of clusters goes to infinity. This framework
is analogous to the ‘large-N’ asymptotic results for panel estimation. Let n be the number of clusters,
and mi is the number of observations within cluster i. The estimator solves the following sample
moment condition (for simplicity we consider the case of exact identification, with k moments and k
parameters):
                                                n    mi
                                                          wi q xji ; ˆ
                                                                     θ            = 0
                                               i=1 j=1
                                                             n
                                                                     gi ˆ
                                                                        θ         = 0
                                                            i=1

                         mi
Where gi ˆ ≡
         θ               j=1 wi q   xji ; ˆ (this is basically the weighted sum of the ‘errors’ within the same
                                          θ
cluster). Note that in the above expression the sampling weight wi is just a scalar. Expanding q xji ; ˆ
                                                                                                       θ
around θ0 we get
                                                          ∂q xji ; ˜
                                                                   θ
                              q xji ; ˆ = q (xji ; θ0 ) +
                                      θ                              ˆ − θ0
                                                                     θ
                                                             ∂θ
    1
        For a more formal and general treatment of GMM estimation with a complex survey design see Bhattacharya (2005).


                                                                     6
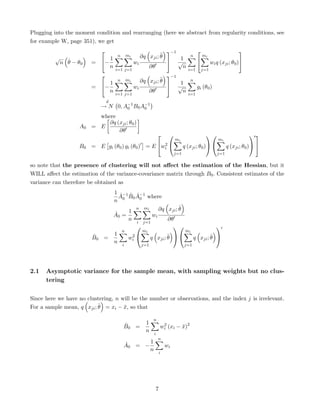
Plugging into the moment condition and rearranging (here we abstract from regularity conditions, see
for example W, page 351), we get
                                                                             −1                                        
          √                   1
                                         n       mi        ∂q xji ; ˜
                                                                    θ                1
                                                                                            n        mi
              n ˆ − θ0
                θ        = −                         wi                           √                     wi q (xji ; θ0 )
                              n                                  ∂θ                   n
                                     i=1 j=1                                               i=1       j=1
                                                                             −1
                              1
                                         n       mi        ∂q xji ; ˜
                                                                    θ                1
                                                                                            n
                         = −                         wi                           √            gi (θ0 )
                              n                                  ∂θ                   n
                                     i=1 j=1                                               i=1
                                 d
                             → N 0, A−1 B0 A−1
                                     0      0

                           where
                              ∂q (xji ; θ0 )
                    A0   = E
                                  ∂θ
                                                                                                                           
                                                                                   mi                          mi
                                                   2
                    B0 = E gi (θ0 ) gi (θ0 ) = E wi                                    q (xji ; θ0 )            q (xji ; θ0 ) 
                                                                                   j=1                        j=1

so note that the presence of clustering will not affect the estimation of the Hessian, but it
WILL affect the estimation of the variance-covariance matrix through B0 . Consistent estimates of the
variance can therefore be obtained as
                                     1 ˆ−1 ˆ ˆ−1
                                      A B0 A0 where
                                     n 0
                                          1
                                                       n    mi         ∂q xji ; ˆ
                                                                                θ
                                     ˆ
                                     A0 =                         wi
                                          n                                    ∂θ
                                                       i    j=1
                                                                                                           
                                             n              mi                            mi
                                     1
                         ˆ
                         B0 =                      2
                                                  wi            q xji ; ˆ  
                                                                         θ                      q xji ; ˆ 
                                                                                                        θ
                                     n
                                             i             j=1                           j=1


2.1   Asymptotic variance for the sample mean, with sampling weights but no clus-
      tering

Since here we have no clustering, n will be the number or observations, and the index j is irrelevant.
For a sample mean, q xji ; ˆ = xi − x, so that
                           θ         ¯

                                                                  n
                                                             1
                                             ˆ
                                             B0 =                         wi (xi − x)2
                                                                           2
                                                                                   ¯
                                                             n
                                                                  i
                                                                       n
                                             ˆ      1
                                             A0 = −                           wi
                                                    n
                                                                          i


                                                                      7
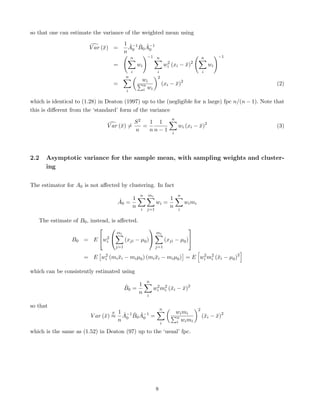
so that one can estimate the variance of the weighted mean using
                                            1 ˆ−1 ˆ ˆ−1
                        V ar (¯) =
                              x              A B0 A0
                                            n 0
                                                n        −1 n                                     n        −1
                                                                          2             2
                                  =                 wi                   wi (xi   − x)
                                                                                    ¯                 wi
                                                i                i                                i
                                            n                    2
                                                      wi
                                  =                   n              (xi − x)2
                                                                           ¯                                    (2)
                                            i         i wi

which is identical to (1.28) in Deaton (1997) up to the (negligible for n large) fpc n/(n − 1). Note that
this is different from the ‘standard’ form of the variance
                                                                            n
                                                    S2   1 1
                               V ar (¯) =
                                     x                 =                          wi (xi − x)2
                                                                                           ¯                    (3)
                                                    n    nn−1
                                                                            i


2.2   Asymptotic variance for the sample mean, with sampling weights and cluster-
      ing

The estimator for A0 is not affected by clustering. In fact
                                                     n   mi                     n
                                      ˆ    1                               1
                                      A0 =                       wi =                 wi mi
                                           n                               n
                                                     i   j=1                      i

   The estimate of B0 , instead, is affected.
                                                                                    
                                      mi                         mi
                          2
                 B0 = E wi                (xji − µ0 )                 (xji − µ0 )
                                      j=1                        j=1

                      = E wi (mi xi − mi µ0 ) (mi xi − mi µ0 ) = E wi m2 (¯i − µ0 )2
                           2
                                 ¯                ¯                 2
                                                                       i x


which can be consistently estimated using
                                                         n
                                                 1
                                            ˆ
                                            B0 =             wi m2 (¯i − x)2
                                                              2
                                                                 i x     ¯
                                                 n
                                                         i

so that
                                                                     n                        2
                                 a    1 ˆ−1 ˆ ˆ−1                               wi mi
                         V ar (¯) ≈
                               x       A B0 A0 =                                n                 (¯i − x)2
                                                                                                   x    ¯
                                      n 0                                       i wi mi
                                                                     i

which is the same as (1.52) in Deaton (97) up to the ‘usual’ fpc.


                                                                 8
2.3      Asymptotic variance for OLS, with clustering and sampling weights

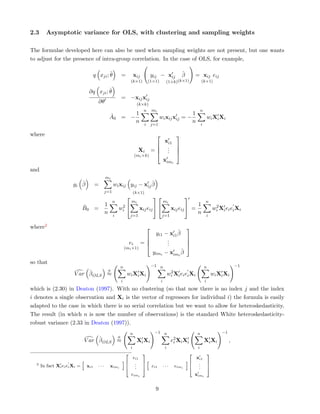
The formulae developed here can also be used when sampling weights are not present, but one wants
to adjust for the presence of intra-group correlation. In the case of OLS, for example,

                                        q xji ; ˆ
                                                θ          =            xij             yij − xij             ˆ
                                                                                                              β        = xij eij
                                                                    (k×1)           (1×1)          (1×k)(k×1)                  (k×1)

                                   ∂q xji ; ˆ
                                            θ
                                                           = −xij xij
                                          ∂θ                             (k×k)
                                                                            n mi                                               n
                                                    ˆ      1                                                           1
                                                    A0 = −                                    wi xij xij = −                           wi Xi Xi
                                                           n                                                           n
                                                                                i       j=1                                    i

where                                                                                    
                                                                                  xi1
                                                                                 . 
                                                                          Xi =  . 
                                                                                 . 
                                                                        (mi ×k)
                                                                                 ximi
and
                                                mi
                       gi     ˆ
                              β         =                              ˆ
                                                      wi xij yij − xij β
                                                j=1                     (k×1)
                                                                                                              
                                                      n             mi                            mi                               n
                              ˆ                 1          2                                                        1                       2
                              B0 =                        wi             xij eij                     xij eij  =                        wi Xi ei ei Xi
                                                n                                                                   n
                                                      i             j=1                        j=1                                     i

where2                                                                                                           
                                                                                                    ˆ
                                                                                          yi1 − xi1 β
                                                                                              .
                                                                                               .
                                                                                                                  
                                                                 ei           =               .                  
                                                               (mi ×1)
                                                                                                                 
                                                                                                    ˆ
                                                                                        yimi − ximi β
so that
                                                           n                            −1 n                                       n                    −1
                                  a
                            ˆ
                       V ar β OLS ≈                             wi Xi Xi                                2
                                                                                                       wi Xi ei ei Xi                      wi Xi Xi
                                                           i                                  i                                    i
which is (2.30) in Deaton (1997). With no clustering (so that now there is no index j and the index
i denotes a single observation and Xi is the vector of regressors for individual i) the formula is easily
adapted to the case in which there is no serial correlation but we want to allow for heteroskedasticity.
The result (in which n is now the number of observations) is the standard White heteroskedasticity-
robust variance (2.33 in Deaton (1997)).
                                                                    n                    −1 n                              n                   −1
                                         a
                                   ˆ
                              V ar β OLS ≈                               Xi Xi                          e2 Xi Xi                   Xi Xi            ,
                                                                                                         i
                                                                    i                              i                       i
                                                            2                 3                                    2                   3
                                                                     ei1                                                xi1
                              h                            i6                 7h                                  i6                   7
  2
      In fact Xi ei ei Xi =       xi1     ···       ximi    6
                                                            4
                                                                      .
                                                                      .
                                                                      .
                                                                              7
                                                                              5         ei1       ···     eimi     6
                                                                                                                   4
                                                                                                                         .
                                                                                                                         .
                                                                                                                         .
                                                                                                                                       7
                                                                                                                                       5
                                                                    eimi                                               ximi


                                                                                          9
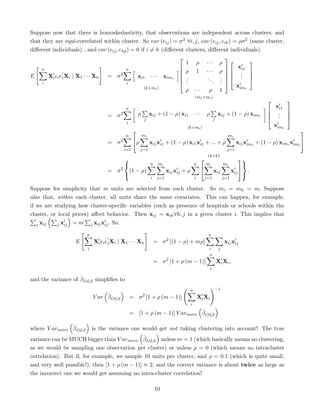
Suppose now that there is homoskedasticity, that observations are independent across clusters, and
that they are equi-correlated within cluster. So var (eij ) = σ 2 ∀i, j, cov (eij , eih ) = ρσ 2 (same cluster,
different individuals) , and cov (eij , ehp ) = 0 if i = h (different clusters, different individuals).
                                                                                     
                                                                    1 ρ ··· ρ                   
     n                                    n                                                 xi1
                                                                  ρ 1 ··· ρ  . 
                                                                                     
E      Xi ei ei Xi | X1 · · · Xn = σ2          xi1 · · · ximi  . .          ..   .  .   . 
                                                                  .             . . 
                                                                                   .
                                                                                      
     i                                     i
                                                   (k×mi )                                 ximi
                                                                    ρ ··· ρ 1
                                                                                              (mi ×mi )
                                                                                                                                                 
                                              n                                                                                               xi1
                                                                                                                                             . 
                                   = σ    2             ρ        xij + (1 − ρ) xi1 · · ·               ρ            xij + (1 − ρ) ximi       . 
                                                            j                                                  j                             . 
                                               i
                                                                                     (k×mi )                                                 ximi
                                                                                                                                                          
                                              n             mi                                                            mi
                                   = σ2             ρ           xij xi1 + (1 − ρ) xi1 xi1 + ... + ρ                           xij ximi + (1 − ρ) ximi ximi 
                                              i=1        j=1                                                             j=1
                                                                                                        (k×k)
                                                                                                                                
                                                                n    mi                      n        mi               mi         
                                   = σ 2 (1 − ρ)                            xij xij + ρ                       xij            xij  .
                                                                                                                                  
                                                                 i    j=1                     i        j=1              j=1

Suppose for simplicity that m units are selected from each cluster. So mi = mh = m. Suppose
also that, within each cluster, all units share the same covariates. This can happen, for example,
if we are studying how cluster-specific variables (such as presence of hospitals or schools within the
cluster, or local prices) affect behavior. Then xij = xih ∀h, j in a given cluster i. This implies that
   j xij   j xij = m      j xij xij . So,

                        n                                                                               n
                                                                            2
                   E         Xi ei ei Xi | X1 · · · Xn               = σ [(1 − ρ) + mρ]                                 xij xij
                         i                                                                              i           j
                                                                                                        n
                                                                     = σ 2 [1 + ρ (m − 1)]                         Xi Xi ,
                                                                                                           i

                    ˆ
and the variance of β OLS simplifies to
                                                                                          n                        −1
                                  ˆ
                             V ar β OLS                     2
                                                   = σ [1 + ρ (m − 1)]                            Xi Xi
                                                                                          i
                                                                               ˆ
                                                   = [1 + ρ (m − 1)] V arnaive β OLS

                ˆ
where V arnaive β OLS        is the variance one would get not taking clustering into account! The true
                                               ˆ
variance can be MUCH bigger than V arnaive β OLS unless m = 1 (which basically means no clustering,
as we would be sampling one observation per cluster) or unless ρ = 0 (which means no intracluster
correlation). But if, for example, we sample 10 units per cluster, and ρ = 0.1 (which is quite small,
and very well possible!), then [1 + ρ (m − 1)] ≈ 2, and the correct variance is about twice as large as
the incorrect one we would get assuming no intra-cluster correlation!

                                                                     10
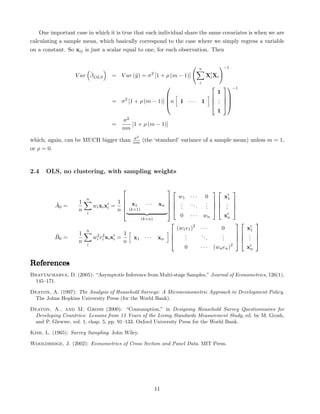
One important case in which it is true that each individual share the same covariates is when we are
calculating a sample mean, which basically correspond to the case where we simply regress a variable
on a constant. So xij is just a scalar equal to one, for each observation. Then


                                                                               n               −1
                       ˆ
                  V ar β OLS                y            2
                                    = V ar (¯) = σ [1 + ρ (m − 1)]                     Xi Xi
                                                                               i
                                                                                           −1
                                                                                           1
                                                                                          . 
                                    = σ 2 [1 + ρ (m − 1)] n
                                                          
                                                                       1 ···       1      . 
                                                                                         . 
                                                                                           1
                                            σ2
                                    =          [1 + ρ (m − 1)]
                                            nm
                                                 σ2
which, again, can be MUCH bigger than            nm   (the ‘standard’ variance of a sample mean) unless m = 1,
or ρ = 0.


2.4   OLS, no clustering, with sampling weights

                                                                                              
                    1
                        n
                                         1                     w1 · · · 0                  x1
                                                 x1 · · · xn   . . . .       .          . 
          ˆ
          A0 =              wi xi xi =
                                          
                                                               . .           .
                                                                               .          . 
                    n                    n
                                          
                                                (k×1)                                    . 
                        i
                                                                  0 · · · wn                 xn
                                                      (k×n)
                                                                                                         
                        n                                        (w1 e1 )2 · · ·            0            x1
          ˆ         1                       1                        .     ..               .             . 
                            wi e2 xi xi =
                             2
                                                                                                   
          B0 =                  i                 x1 · · · xn       .
                                                                     .         .            .
                                                                                            .           . 
                                                                                                          . 
                    n                       n                                                      
                        i
                                                                     0     ···           (wn en )2       xn

References
Bhattacharya, D. (2005): “Asymptotic Inference from Multi-stage Samples,” Journal of Econometrics, 126(1),
  145–171.

Deaton, A. (1997): The Analysis of Household Surveys: A Microeconometric Approach to Development Policy.
 The Johns Hopkins University Press (for the World Bank).

Deaton, A., and M. Grosh (2000): “Consumption,” in Designing Household Survey Questionnaires for
 Developing Countries: Lessons from 15 Years of the Living Standards Measurement Study, ed. by M. Grosh,
 and P. Glewwe, vol. 1, chap. 5, pp. 91–133. Oxford University Press for the World Bank.

Kish, L. (1965): Survey Sampling. John Wiley.

Wooldridge, J. (2002): Econometrics of Cross Section and Panel Data. MIT Press.


                                                             11

More Related Content

What's hot

2008 JSM - Meta Study Data vs Patient Data
2008 JSM - Meta Study Data vs Patient Data2008 JSM - Meta Study Data vs Patient Data
2008 JSM - Meta Study Data vs Patient DataTerry Liao
 
Introduction to Anova
Introduction to AnovaIntroduction to Anova
Introduction to AnovaJi Li
 
2011 JSM - Meta Rare Event Performance Goal in Medical Device Studies
2011 JSM - Meta Rare Event Performance Goal in Medical Device Studies2011 JSM - Meta Rare Event Performance Goal in Medical Device Studies
2011 JSM - Meta Rare Event Performance Goal in Medical Device StudiesTerry Liao
 
Lesson 23: The Definite Integral (handout)
Lesson 23: The Definite Integral (handout)Lesson 23: The Definite Integral (handout)
Lesson 23: The Definite Integral (handout)Matthew Leingang
 
Pr 2-bayesian decision
Pr 2-bayesian decisionPr 2-bayesian decision
Pr 2-bayesian decisionshivamsoni123
 
Download-manuals-ground water-manual-gw-volume2referencemanualsamplingprinci...
 Download-manuals-ground water-manual-gw-volume2referencemanualsamplingprinci... Download-manuals-ground water-manual-gw-volume2referencemanualsamplingprinci...
Download-manuals-ground water-manual-gw-volume2referencemanualsamplingprinci...hydrologyproject001
 
Download-manuals-surface water-manual-sw-volume2referencemanualsamplingprinc...
 Download-manuals-surface water-manual-sw-volume2referencemanualsamplingprinc... Download-manuals-surface water-manual-sw-volume2referencemanualsamplingprinc...
Download-manuals-surface water-manual-sw-volume2referencemanualsamplingprinc...hydrologyproject001
 

What's hot (13)

2008 JSM - Meta Study Data vs Patient Data
2008 JSM - Meta Study Data vs Patient Data2008 JSM - Meta Study Data vs Patient Data
2008 JSM - Meta Study Data vs Patient Data
 
Introduction to Anova
Introduction to AnovaIntroduction to Anova
Introduction to Anova
 
Econometrics ch13
Econometrics ch13Econometrics ch13
Econometrics ch13
 
Samplr
SamplrSamplr
Samplr
 
2011 JSM - Meta Rare Event Performance Goal in Medical Device Studies
2011 JSM - Meta Rare Event Performance Goal in Medical Device Studies2011 JSM - Meta Rare Event Performance Goal in Medical Device Studies
2011 JSM - Meta Rare Event Performance Goal in Medical Device Studies
 
Lesson 23: The Definite Integral (handout)
Lesson 23: The Definite Integral (handout)Lesson 23: The Definite Integral (handout)
Lesson 23: The Definite Integral (handout)
 
Pr 2-bayesian decision
Pr 2-bayesian decisionPr 2-bayesian decision
Pr 2-bayesian decision
 
PMED Transition Workshop - Estimation & Optimization of Composite Outcomes - ...
PMED Transition Workshop - Estimation & Optimization of Composite Outcomes - ...PMED Transition Workshop - Estimation & Optimization of Composite Outcomes - ...
PMED Transition Workshop - Estimation & Optimization of Composite Outcomes - ...
 
10.1.1.133.8405
10.1.1.133.840510.1.1.133.8405
10.1.1.133.8405
 
Download-manuals-ground water-manual-gw-volume2referencemanualsamplingprinci...
 Download-manuals-ground water-manual-gw-volume2referencemanualsamplingprinci... Download-manuals-ground water-manual-gw-volume2referencemanualsamplingprinci...
Download-manuals-ground water-manual-gw-volume2referencemanualsamplingprinci...
 
Case study 2
Case study 2Case study 2
Case study 2
 
Bayesian Core: Chapter 3
Bayesian Core: Chapter 3Bayesian Core: Chapter 3
Bayesian Core: Chapter 3
 
Download-manuals-surface water-manual-sw-volume2referencemanualsamplingprinc...
 Download-manuals-surface water-manual-sw-volume2referencemanualsamplingprinc... Download-manuals-surface water-manual-sw-volume2referencemanualsamplingprinc...
Download-manuals-surface water-manual-sw-volume2referencemanualsamplingprinc...
 

Viewers also liked

Viewers also liked (6)

Zax zeeliin Shinj
Zax zeeliin ShinjZax zeeliin Shinj
Zax zeeliin Shinj
 
Market Defition
Market DefitionMarket Defition
Market Defition
 
Elements Of Economertics 2nd
Elements Of Economertics 2ndElements Of Economertics 2nd
Elements Of Economertics 2nd
 
Fuzzy logic
Fuzzy logicFuzzy logic
Fuzzy logic
 
Hype vs. Reality: The AI Explainer
Hype vs. Reality: The AI ExplainerHype vs. Reality: The AI Explainer
Hype vs. Reality: The AI Explainer
 
Study: The Future of VR, AR and Self-Driving Cars
Study: The Future of VR, AR and Self-Driving CarsStudy: The Future of VR, AR and Self-Driving Cars
Study: The Future of VR, AR and Self-Driving Cars
 

Similar to Applied Econometrics lectsure

PG STAT 531 Lecture 5 Probability Distribution
PG STAT 531 Lecture 5 Probability DistributionPG STAT 531 Lecture 5 Probability Distribution
PG STAT 531 Lecture 5 Probability DistributionAashish Patel
 
1.1 course notes inferential statistics
1.1 course notes inferential statistics1.1 course notes inferential statistics
1.1 course notes inferential statisticsDjamel Bob
 
Stat 4 the normal distribution & steps of testing hypothesis
Stat 4 the normal distribution & steps of testing hypothesisStat 4 the normal distribution & steps of testing hypothesis
Stat 4 the normal distribution & steps of testing hypothesisForensic Pathology
 
ADVANCED STATISTICS PREVIOUS YEAR QUESTIONS.docx
ADVANCED STATISTICS PREVIOUS YEAR QUESTIONS.docxADVANCED STATISTICS PREVIOUS YEAR QUESTIONS.docx
ADVANCED STATISTICS PREVIOUS YEAR QUESTIONS.docxTaskiaSarkar
 
G4 PROBABLITY.pptx
G4 PROBABLITY.pptxG4 PROBABLITY.pptx
G4 PROBABLITY.pptxSmitKajbaje1
 
Basic statistics
Basic statisticsBasic statistics
Basic statisticsdhwhite
 
U1.4-RVDistributions.ppt
U1.4-RVDistributions.pptU1.4-RVDistributions.ppt
U1.4-RVDistributions.pptSameeraasif2
 
1 lab basicstatisticsfall2013
1 lab basicstatisticsfall20131 lab basicstatisticsfall2013
1 lab basicstatisticsfall2013TAMUK
 
Stat 4 the normal distribution & steps of testing hypothesis
Stat 4 the normal distribution & steps of testing hypothesisStat 4 the normal distribution & steps of testing hypothesis
Stat 4 the normal distribution & steps of testing hypothesisForensic Pathology
 
Stat 4 the normal distribution & steps of testing hypothesis
Stat 4 the normal distribution & steps of testing hypothesisStat 4 the normal distribution & steps of testing hypothesis
Stat 4 the normal distribution & steps of testing hypothesisForensic Pathology
 
Chapter 1
Chapter 1Chapter 1
Chapter 1Lem Lem
 
Chapter 2 Simple Linear Regression Model.pptx
Chapter 2 Simple Linear Regression Model.pptxChapter 2 Simple Linear Regression Model.pptx
Chapter 2 Simple Linear Regression Model.pptxaschalew shiferaw
 
Bipolar Disorder Investigation Using Modified Logistic Ridge Estimator
Bipolar Disorder Investigation Using Modified Logistic Ridge EstimatorBipolar Disorder Investigation Using Modified Logistic Ridge Estimator
Bipolar Disorder Investigation Using Modified Logistic Ridge EstimatorIOSR Journals
 
Lect w2 measures_of_location_and_spread
Lect w2 measures_of_location_and_spreadLect w2 measures_of_location_and_spread
Lect w2 measures_of_location_and_spreadRione Drevale
 
Module Five Normal Distributions & Hypothesis TestingTop of F.docx
Module Five Normal Distributions & Hypothesis TestingTop of F.docxModule Five Normal Distributions & Hypothesis TestingTop of F.docx
Module Five Normal Distributions & Hypothesis TestingTop of F.docxroushhsiu
 

Similar to Applied Econometrics lectsure (20)

PG STAT 531 Lecture 5 Probability Distribution
PG STAT 531 Lecture 5 Probability DistributionPG STAT 531 Lecture 5 Probability Distribution
PG STAT 531 Lecture 5 Probability Distribution
 
ebusiness
ebusinessebusiness
ebusiness
 
1.1 course notes inferential statistics
1.1 course notes inferential statistics1.1 course notes inferential statistics
1.1 course notes inferential statistics
 
Stat 4 the normal distribution & steps of testing hypothesis
Stat 4 the normal distribution & steps of testing hypothesisStat 4 the normal distribution & steps of testing hypothesis
Stat 4 the normal distribution & steps of testing hypothesis
 
ADVANCED STATISTICS PREVIOUS YEAR QUESTIONS.docx
ADVANCED STATISTICS PREVIOUS YEAR QUESTIONS.docxADVANCED STATISTICS PREVIOUS YEAR QUESTIONS.docx
ADVANCED STATISTICS PREVIOUS YEAR QUESTIONS.docx
 
G4 PROBABLITY.pptx
G4 PROBABLITY.pptxG4 PROBABLITY.pptx
G4 PROBABLITY.pptx
 
Basic statistics
Basic statisticsBasic statistics
Basic statistics
 
U1.4-RVDistributions.ppt
U1.4-RVDistributions.pptU1.4-RVDistributions.ppt
U1.4-RVDistributions.ppt
 
1 lab basicstatisticsfall2013
1 lab basicstatisticsfall20131 lab basicstatisticsfall2013
1 lab basicstatisticsfall2013
 
Stat 4 the normal distribution & steps of testing hypothesis
Stat 4 the normal distribution & steps of testing hypothesisStat 4 the normal distribution & steps of testing hypothesis
Stat 4 the normal distribution & steps of testing hypothesis
 
Stat 4 the normal distribution & steps of testing hypothesis
Stat 4 the normal distribution & steps of testing hypothesisStat 4 the normal distribution & steps of testing hypothesis
Stat 4 the normal distribution & steps of testing hypothesis
 
Estimating a Population Proportion
Estimating a Population Proportion  Estimating a Population Proportion
Estimating a Population Proportion
 
Chapter 1
Chapter 1Chapter 1
Chapter 1
 
Chapter 2 Simple Linear Regression Model.pptx
Chapter 2 Simple Linear Regression Model.pptxChapter 2 Simple Linear Regression Model.pptx
Chapter 2 Simple Linear Regression Model.pptx
 
Unit 3 Sampling
Unit 3 SamplingUnit 3 Sampling
Unit 3 Sampling
 
2 UEDA.pdf
2 UEDA.pdf2 UEDA.pdf
2 UEDA.pdf
 
Bipolar Disorder Investigation Using Modified Logistic Ridge Estimator
Bipolar Disorder Investigation Using Modified Logistic Ridge EstimatorBipolar Disorder Investigation Using Modified Logistic Ridge Estimator
Bipolar Disorder Investigation Using Modified Logistic Ridge Estimator
 
One Way ANOVA.pdf
One Way ANOVA.pdfOne Way ANOVA.pdf
One Way ANOVA.pdf
 
Lect w2 measures_of_location_and_spread
Lect w2 measures_of_location_and_spreadLect w2 measures_of_location_and_spread
Lect w2 measures_of_location_and_spread
 
Module Five Normal Distributions & Hypothesis TestingTop of F.docx
Module Five Normal Distributions & Hypothesis TestingTop of F.docxModule Five Normal Distributions & Hypothesis TestingTop of F.docx
Module Five Normal Distributions & Hypothesis TestingTop of F.docx
 

Applied Econometrics lectsure

  • 1. Applied Econometrics Lecture Notes Alessandro Tarozzi∗ 1 Estimation with robust standard errors Economists do not care only about point estimates. We also care about standard errors, as these allow us to measure the level of ‘confidence’ we can have on the meaningfulness of the point estimates. For this reason, getting the standard errors right is important. A lot of standard results in econometrics are based on the assumption that observations are independent, and identically distributed. But in applied microeconomics, data often come from surveys, and surveys are typically designed in such a way that observations are not i.i.d.. Forgetting about this leads to sometimes wildly wrong inference. In particular, we will see that it frequently leads to standard errors that are too low. Notice that this problem goes beyond the ‘usual’ warning against the presence of heteroskedasticity. Knowing the methodology of data collection is important! 1. Does the sampling frame really coincide with population of interest? (Homeless, or military, often not included in sampling frame). See Figure 1.1 for Taiwan in Deaton (1997). 2. Data are, almost always, not as objective as we might think (or hope). The way you collect data (the order of the questions in a questionnaire, or the way you phrase them) can affect importantly the kind of answers you get! If you are interested in survey methodology issues, especially as related to the collection of expenditure data, a great starting point is Deaton and Grosh (2000). 3. More to the point, SURVEY DESIGN should be taken into account for: • Sampling weights (different population units have a different probability of being selected. The use of weights typically changes the point estimates, and not only the standard errors). • Stratification (makes observations not identically distributed, and might change standard errors, especially in small samples) • Clustering (makes observations not independent, and frequently increases standard errors, even in large samples) ∗ I would like to thank Benjamin Zhang for his help in writing a first draft of some chapters of these lecture notes. 1
  • 2. For many surveys it is essential to correct S.E. CPS (USA), Panel study of Income Dynamics (USA), Survey of Income & Program Participa- tion (USA), Health & Retirement Study (USA), National Sample Survey (India), Living Standard Measurement Surveys (World Bank surveys), Demographic and Health Surveys (DHS). An excellent introduction to Stratification/Clustering/Sampling weights can be found in Ch. 1 of Deaton (1997). 1.1 Stratification First split the survey into more INDEPENDENT sub-surveys, and then draw independent samples from each stratum. This is typically done to ensure that enough observations come from different areas / groups. Therefore, by construction, observations from different strata belong to at least partly different populations! This means that they are not identically distributed. Stratification typically reduces SE especially in small samples (and especially if parameters of interest are very different across different strata. Why? Intuitively, because all possible samples become ‘more similar’). 1.2 Clustering This can coexist with stratification. Sampling is done using a two-stage design: 1. First select clusters/PSU (Primary Stage Units). These are typically urban blocks, villages, neighborhoods etc. 2. then select households (or individuals). In most cases clustering increases (sometimes considerably) standard errors. Why? Intuitively, because observations within the same cluster are generally correlated among them, and this reduces the ‘effective number of observations’ (we will see that if the intra-cluster correlation goes up, SE tend to go up). So why is it done? Often to keep survey costs at bay (not necessary, for example, if you use a telephone survey!). Also, if you are doing a study based on a randomized evaluation, and treatments and controls are defined at the group level (e.g. by village), then clustering arises by construction. Correcting SE for clustering mean, essentially, allowing for intra-group correlation. Intra-group cor- relation can also of course arise for reasons different from survey design (e.g. you have more observations per unit, as in a panel). Kish (1965) Deff (Design Effect Ratio) V ar(Taking into account design) typically >1 V ar(Assuming SRS) 2
  • 3. 1.3 Sampling Weights There are also called ‘inflation factors’, as each observations is ‘inflated’ to represent a certain share of the population. Broadly speaking 1 W eight = ‘Inflation Factor’ Prob. of Selection Different hhs/individuals typically have = probability of being selected. This can happen for different reasons: 1. Because of two stage sampling: for ex., urban blocks (PSU) are selected with the same prob., and then a constant number of hhs is selected in each block. Because blocks have different numbers of hhs, hhs in larger blocks have lower probability of being selected. Stratification and clustering are generally associated with the presence of sampling weights, as they typically lead to probability of selection that differs across population units. Some surveys, however, are self weighted (because the number of observations selected in each first stage unit is proportional to the ‘size’ of the unit) but in practice post-sampling weights is frequently necessary to adjust for non-responses (these ‘adjustments’ have frequently some degree of subjectivity...). 2. To take into account = cost of sampling in = areas, or = non-response rates. 3. To increase precision (high prob. of selection for units that for ex., contribute more to the mean. The ‘contribution’ is generally determined using proxies). Here we will focus on weights deriving from (1), which is the case that Wooldridge calls Standard Stratified Sampling (see Wooldridge (2002) (W) 17.8). There are many other (generally more complicated) cases where ‘reweighting’ is necessary because of missing data/non-response (see W 17.7). Standard Stratified Sampling Consider the case in which the population is divided into S groups or strata, and a sample of ns observations is selected from each stratum (and S ns = n ). If j=1 the strata are not homogeneous, this kind of sampling BREAKS identical distribution (which, however, remains within each stratum). Broadly speaking, if strata are different, and you don’t use weights, you can’t estimate consistently populations parameters. Let Qj ≡ population frequency of stratum j. You want to estimate the parameters θ0 that satisfy a certain population moment condition: E[q(xij , θo )] = 0 pop. moment condition where xi are variables observed for individual i. Using the L.I.E., we easily get S Qj E[q(xij ; θo ) | j] = 0 j 3
  • 4. where I have made explicit the fact that each unit i belongs to one and only one stratum. Let HJ ≡fraction of sample from stratum j. Note that HJ is defined by the sampling scheme, and it remains approximately constant when the sample size increases! Suppose now that you estimate θ0 by using an unweighted sample analogue of the above population moment condition. You have a sample of n observations, HJ = nj /n of which come from stratum s. So n S nj S nj 1 1 1 nj q(xh ; θo ) = q(xij ; θo ) = q(xij ; θo ) n n n nj h=1 j=1 i=1 j=1 i=1 S nj 1 = Hj q(xij ; θo ) nj j=1 i=1 When the sample size increases, we get more and more observations from each stratum, but the number of strata does not change, and the proportion of observations from each stratum does not change as well. So, under regularity conditions, the object in brackets will converge in probability to E[q(xij ; θo ) | j], n 1 but unless Hj = Qj (which typically does not happen!), the sample quantity n q(xh ) does not h=1 identify the parameter of interest θo !! But this is no big deal. We just have to incorporate sampling weights in our estimation, and use instead S nj 1 Qj q(xij ; θo ) n Hj j=1 i=1 Qj where Hj ≡ Wji is the SAMPLING WEIGHT. In fact, now S nj S nj 1 Qj 1 q(xij ; θo ) = Qj q(xij ; θo ) n Hj nj j=1 i=1 j=1 i=1 so that now the sample moment condition does identify the parameter of interest θo , as the sample moment condition will ‘converge’ to the correct population moment condition. 1.4 Variance of sample mean, with stratification. A mixture of Deaton (1.38) & Wooldridge (Ch. 17.8) Let us see, formally, that stratification typically reduces standard errors. For simplicity I consider the case in which the proportion of the population living in each stratum is known. Here, once again, denote Qj prop. of population in stratum j, and Hj prop. of sample from stratum j. The sampling weights are typically identical for all observations in the same stratum: J nj J Qj Qj Qj wjl = = =⇒ wjl = nj =n Hj nj /n nj /n j=1 l=1 j wjl Qj =⇒ J nj = j=1 l=1 wjl nj 4
  • 5. First note that the sample mean can be written as a weighted average of stratum-specific sample means. J nj J nj wjl Qj x = ¯ J nj xjl = xjl j=1 l=1 wjl nj j=1 l=1 j=1 l=1 J nj J 1 = Qj xjl = Qj xj ¯ nj j=1 l=1 j Since strata are independent, the ‘correct’ variance of the sample average can be estimated as a weighted average of the stratum-specific estimated variances. So J J 2 J nj Sj 1 1 V arST RAT (¯) = x Q2 V j ar (¯j ) = x Q2 j = Q2 j (xjl − xj )2 ¯ (1) nj nj nj − 1 j j j l=1 where we use the fact that within each stratum weights play no role, so that the stratum-specific variance can be simply estimated using nj 1 2 Sj = (xjl − xj )2 ¯ nj − 1 l=1 What is the relation between 1 and the variance as it would be computed disregarding the presence of strata? First of all, let us compute this latter variance. Even if stratification is not considered, one still has to make use of the correct formula for the variance when sampling weights are present (which is the case here). Using expression (1.28) in Deaton (and abstracting from the finite population correction n/(n − 1) ), J nj 2 Qj V arSRS (¯) = x (xjl − x)2 ¯ nj j l=1 How do V arSRS (¯) and V arST RAT (¯) differ? Let us rewrite V arST RAT (¯): x x x J nj 1 1 V arST RAT (¯) = x Q2 j (xjl − xj ± x)2 ¯ ¯ nj − 1 nj j l=1 J nj 1 1 = Q2 j [(xjl − x) − (¯j − x)]2 ¯ x ¯ nj − 1 nj j l=1 J nj nj nj 1 1 2 2 = Q2 j (xjl − x) + ¯ (¯j − x) − 2 x ¯ (xjl − x) (¯j − x) ¯ x ¯ nj − 1 nj j l=1 l=1 l=1 J nj nj 1 1 2 2 = Q2 j (xjl − x) + nj (¯j − x) − 2 (¯j − x) ¯ x ¯ x ¯ (xjl − x) ¯ nj − 1 nj j l=1 l=1 J nj 1 1 = Q2 j (xjl − x)2 − nj (¯j − x)2 ¯ x ¯ nj − 1 nj j l=1 5
  • 6. so that the following approximation will hold:   J nj 2 J Qj 1 V arST RAT (¯) ≈ x (xjl − x)2 −  ¯ Q2 j (¯j − x)2  x ¯ nj nj − 1 j l=1 j J 1 = V arSRS (¯) − x Q2 j (¯j − x)2 , x ¯ nj − 1 j which means that taking stratification into account decreases the variance of the estimator. Note that the difference in the variances is larger the larger the cross-strata differences in means are. Note also that for large samples the difference is unlikely to be large, since it converges to zero when the sample size from each stratum grows. In practice, taking stratification into account often makes little important difference. 2 A unifying Method of Moments approach We assume that there is only one stratum.1 Here we loosely develop arguments leading to the asymptotic variance of the MoM estimator when the number of clusters goes to infinity. This framework is analogous to the ‘large-N’ asymptotic results for panel estimation. Let n be the number of clusters, and mi is the number of observations within cluster i. The estimator solves the following sample moment condition (for simplicity we consider the case of exact identification, with k moments and k parameters): n mi wi q xji ; ˆ θ = 0 i=1 j=1 n gi ˆ θ = 0 i=1 mi Where gi ˆ ≡ θ j=1 wi q xji ; ˆ (this is basically the weighted sum of the ‘errors’ within the same θ cluster). Note that in the above expression the sampling weight wi is just a scalar. Expanding q xji ; ˆ θ around θ0 we get ∂q xji ; ˜ θ q xji ; ˆ = q (xji ; θ0 ) + θ ˆ − θ0 θ ∂θ 1 For a more formal and general treatment of GMM estimation with a complex survey design see Bhattacharya (2005). 6
  • 7. Plugging into the moment condition and rearranging (here we abstract from regularity conditions, see for example W, page 351), we get  −1   √ 1 n mi ∂q xji ; ˜ θ 1 n mi n ˆ − θ0 θ = − wi  √  wi q (xji ; θ0 ) n ∂θ n i=1 j=1 i=1 j=1  −1 1 n mi ∂q xji ; ˜ θ 1 n = − wi  √ gi (θ0 ) n ∂θ n i=1 j=1 i=1 d → N 0, A−1 B0 A−1 0 0 where ∂q (xji ; θ0 ) A0 = E ∂θ     mi mi 2 B0 = E gi (θ0 ) gi (θ0 ) = E wi  q (xji ; θ0 )  q (xji ; θ0 )  j=1 j=1 so note that the presence of clustering will not affect the estimation of the Hessian, but it WILL affect the estimation of the variance-covariance matrix through B0 . Consistent estimates of the variance can therefore be obtained as 1 ˆ−1 ˆ ˆ−1 A B0 A0 where n 0 1 n mi ∂q xji ; ˆ θ ˆ A0 = wi n ∂θ i j=1    n mi mi 1 ˆ B0 = 2 wi  q xji ; ˆ   θ q xji ; ˆ  θ n i j=1 j=1 2.1 Asymptotic variance for the sample mean, with sampling weights but no clus- tering Since here we have no clustering, n will be the number or observations, and the index j is irrelevant. For a sample mean, q xji ; ˆ = xi − x, so that θ ¯ n 1 ˆ B0 = wi (xi − x)2 2 ¯ n i n ˆ 1 A0 = − wi n i 7
  • 8. so that one can estimate the variance of the weighted mean using 1 ˆ−1 ˆ ˆ−1 V ar (¯) = x A B0 A0 n 0 n −1 n n −1 2 2 = wi wi (xi − x) ¯ wi i i i n 2 wi = n (xi − x)2 ¯ (2) i i wi which is identical to (1.28) in Deaton (1997) up to the (negligible for n large) fpc n/(n − 1). Note that this is different from the ‘standard’ form of the variance n S2 1 1 V ar (¯) = x = wi (xi − x)2 ¯ (3) n nn−1 i 2.2 Asymptotic variance for the sample mean, with sampling weights and cluster- ing The estimator for A0 is not affected by clustering. In fact n mi n ˆ 1 1 A0 = wi = wi mi n n i j=1 i The estimate of B0 , instead, is affected.     mi mi 2 B0 = E wi  (xji − µ0 ) (xji − µ0 ) j=1 j=1 = E wi (mi xi − mi µ0 ) (mi xi − mi µ0 ) = E wi m2 (¯i − µ0 )2 2 ¯ ¯ 2 i x which can be consistently estimated using n 1 ˆ B0 = wi m2 (¯i − x)2 2 i x ¯ n i so that n 2 a 1 ˆ−1 ˆ ˆ−1 wi mi V ar (¯) ≈ x A B0 A0 = n (¯i − x)2 x ¯ n 0 i wi mi i which is the same as (1.52) in Deaton (97) up to the ‘usual’ fpc. 8
  • 9. 2.3 Asymptotic variance for OLS, with clustering and sampling weights The formulae developed here can also be used when sampling weights are not present, but one wants to adjust for the presence of intra-group correlation. In the case of OLS, for example, q xji ; ˆ θ = xij yij − xij ˆ β = xij eij (k×1) (1×1) (1×k)(k×1) (k×1) ∂q xji ; ˆ θ = −xij xij ∂θ (k×k) n mi n ˆ 1 1 A0 = − wi xij xij = − wi Xi Xi n n i j=1 i where   xi1  .  Xi =  .   .  (mi ×k) ximi and mi gi ˆ β = ˆ wi xij yij − xij β j=1 (k×1)    n mi mi n ˆ 1 2 1 2 B0 = wi  xij eij   xij eij  = wi Xi ei ei Xi n n i j=1 j=1 i where2   ˆ yi1 − xi1 β  . .  ei = .  (mi ×1)   ˆ yimi − ximi β so that n −1 n n −1 a ˆ V ar β OLS ≈ wi Xi Xi 2 wi Xi ei ei Xi wi Xi Xi i i i which is (2.30) in Deaton (1997). With no clustering (so that now there is no index j and the index i denotes a single observation and Xi is the vector of regressors for individual i) the formula is easily adapted to the case in which there is no serial correlation but we want to allow for heteroskedasticity. The result (in which n is now the number of observations) is the standard White heteroskedasticity- robust variance (2.33 in Deaton (1997)). n −1 n n −1 a ˆ V ar β OLS ≈ Xi Xi e2 Xi Xi Xi Xi , i i i i 2 3 2 3 ei1 xi1 h i6 7h i6 7 2 In fact Xi ei ei Xi = xi1 ··· ximi 6 4 . . . 7 5 ei1 ··· eimi 6 4 . . . 7 5 eimi ximi 9
  • 10. Suppose now that there is homoskedasticity, that observations are independent across clusters, and that they are equi-correlated within cluster. So var (eij ) = σ 2 ∀i, j, cov (eij , eih ) = ρσ 2 (same cluster, different individuals) , and cov (eij , ehp ) = 0 if i = h (different clusters, different individuals).   1 ρ ··· ρ   n n xi1  ρ 1 ··· ρ  .    E Xi ei ei Xi | X1 · · · Xn = σ2 xi1 · · · ximi  . . .. .  .  .   . . .  .  i i (k×mi ) ximi ρ ··· ρ 1 (mi ×mi )   n xi1  .  = σ 2 ρ xij + (1 − ρ) xi1 · · · ρ xij + (1 − ρ) ximi  .  j j  .  i (k×mi ) ximi   n mi mi = σ2 ρ xij xi1 + (1 − ρ) xi1 xi1 + ... + ρ xij ximi + (1 − ρ) ximi ximi  i=1 j=1 j=1 (k×k)     n mi n mi mi  = σ 2 (1 − ρ) xij xij + ρ  xij xij  .   i j=1 i j=1 j=1 Suppose for simplicity that m units are selected from each cluster. So mi = mh = m. Suppose also that, within each cluster, all units share the same covariates. This can happen, for example, if we are studying how cluster-specific variables (such as presence of hospitals or schools within the cluster, or local prices) affect behavior. Then xij = xih ∀h, j in a given cluster i. This implies that j xij j xij = m j xij xij . So, n n 2 E Xi ei ei Xi | X1 · · · Xn = σ [(1 − ρ) + mρ] xij xij i i j n = σ 2 [1 + ρ (m − 1)] Xi Xi , i ˆ and the variance of β OLS simplifies to n −1 ˆ V ar β OLS 2 = σ [1 + ρ (m − 1)] Xi Xi i ˆ = [1 + ρ (m − 1)] V arnaive β OLS ˆ where V arnaive β OLS is the variance one would get not taking clustering into account! The true ˆ variance can be MUCH bigger than V arnaive β OLS unless m = 1 (which basically means no clustering, as we would be sampling one observation per cluster) or unless ρ = 0 (which means no intracluster correlation). But if, for example, we sample 10 units per cluster, and ρ = 0.1 (which is quite small, and very well possible!), then [1 + ρ (m − 1)] ≈ 2, and the correct variance is about twice as large as the incorrect one we would get assuming no intra-cluster correlation! 10
  • 11. One important case in which it is true that each individual share the same covariates is when we are calculating a sample mean, which basically correspond to the case where we simply regress a variable on a constant. So xij is just a scalar equal to one, for each observation. Then n −1 ˆ V ar β OLS y 2 = V ar (¯) = σ [1 + ρ (m − 1)] Xi Xi i   −1 1  .  = σ 2 [1 + ρ (m − 1)] n  1 ··· 1  .    .  1 σ2 = [1 + ρ (m − 1)] nm σ2 which, again, can be MUCH bigger than nm (the ‘standard’ variance of a sample mean) unless m = 1, or ρ = 0. 2.4 OLS, no clustering, with sampling weights     1 n 1   w1 · · · 0 x1 x1 · · · xn   . . . . .  .  ˆ A0 = wi xi xi =   . . . .  .  n n  (k×1)   .  i 0 · · · wn xn (k×n)    n (w1 e1 )2 · · · 0 x1 ˆ 1 1 . .. . .  wi e2 xi xi = 2   B0 = i x1 · · · xn  . . . . .  .  .  n n   i 0 ··· (wn en )2 xn References Bhattacharya, D. (2005): “Asymptotic Inference from Multi-stage Samples,” Journal of Econometrics, 126(1), 145–171. Deaton, A. (1997): The Analysis of Household Surveys: A Microeconometric Approach to Development Policy. The Johns Hopkins University Press (for the World Bank). Deaton, A., and M. Grosh (2000): “Consumption,” in Designing Household Survey Questionnaires for Developing Countries: Lessons from 15 Years of the Living Standards Measurement Study, ed. by M. Grosh, and P. Glewwe, vol. 1, chap. 5, pp. 91–133. Oxford University Press for the World Bank. Kish, L. (1965): Survey Sampling. John Wiley. Wooldridge, J. (2002): Econometrics of Cross Section and Panel Data. MIT Press. 11