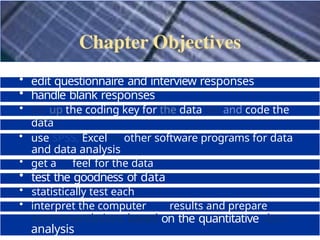
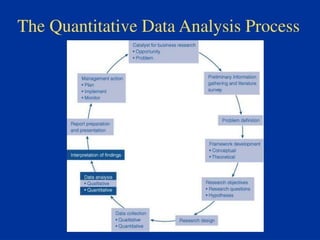
• edit questionnaireand interview responses
• handle blank responses
• set up the coding key for the data set and code the
data
• categorise data and create a data file
• use SPSS, Excel or other software programs for data
entry
and data analysis
• get a feel for the data
• test the goodness of data
• statistically test each
hypothesis
• interpret the computer results and prepare
recommendations based on the quantitative data
analysis
6.
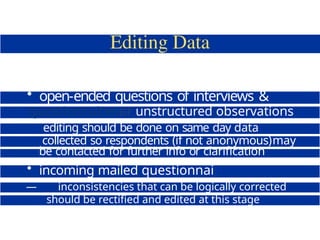
• open-ended questionsof interviews &
questionnairesor unstructured observations
editing should be done on same day data
collected so respondents (if not anonymous)may
be contacted for further info or clarification
• incoming mailed questionnai
e data
— inconsistencies that can be logically corrected
should be rectified and edited at this stage
7.
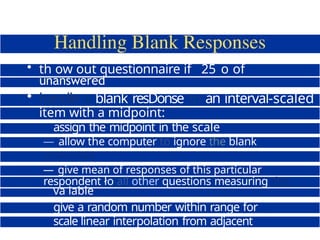
• th owout questionnaire if 25 o of
questions
unanswered
• handle a blank resDonse to an interval-scaled
item with a midpoint:
assign the midpoint in the scale
— allow the computer to ignore the blank
responses
assign the mean value of the responses
— give mean of responses of this particular
respondent ło all other questions measuring this
va iable
give a random number within range for
scale linear interpolation from adjacent
points
8.
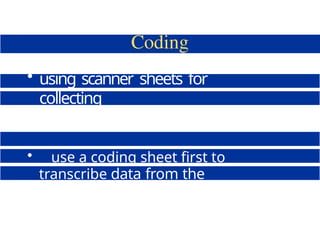
• using scannersheets for
collecting
questionnaire data
• use a coding sheet first to
transcribe data from the
questionnaire and then key in
data
9.
1. Age tyears)
1]Under 25
|2] 2W33
(3] 3 -4S
2. Education
1] High school
{2] TAFE or
polytechnic
diploma
3. Job level
1 Manager
2 Supervisor
3 Clerk
4 Secretary
4.
S.
Gender
| lj M
{2] F
Work shift
[3] Over 33
6. Employment status
{3] Bachelor's degree
UI Master's degree
|5J Doctoral degree
5 Technician
6 Other
{ I] First
121 Second
|3j Thitd
{ 1] Part time {6] Other (specify)
{2] Full time
To what extent would you agree with the following stakments, on a scale of 1 to
7. l denoting very low agreeirient, and 7 denoting very high agreement?
7. The major happiness in my life come rrom my job. 1 2 3 4 S 6 7
8. Time at work flies by quickly. 1 2 3 4 9 h
9. I live, eat and breathe my job. 1 2 3 4 S h 7
10. My work is fascinating. 1 2 3 4 5 h 7
10.
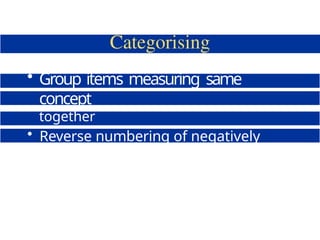
• Group itemsmeasuring same
concept
together
• Reverse numbering of negatively
worded questions
11.
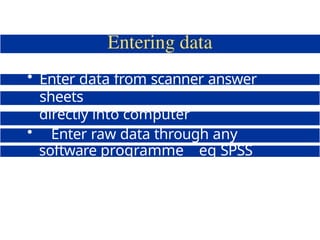
• Enter datafrom scanner answer
sheets
directly into computer
• Enter raw data through any
software programme eg SPSS
Data Editor Excel
12.
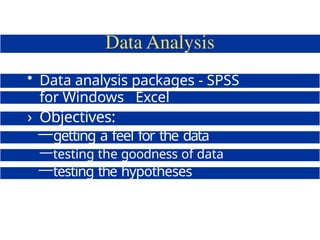
• Data analysispackages - SPSS
for Windows Excel
› Objectives:
—getting a feel for the data
—testing the goodness of data
—testing the hypotheses
13.
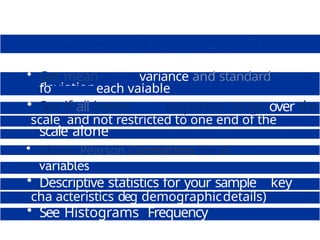
• Get meanvariance and standard
deviation
fo each vaiable
• See if all items responses range over the
scale and not restricted to one end of the
scale alone
• Obtain Pearson Correlations for all
variables
• Tabulate your data
• Descriptive statistics for your sample s key
cha acteristics deg demographicdetails)
• See Histograms Frequency
Polygons etc
14.
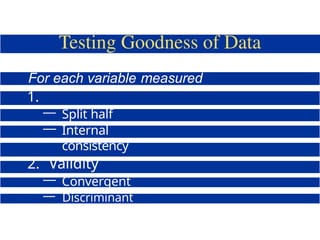
For each variablemeasured
obtain:
1.
Reliability
— Split half
— Internal
consistency
2. Validity
— Convergent
— Discriminant
— Factorial
15.
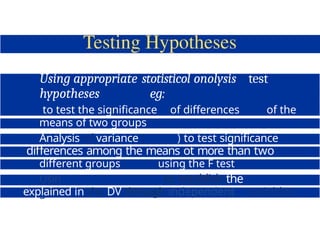
Using appropriate stotisticolonolysis test
hypotheses eg:
to test the significance of differences of the
means of two groups
Analysis of variance ( ) to test significance
oł
differences among the means ot more than two
different groups using the F test
Usin
g
to establish the
variance
explained in the DV through independent variables
16.
• Research Donein Wollongong
Enterprises
—Using SPSS
• Analysis of Accounting Chair Data
Set
—Using Excel
17.
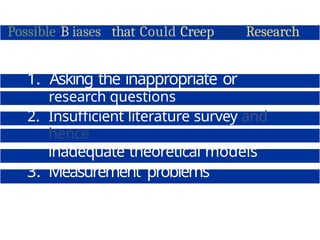
Possible B iasesthat Could Creep into Research
1. Asking the inappropriate or
wrong
research questions
2. Insufficient literature survey and
hence
inadequate theoretical models
3. Measurement problems
4. Samples not being representative
18.
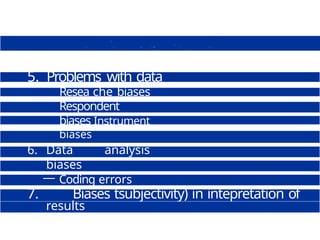
5. Problems withdata
collection
Resea che biases
Respondent
biases Instrument
biases
6. Data analysis
biases
— Coding errors
— Data punching &
input errors
— Inappropriate
statistical
7. Biases tsubjectivity) in intepretation of
results
![1. Age tyears)
1] Under 25
|2] 2W33
(3] 3 -4S
2. Education
1] High school
{2] TAFE or
polytechnic
diploma
3. Job level
1 Manager
2 Supervisor
3 Clerk
4 Secretary
4.
S.
Gender
| lj M
{2] F
Work shift
[3] Over 33
6. Employment status
{3] Bachelor's degree
UI Master's degree
|5J Doctoral degree
5 Technician
6 Other
{ I] First
121 Second
|3j Thitd
{ 1] Part time {6] Other (specify)
{2] Full time
To what extent would you agree with the following stakments, on a scale of 1 to
7. l denoting very low agreeirient, and 7 denoting very high agreement?
7. The major happiness in my life come rrom my job. 1 2 3 4 S 6 7
8. Time at work flies by quickly. 1 2 3 4 9 h
9. I live, eat and breathe my job. 1 2 3 4 S h 7
10. My work is fascinating. 1 2 3 4 5 h 7](https://image.slidesharecdn.com/appliedbusinessresearch-250315171018-a90f572b/85/Applied-Business-Research-For-application-9-320.jpg)


![DWM- CO2_WAREHOUSE_MINING [Autosaved].pptx](https://cdn.slidesharecdn.com/ss_thumbnails/dwm-co2-session-9autosaved-241214094013-10a39598-thumbnail.jpg?width=640&height=640&fit=bounds)