This document summarizes a study that used the Storm Water Management Model (SWMM) to analyze flooding issues in Truro, Nova Scotia. The study aimed to:
1) Understand the spatial hydrodynamics and interaction between Truro's storm sewer system and the Salmon River.
2) Determine if SWMM could be adapted to model this system, which includes both natural and man-made components.
3) Identify the type of flood wave (kinematic, diffusive, or dynamic) affecting Truro to help with data collection and modeling complexity.
The study found that a dynamic flood wave from a 21-year flood event combined with a 100-year tide reached as far upstream as
The passage describes characteristics of tsunamis and how they contribute to destructive power, as well as the operation of the Pacific Tsunami Warning System. It then discusses three factors that can cause rivers to flood: climate, characteristics of the river basin, and human activities. Climate includes differences between wet and dry seasons that can lead to flooding after drought. River basin characteristics like size and slope influence how quickly water reaches the river. Human activities such as urbanization, deforestation, and land management practices increase surface runoff and flood risk.
In this work the impact of the tidal wave on pollutant residence time within Nador
lagoon has been computed using an Eulerian approach and a 2D hydrodynamical model.
The model is based on the finite volume method; it solves the shallow water equations on
spatial domain that represents the Nador lagoon. The residence time has been defined
through the remnant function of a passive tracer released inside the lagoon. The renewal
capacity of the Nador Lagoon has been investigated when forced by the astronomic tide.
The influence of tidal wave on residence time has been defined by the return flow, and
computed for two scenarios during winter and spring periods.
Boletin tecnico informativo n. 61 EFECTO DE LAS LLUVIAS EN LAS COMUNIDADES. E...ignacio javier navarro
1. The document discusses the effects of rainfall on communities, including increased flood risk from urban development in vulnerable areas without proper planning. It also covers hydrological concepts like watersheds, sediments, drainage in streams and rivers, and calculating water volumes.
2. Key effects of rainfall mentioned include economic losses, property damage, loss of life from flooding, as well as pollution from materials carried into waterways.
3. The document provides definitions and descriptions of rainfall types, how rainfall is measured, watershed characteristics, sediment types, and stream drainage. Calculations of watershed attributes and water volumes are discussed.
Riparian Zone, Stream, and Floodplain Issues: ReviewRizki Amalia
This document summarizes issues related to managing riparian zones, streams, and floodplains. It discusses that while naturalness is generally the goal, defining natural is difficult. A diversity of management effects have been recognized, including direct disturbance, changes in woody debris and flows, and cumulative effects over space and time. The document also discusses challenges in defining streams, protecting ephemeral sections, and quantifying the complex variability of stream channels.
Learn about floods, its causes and its types. including many pictures to make this a fun learing slide. have fun! please comment and like! hope you love it! kisesssssssssssssssssssssssssssssssssssssssssssssssssssssssssssssssssssssssssssssssssssssssssssssssssssssssssssssssssssssssssssssssssssssssssssssssssssssssssssssssssssssssssssssssssssssssssssssssssssssssssssssss!
Todorovic, P. (1978). Modelos estocásticos de inundaciones. Investigación de ...SandroSnchezZamora
This document discusses stochastic models for analyzing floods based on partial duration series of streamflow data. It presents three stochastic models that depend on assumptions about exceedances above a base level in the streamflow data. The models improve upon each other by having less restrictive assumptions. The distribution of the largest flood volume in a time interval is determined. Comparison of theoretical and observed distributions shows the assumptions are not unduly restrictive.
IRJET- Water Resources Planning and the Hydrologic CycleIRJET Journal
1) Water is essential for life but only a small percentage of Earth's total water is available freshwater. Sustainable management of water resources is important for development.
2) The hydrologic cycle describes how water circulates between the atmosphere and Earth's surface in different states as it evaporates, condenses, precipitates, and collects or infiltrates into the ground.
3) At the regional scale, river basins are a key unit for studying hydrology as they represent areas where all precipitation and runoff drains to a common point such as a river mouth. Understanding the hydrologic cycle and its processes within river basins is important for water planning.
IAHR 2015 - Storm-induced coastal risks at the Tordera delta under different ...Deltares
This document presents a methodology to assess the influence of sea level rise on storm-induced coastal flooding and erosion. It develops a quasi-dynamic approach that considers the coastal response to sea level rise, such as beach profile adaptation, in addition to the traditional static approach. The methodology is applied to the Tordera delta in Spain under different climate scenarios. The results show that accounting for the coastal response reduces the effects of sea level rise on inundation and erosion hazards compared to the static approach. In particular, the reduction is more evident for developed coasts at shorter time horizons when sea level rise induced retreat is small relative to available accommodation space.
Greetings all,
This month’s newsletter is dedicated to high frequency processes. It is mandatory to resolve such high frequency processes in
regional and coastal forecasting systems. Taking them into account constitutes thus one of the main goals of several projects or
networks as MERSEA, MOON, ECOOP, ESEOO, IBI-ROOS and GODAE, among others. Indeed, they aim at developing
operational forecasting systems on global and regional scales and will lead to a co-ordinated network of regional systems which
will provide the platform required for coastal forecasting systems.
After a short introduction by Fanjul reminding us of the challenge modellers are facing while dealing with high frequency
processes in their ocean models, this issue displays four scientific articles, each dealing with state of the art work about high
frequency waves. Lamouroux et al. start with a paper studying the sensitivity of a barotropic model (MOG2D) to high frequency
atmospheric forcing, with the use of data assimilation to correct for the model deficiencies. Carrere et al. are then writing about
how they combine high frequency sea level signals from the same barotropic model (MOG2D) with low frequency sea level
outputs in order to estimate absolute sea level. Bouruet-Aubertot follows with an article about the generation of inertia-gravity
waves by the atmospheric forcing as inferred from in situ measurements and ocean models. She reminds us that the breaking of
inertia-gravity waves is of great importance as it could be responsible for most of the turbulent mixing in the ocean interior. At
last, Ardhuin et al. tell us how a numerical model based on the physical reality of the air-sea interface may provide better results
for the sea state in terms of surface currents and drift, mixed layer depth, and air-sea momentum flux.
Out of the scope of this newsletter, but interesting enough to be mentioned, high frequency processes as waves and tides gather
also a lot of attention as they constitute a huge energy source. New technologies are being developed to produce electricity
using the wave-induced or tide-induced energy as with the Pelamis and HydroHélix systems (see Figure). The Pelamis is an offshore
wave energy converter which uses the wave-induced motion to produce electricity. It is anticipated that future `wave farm'
would occupy a square kilometre of ocean and provide sufficient electricity for 20,000 homes. HydroHélix is another structure using tides energy to produce electricity. It is expected that 5.000 turbines could be installed offshore Brittany, supplying enough
electricity for the North-West of France.
Let us also remind you that our annual operational oceanography group meeting (Groupe Mission Mercator Coriolis, GMMC)
will take place on December 4 to 6 2006 in Toulouse (MeteoFrance site). We are looking forward to tell you about our ongoing
progress here at Mercator-Ocean, and to hear about yours.
We wish you a pleasant reading, and will
Flooding problem raised seriously in the watershed
of Medjerda indeed flood risk factors still exists for some cities.
Studies forecasting and flood management may be important to
address these problems. The plain of Bou Salem had long known
catastrophic floods. Sudden rain, releases of dams and tributaries
flows caused historic flooding at the level of this plain. We
recovered thirty floods in the station of Bou Salem during the
period 1973-2013. Among the thirty floods, we distinguish mainly
three Flash floods. In fact, Flash flood is a short and sudden local
flood with great volume, it has a limited duration which follows
within few (usually less than six) hours of heavy or excessive
rainfall, rapid rain, or after a sudden release of water from a
dam. This communication is designed to analyze the results of the
flash floods forecasting by simple propagation models namely
Muskingum and Regression. The method of forecasting depends
on the upstream station flow and models coefficients of
antecedent floods. Forecast periods range from 2 to 8 hours, with
a pitch of 2 hours. We used numerical criteria, such as Nash
coefficient, peak relative error and time separating observed and
calculated pic, to evaluate the results. We noted that the
satisfaction of all criteria together is not touched. The results
were satisfactory with Nash coefficient ranging from 71% to
99.8%.
This document discusses flooding, its causes and types, flood management measures, and methods for estimating design floods. It provides definitions and examples of different types of flooding such as river flooding, flash floods, urban flooding, and flooding from dam failures. Both structural and non-structural flood management measures are described, including embankments, reservoirs, forecasting, and zoning. Methods for estimating design floods include analyzing historical flood data, rainfall-runoff modeling, and storm studies using unit hydrographs. Accurately estimating design floods is important for safely designing hydraulic structures.
Sediment Source and Transport in River Channels: Implications for River Struc...theijes
This document discusses sediment source and transport in river channels and its implications for river structures. It contains 3 key points:
1) Rivers naturally transport and accumulate sediments from erosion. Understanding sediment characteristics and transport processes is important for managing rivers and engineering structures like dams and bridges.
2) Sediments are transported via various modes including bedload, suspended load, and dissolved load. Factors like particle size, water flow, and channel geometry determine sediment transport rates.
3) High sediment influx can negatively impact structures like filling reservoirs in dams, disturbing turbine blades, and exposing foundations around bridge piers to erosion. Understanding sediment dynamics helps mitigate these problems and extend the lifespan of river engineering projects.
IRJET- Hydrological Modeling of Penganga Sub-Basin using Arc-SWATIRJET Journal
This document discusses hydrological modeling of the Penganga sub-basin in India using the ArcSWAT model. It provides background on the hydrological cycle and importance of hydrological modeling. The study aims to simulate stream flow in the Penganga river to help water resource managers. Input data on soil, climate and land use were generated from GIS. The basin was delineated and hydrological response units were defined in ArcSWAT. The SWAT model was calibrated and validated, with results found to satisfactorily represent the hydrological regime of the sub-basin. The calibrated model can be used to inform future water resource management in the area.
CAMBRIDGE AS GEOGRAPHY REVISION: HYDROLOGY AND FLUVIAL GEOMORPHOLOGY - 1.4 HU...George Dumitrache
1. The document discusses key terms and definitions related to hydrology and fluvial geomorphology such as abstraction, bankfull stage, channelization, discharge, drainage basin, and floodplain.
2. It also discusses the impact of human activity on various components of the hydrological cycle including precipitation, evaporation, runoff, infiltration and groundwater stores.
3. Large dams and urbanization are highlighted as human activities that can seriously affect floods and river flows by changing infiltration, storage and flow rates.
A detailed explanation of the scheme of Tidal power production is given.Two live examples along with types of schemes,scenario in the world are elucidated.
This document provides an overview of floods, including their causes, types, effects, and management. It discusses intrinsic and extrinsic factors that can cause flooding when thresholds are exceeded. The main causes of flooding are meteorological, hydrological, and anthropogenic factors like urbanization and deforestation. Common flood types are river floods, flash floods, coastal floods, and urban floods. Estimating floods involves past records, the Rational Method, and flood frequency studies. Design floods are selected based on their return period and probability. Prone areas in India are mapped. Flood management strategies include building on raised platforms, afforestation, forecasting, and controlling water flow with dams.
2010 liongson-flood mitigation in metro manila-phil engg journal articleleony1948
Flood Mitigation in Metro Manila
Leonardo Q. Liongson
Academician, National Academy of Science and Technology
and Professor, Institute of Civil Engineering, UP Diliman
Abstract:
Tropical Storm Ondoy (Ketsana) crossed Metro Manila and the adjacent river basins in a late wet-season episode of 2009, starting in the evening of September 25, 2009 and continuing into the next day of September 26, 2009. TS Ondoy brought very intense and heavy rainfall to the region: meaning that record amounts of rains fell over a very short time period of 12 hours to 24 hours, which are estimated to occur at an average annual frequency of 1 in 100 years or even higher, depending on the measuring location in the region. The rains generated record-magnitude flood flows and inundation in the Pasig-Marikina River Basin in Metro Manila, and the Laguna de Bay region. This article briefly explains the present situation in the flood management in Metro Manila, covers the
various government flood-mitigation projects, and after briefly describing the pattern and statistics of the rainfall and flood flows associated with the major storm and their resulting physical impacts, risks and damages to the metropolis, provides recommendations, both in terms of structural and non-structural mitigation measures, for everyone concerned.
This document provides an overview of coastal engineering processes and applications. It begins with an introduction to coastal processes, including terminology, typical coastal zones, and examples of engineering projects. It then covers topics like sediment characteristics, long-term processes like sea level rise, hydrodynamics including tides, storms, and water waves. Methods for measuring and modeling coastal responses are discussed, along with techniques for modifying shorelines like beach nourishment and hard structures. The document uses diagrams and photographs of international case studies to illustrate key concepts in coastal engineering.
This document summarizes research on floating breakwaters for protecting harbors. It discusses:
1) The development of a theoretical model to predict floating breakwater performance based on field measurements at sites like Friday Harbor, Washington.
2) Results from instrumentation at the Friday Harbor site that validate the theoretical model and show how factors like wave frequency influence transmission.
3) Problems comparing different breakwater designs and the need for a standardized performance metric.
4) Evidence that nonlinear effects like long-period oscillations in mooring forces require further research.
This document discusses flood management and defines different types of floods. It describes floods as overflow of water beyond normal limits, especially over dry land. It discusses causes of floods such as heavy rainfall and overflowing rivers and oceans. The effects of floods include disrupted transportation, damage to infrastructure, health hazards from contaminated water, and destruction of agricultural land and crops. The document also defines structural and non-structural flood control measures. Structural methods include dams, water gates, and diversion canals to redirect flood waters.
This document discusses floods and methods for estimating peak flood discharge. It begins by defining a flood and design flood. It then describes various methods for estimating peak flood discharge, including using physical indicators, empirical formulas, unit hydrographs, the rational method, and flood frequency studies. As an example of applying the rational method, it calculates the peak discharge for a culvert project in Alberta, Canada with a 50-year return period. It also provides an example of using Gumbel's extreme value distribution to estimate flood discharges with 100-year and 150-year return periods based on annual maximum flood data from 1951-1977.
This document discusses reservoir sedimentation and methods for managing sediment in reservoirs. It begins by describing physical processes in watersheds like weathering, erosion, and sediment yield. Methods for estimating sediment yield in a watershed are then presented. The document outlines three forms of sediment transport in rivers and describes depositional zones in reservoirs. Consequences of reservoir sedimentation include loss of storage capacity. Elements of sediment management include reducing sediment inflow, routing sediments, removal of deposited sediments, providing large storage volumes, and sediment placement. Case studies on sediment routing at the Three Gorges Dam and the Sanmenxia Key Water Control Project in China are also summarized.
Discrepancy between knowing a coastal system and mathematical modelling 11112017Marco Pluijm
1) A groyne was built in the 1990s off the coast of Texel island in the Netherlands to slow coastal erosion. Extensive modeling was done but the actual effects were very different than predicted, with accretion occurring on the opposite side instead of reduced erosion.
2) The discrepancy showed that coastal sediment transport processes are still not fully understood and incorporated into models. Phenomenological approaches based on empirical data were sidelined in favor of mathematical modeling.
3) The author argues that a new proposed mega-nourishment project in the same area as the previous groyne poses risks, as coastal dynamics are too complex to be properly modeled given current limitations. A phenomenological approach based on field data is
This document describes a numerical study of hydrodynamics and cohesive sediment transport in the Cua Lo and Cua Hoi estuaries in Vietnam. A two-dimensional model was developed, calibrated, and verified to investigate hydrodynamics, sediment transport, and morphological changes under the influence of tides, river discharge, and seasonal monsoon winds and waves. Model results show opposite nearshore currents between the northeast and southeast monsoons and indicate wave climate is the main control of sediment transport. Sediment transport patterns between the two estuaries are influenced by an island and headland between them.
The document provides an overview of tidal energy, including:
- Tidal energy harnesses the gravitational pull of the moon and sun to generate waves that can be captured by tidal turbines or barrages.
- While tidal power has been used since the 9th century, the first large tidal power plant was built in France in 1967 and generates 240 MW.
- Tidal energy has advantages like being predictable and having high energy density, but also challenges like high costs and potential environmental impacts.
- The document discusses different tidal energy technologies and their applications, environmental effects, and regulatory considerations.
River flood modelling with mike 11 case of nzoia river (budalangi) in kenyaAlexander Decker
This document presents a study that uses the one-dimensional MIKE 11 hydrodynamic model to simulate flooding in the lower Nzoia River basin in Kenya. The study area focuses on the Budalangi floodplains. The objectives are to implement the MIKE 11 model for this river reach and investigate the 2008 Budalangi floods. The model is set up using surveyed river cross-section data and boundary conditions. Two scenarios are modeled - an intact dyke case and a breached dyke case. The results show that the 2008 flooding was mainly caused by dyke breach based on the longitudinal water level profiles produced.
River flood modelling with mike 11 case of nzoia river (budalangi) in kenyaAlexander Decker
This document presents a study that uses the one-dimensional MIKE 11 hydrodynamic model to simulate flooding in the lower Nzoia River basin in Kenya. The study area focuses on the Budalangi floodplains. The objectives are to implement the MIKE 11 model for this river reach and investigate the 2008 Budalangi floods. The model is set up using surveyed river cross-section data and boundary conditions. Two scenarios are modeled - an intact dyke case and a breached dyke case. The results show that the 2008 flooding was mainly caused by dyke breach. The optimal computational time step and spatial step for model stability are found to be 1 minute and 500m, respectively.
The Effect of Declination on The Tide Pattern in Hydroghraphic SurveyingNzar Braim
The Effect of Declination on The Tide Pattern in Hydroghraphic Surveying.
I was discussed about the tide and what's meaning of tide
and I explained it with simple figure
Comparative analysis between traditional aquaponics and reconstructed aquapon...bijceesjournal
The aquaponic system of planting is a method that does not require soil usage. It is a method that only needs water, fish, lava rocks (a substitute for soil), and plants. Aquaponic systems are sustainable and environmentally friendly. Its use not only helps to plant in small spaces but also helps reduce artificial chemical use and minimizes excess water use, as aquaponics consumes 90% less water than soil-based gardening. The study applied a descriptive and experimental design to assess and compare conventional and reconstructed aquaponic methods for reproducing tomatoes. The researchers created an observation checklist to determine the significant factors of the study. The study aims to determine the significant difference between traditional aquaponics and reconstructed aquaponics systems propagating tomatoes in terms of height, weight, girth, and number of fruits. The reconstructed aquaponics system’s higher growth yield results in a much more nourished crop than the traditional aquaponics system. It is superior in its number of fruits, height, weight, and girth measurement. Moreover, the reconstructed aquaponics system is proven to eliminate all the hindrances present in the traditional aquaponics system, which are overcrowding of fish, algae growth, pest problems, contaminated water, and dead fish.
Greetings all,
This month’s newsletter is dedicated to high frequency processes. It is mandatory to resolve such high frequency processes in
regional and coastal forecasting systems. Taking them into account constitutes thus one of the main goals of several projects or
networks as MERSEA, MOON, ECOOP, ESEOO, IBI-ROOS and GODAE, among others. Indeed, they aim at developing
operational forecasting systems on global and regional scales and will lead to a co-ordinated network of regional systems which
will provide the platform required for coastal forecasting systems.
After a short introduction by Fanjul reminding us of the challenge modellers are facing while dealing with high frequency
processes in their ocean models, this issue displays four scientific articles, each dealing with state of the art work about high
frequency waves. Lamouroux et al. start with a paper studying the sensitivity of a barotropic model (MOG2D) to high frequency
atmospheric forcing, with the use of data assimilation to correct for the model deficiencies. Carrere et al. are then writing about
how they combine high frequency sea level signals from the same barotropic model (MOG2D) with low frequency sea level
outputs in order to estimate absolute sea level. Bouruet-Aubertot follows with an article about the generation of inertia-gravity
waves by the atmospheric forcing as inferred from in situ measurements and ocean models. She reminds us that the breaking of
inertia-gravity waves is of great importance as it could be responsible for most of the turbulent mixing in the ocean interior. At
last, Ardhuin et al. tell us how a numerical model based on the physical reality of the air-sea interface may provide better results
for the sea state in terms of surface currents and drift, mixed layer depth, and air-sea momentum flux.
Out of the scope of this newsletter, but interesting enough to be mentioned, high frequency processes as waves and tides gather
also a lot of attention as they constitute a huge energy source. New technologies are being developed to produce electricity
using the wave-induced or tide-induced energy as with the Pelamis and HydroHélix systems (see Figure). The Pelamis is an offshore
wave energy converter which uses the wave-induced motion to produce electricity. It is anticipated that future `wave farm'
would occupy a square kilometre of ocean and provide sufficient electricity for 20,000 homes. HydroHélix is another structure using tides energy to produce electricity. It is expected that 5.000 turbines could be installed offshore Brittany, supplying enough
electricity for the North-West of France.
Let us also remind you that our annual operational oceanography group meeting (Groupe Mission Mercator Coriolis, GMMC)
will take place on December 4 to 6 2006 in Toulouse (MeteoFrance site). We are looking forward to tell you about our ongoing
progress here at Mercator-Ocean, and to hear about yours.
We wish you a pleasant reading, and will
Flooding problem raised seriously in the watershed
of Medjerda indeed flood risk factors still exists for some cities.
Studies forecasting and flood management may be important to
address these problems. The plain of Bou Salem had long known
catastrophic floods. Sudden rain, releases of dams and tributaries
flows caused historic flooding at the level of this plain. We
recovered thirty floods in the station of Bou Salem during the
period 1973-2013. Among the thirty floods, we distinguish mainly
three Flash floods. In fact, Flash flood is a short and sudden local
flood with great volume, it has a limited duration which follows
within few (usually less than six) hours of heavy or excessive
rainfall, rapid rain, or after a sudden release of water from a
dam. This communication is designed to analyze the results of the
flash floods forecasting by simple propagation models namely
Muskingum and Regression. The method of forecasting depends
on the upstream station flow and models coefficients of
antecedent floods. Forecast periods range from 2 to 8 hours, with
a pitch of 2 hours. We used numerical criteria, such as Nash
coefficient, peak relative error and time separating observed and
calculated pic, to evaluate the results. We noted that the
satisfaction of all criteria together is not touched. The results
were satisfactory with Nash coefficient ranging from 71% to
99.8%.
This document discusses flooding, its causes and types, flood management measures, and methods for estimating design floods. It provides definitions and examples of different types of flooding such as river flooding, flash floods, urban flooding, and flooding from dam failures. Both structural and non-structural flood management measures are described, including embankments, reservoirs, forecasting, and zoning. Methods for estimating design floods include analyzing historical flood data, rainfall-runoff modeling, and storm studies using unit hydrographs. Accurately estimating design floods is important for safely designing hydraulic structures.
Sediment Source and Transport in River Channels: Implications for River Struc...theijes
This document discusses sediment source and transport in river channels and its implications for river structures. It contains 3 key points:
1) Rivers naturally transport and accumulate sediments from erosion. Understanding sediment characteristics and transport processes is important for managing rivers and engineering structures like dams and bridges.
2) Sediments are transported via various modes including bedload, suspended load, and dissolved load. Factors like particle size, water flow, and channel geometry determine sediment transport rates.
3) High sediment influx can negatively impact structures like filling reservoirs in dams, disturbing turbine blades, and exposing foundations around bridge piers to erosion. Understanding sediment dynamics helps mitigate these problems and extend the lifespan of river engineering projects.
IRJET- Hydrological Modeling of Penganga Sub-Basin using Arc-SWATIRJET Journal
This document discusses hydrological modeling of the Penganga sub-basin in India using the ArcSWAT model. It provides background on the hydrological cycle and importance of hydrological modeling. The study aims to simulate stream flow in the Penganga river to help water resource managers. Input data on soil, climate and land use were generated from GIS. The basin was delineated and hydrological response units were defined in ArcSWAT. The SWAT model was calibrated and validated, with results found to satisfactorily represent the hydrological regime of the sub-basin. The calibrated model can be used to inform future water resource management in the area.
CAMBRIDGE AS GEOGRAPHY REVISION: HYDROLOGY AND FLUVIAL GEOMORPHOLOGY - 1.4 HU...George Dumitrache
1. The document discusses key terms and definitions related to hydrology and fluvial geomorphology such as abstraction, bankfull stage, channelization, discharge, drainage basin, and floodplain.
2. It also discusses the impact of human activity on various components of the hydrological cycle including precipitation, evaporation, runoff, infiltration and groundwater stores.
3. Large dams and urbanization are highlighted as human activities that can seriously affect floods and river flows by changing infiltration, storage and flow rates.
A detailed explanation of the scheme of Tidal power production is given.Two live examples along with types of schemes,scenario in the world are elucidated.
This document provides an overview of floods, including their causes, types, effects, and management. It discusses intrinsic and extrinsic factors that can cause flooding when thresholds are exceeded. The main causes of flooding are meteorological, hydrological, and anthropogenic factors like urbanization and deforestation. Common flood types are river floods, flash floods, coastal floods, and urban floods. Estimating floods involves past records, the Rational Method, and flood frequency studies. Design floods are selected based on their return period and probability. Prone areas in India are mapped. Flood management strategies include building on raised platforms, afforestation, forecasting, and controlling water flow with dams.
2010 liongson-flood mitigation in metro manila-phil engg journal articleleony1948
Flood Mitigation in Metro Manila
Leonardo Q. Liongson
Academician, National Academy of Science and Technology
and Professor, Institute of Civil Engineering, UP Diliman
Abstract:
Tropical Storm Ondoy (Ketsana) crossed Metro Manila and the adjacent river basins in a late wet-season episode of 2009, starting in the evening of September 25, 2009 and continuing into the next day of September 26, 2009. TS Ondoy brought very intense and heavy rainfall to the region: meaning that record amounts of rains fell over a very short time period of 12 hours to 24 hours, which are estimated to occur at an average annual frequency of 1 in 100 years or even higher, depending on the measuring location in the region. The rains generated record-magnitude flood flows and inundation in the Pasig-Marikina River Basin in Metro Manila, and the Laguna de Bay region. This article briefly explains the present situation in the flood management in Metro Manila, covers the
various government flood-mitigation projects, and after briefly describing the pattern and statistics of the rainfall and flood flows associated with the major storm and their resulting physical impacts, risks and damages to the metropolis, provides recommendations, both in terms of structural and non-structural mitigation measures, for everyone concerned.
This document provides an overview of coastal engineering processes and applications. It begins with an introduction to coastal processes, including terminology, typical coastal zones, and examples of engineering projects. It then covers topics like sediment characteristics, long-term processes like sea level rise, hydrodynamics including tides, storms, and water waves. Methods for measuring and modeling coastal responses are discussed, along with techniques for modifying shorelines like beach nourishment and hard structures. The document uses diagrams and photographs of international case studies to illustrate key concepts in coastal engineering.
This document summarizes research on floating breakwaters for protecting harbors. It discusses:
1) The development of a theoretical model to predict floating breakwater performance based on field measurements at sites like Friday Harbor, Washington.
2) Results from instrumentation at the Friday Harbor site that validate the theoretical model and show how factors like wave frequency influence transmission.
3) Problems comparing different breakwater designs and the need for a standardized performance metric.
4) Evidence that nonlinear effects like long-period oscillations in mooring forces require further research.
This document discusses flood management and defines different types of floods. It describes floods as overflow of water beyond normal limits, especially over dry land. It discusses causes of floods such as heavy rainfall and overflowing rivers and oceans. The effects of floods include disrupted transportation, damage to infrastructure, health hazards from contaminated water, and destruction of agricultural land and crops. The document also defines structural and non-structural flood control measures. Structural methods include dams, water gates, and diversion canals to redirect flood waters.
This document discusses floods and methods for estimating peak flood discharge. It begins by defining a flood and design flood. It then describes various methods for estimating peak flood discharge, including using physical indicators, empirical formulas, unit hydrographs, the rational method, and flood frequency studies. As an example of applying the rational method, it calculates the peak discharge for a culvert project in Alberta, Canada with a 50-year return period. It also provides an example of using Gumbel's extreme value distribution to estimate flood discharges with 100-year and 150-year return periods based on annual maximum flood data from 1951-1977.
This document discusses reservoir sedimentation and methods for managing sediment in reservoirs. It begins by describing physical processes in watersheds like weathering, erosion, and sediment yield. Methods for estimating sediment yield in a watershed are then presented. The document outlines three forms of sediment transport in rivers and describes depositional zones in reservoirs. Consequences of reservoir sedimentation include loss of storage capacity. Elements of sediment management include reducing sediment inflow, routing sediments, removal of deposited sediments, providing large storage volumes, and sediment placement. Case studies on sediment routing at the Three Gorges Dam and the Sanmenxia Key Water Control Project in China are also summarized.
Discrepancy between knowing a coastal system and mathematical modelling 11112017Marco Pluijm
1) A groyne was built in the 1990s off the coast of Texel island in the Netherlands to slow coastal erosion. Extensive modeling was done but the actual effects were very different than predicted, with accretion occurring on the opposite side instead of reduced erosion.
2) The discrepancy showed that coastal sediment transport processes are still not fully understood and incorporated into models. Phenomenological approaches based on empirical data were sidelined in favor of mathematical modeling.
3) The author argues that a new proposed mega-nourishment project in the same area as the previous groyne poses risks, as coastal dynamics are too complex to be properly modeled given current limitations. A phenomenological approach based on field data is
This document describes a numerical study of hydrodynamics and cohesive sediment transport in the Cua Lo and Cua Hoi estuaries in Vietnam. A two-dimensional model was developed, calibrated, and verified to investigate hydrodynamics, sediment transport, and morphological changes under the influence of tides, river discharge, and seasonal monsoon winds and waves. Model results show opposite nearshore currents between the northeast and southeast monsoons and indicate wave climate is the main control of sediment transport. Sediment transport patterns between the two estuaries are influenced by an island and headland between them.
The document provides an overview of tidal energy, including:
- Tidal energy harnesses the gravitational pull of the moon and sun to generate waves that can be captured by tidal turbines or barrages.
- While tidal power has been used since the 9th century, the first large tidal power plant was built in France in 1967 and generates 240 MW.
- Tidal energy has advantages like being predictable and having high energy density, but also challenges like high costs and potential environmental impacts.
- The document discusses different tidal energy technologies and their applications, environmental effects, and regulatory considerations.
River flood modelling with mike 11 case of nzoia river (budalangi) in kenyaAlexander Decker
This document presents a study that uses the one-dimensional MIKE 11 hydrodynamic model to simulate flooding in the lower Nzoia River basin in Kenya. The study area focuses on the Budalangi floodplains. The objectives are to implement the MIKE 11 model for this river reach and investigate the 2008 Budalangi floods. The model is set up using surveyed river cross-section data and boundary conditions. Two scenarios are modeled - an intact dyke case and a breached dyke case. The results show that the 2008 flooding was mainly caused by dyke breach based on the longitudinal water level profiles produced.
River flood modelling with mike 11 case of nzoia river (budalangi) in kenyaAlexander Decker
This document presents a study that uses the one-dimensional MIKE 11 hydrodynamic model to simulate flooding in the lower Nzoia River basin in Kenya. The study area focuses on the Budalangi floodplains. The objectives are to implement the MIKE 11 model for this river reach and investigate the 2008 Budalangi floods. The model is set up using surveyed river cross-section data and boundary conditions. Two scenarios are modeled - an intact dyke case and a breached dyke case. The results show that the 2008 flooding was mainly caused by dyke breach. The optimal computational time step and spatial step for model stability are found to be 1 minute and 500m, respectively.
The Effect of Declination on The Tide Pattern in Hydroghraphic SurveyingNzar Braim
The Effect of Declination on The Tide Pattern in Hydroghraphic Surveying.
I was discussed about the tide and what's meaning of tide
and I explained it with simple figure
Similar to Application of SWMM to the Flooding Problem in Truro Nova Scotia.pdf (20)
Comparative analysis between traditional aquaponics and reconstructed aquapon...bijceesjournal
The aquaponic system of planting is a method that does not require soil usage. It is a method that only needs water, fish, lava rocks (a substitute for soil), and plants. Aquaponic systems are sustainable and environmentally friendly. Its use not only helps to plant in small spaces but also helps reduce artificial chemical use and minimizes excess water use, as aquaponics consumes 90% less water than soil-based gardening. The study applied a descriptive and experimental design to assess and compare conventional and reconstructed aquaponic methods for reproducing tomatoes. The researchers created an observation checklist to determine the significant factors of the study. The study aims to determine the significant difference between traditional aquaponics and reconstructed aquaponics systems propagating tomatoes in terms of height, weight, girth, and number of fruits. The reconstructed aquaponics system’s higher growth yield results in a much more nourished crop than the traditional aquaponics system. It is superior in its number of fruits, height, weight, and girth measurement. Moreover, the reconstructed aquaponics system is proven to eliminate all the hindrances present in the traditional aquaponics system, which are overcrowding of fish, algae growth, pest problems, contaminated water, and dead fish.
Advanced control scheme of doubly fed induction generator for wind turbine us...IJECEIAES
This paper describes a speed control device for generating electrical energy on an electricity network based on the doubly fed induction generator (DFIG) used for wind power conversion systems. At first, a double-fed induction generator model was constructed. A control law is formulated to govern the flow of energy between the stator of a DFIG and the energy network using three types of controllers: proportional integral (PI), sliding mode controller (SMC) and second order sliding mode controller (SOSMC). Their different results in terms of power reference tracking, reaction to unexpected speed fluctuations, sensitivity to perturbations, and resilience against machine parameter alterations are compared. MATLAB/Simulink was used to conduct the simulations for the preceding study. Multiple simulations have shown very satisfying results, and the investigations demonstrate the efficacy and power-enhancing capabilities of the suggested control system.
A review on techniques and modelling methodologies used for checking electrom...nooriasukmaningtyas
The proper function of the integrated circuit (IC) in an inhibiting electromagnetic environment has always been a serious concern throughout the decades of revolution in the world of electronics, from disjunct devices to today’s integrated circuit technology, where billions of transistors are combined on a single chip. The automotive industry and smart vehicles in particular, are confronting design issues such as being prone to electromagnetic interference (EMI). Electronic control devices calculate incorrect outputs because of EMI and sensors give misleading values which can prove fatal in case of automotives. In this paper, the authors have non exhaustively tried to review research work concerned with the investigation of EMI in ICs and prediction of this EMI using various modelling methodologies and measurement setups.
International Conference on NLP, Artificial Intelligence, Machine Learning an...gerogepatton
International Conference on NLP, Artificial Intelligence, Machine Learning and Applications (NLAIM 2024) offers a premier global platform for exchanging insights and findings in the theory, methodology, and applications of NLP, Artificial Intelligence, Machine Learning, and their applications. The conference seeks substantial contributions across all key domains of NLP, Artificial Intelligence, Machine Learning, and their practical applications, aiming to foster both theoretical advancements and real-world implementations. With a focus on facilitating collaboration between researchers and practitioners from academia and industry, the conference serves as a nexus for sharing the latest developments in the field.
KuberTENes Birthday Bash Guadalajara - K8sGPT first impressionsVictor Morales
K8sGPT is a tool that analyzes and diagnoses Kubernetes clusters. This presentation was used to share the requirements and dependencies to deploy K8sGPT in a local environment.
Introduction- e - waste – definition - sources of e-waste– hazardous substances in e-waste - effects of e-waste on environment and human health- need for e-waste management– e-waste handling rules - waste minimization techniques for managing e-waste – recycling of e-waste - disposal treatment methods of e- waste – mechanism of extraction of precious metal from leaching solution-global Scenario of E-waste – E-waste in India- case studies.
DEEP LEARNING FOR SMART GRID INTRUSION DETECTION: A HYBRID CNN-LSTM-BASED MODELgerogepatton
As digital technology becomes more deeply embedded in power systems, protecting the communication
networks of Smart Grids (SG) has emerged as a critical concern. Distributed Network Protocol 3 (DNP3)
represents a multi-tiered application layer protocol extensively utilized in Supervisory Control and Data
Acquisition (SCADA)-based smart grids to facilitate real-time data gathering and control functionalities.
Robust Intrusion Detection Systems (IDS) are necessary for early threat detection and mitigation because
of the interconnection of these networks, which makes them vulnerable to a variety of cyberattacks. To
solve this issue, this paper develops a hybrid Deep Learning (DL) model specifically designed for intrusion
detection in smart grids. The proposed approach is a combination of the Convolutional Neural Network
(CNN) and the Long-Short-Term Memory algorithms (LSTM). We employed a recent intrusion detection
dataset (DNP3), which focuses on unauthorized commands and Denial of Service (DoS) cyberattacks, to
train and test our model. The results of our experiments show that our CNN-LSTM method is much better
at finding smart grid intrusions than other deep learning algorithms used for classification. In addition,
our proposed approach improves accuracy, precision, recall, and F1 score, achieving a high detection
accuracy rate of 99.50%.
CHINA’S GEO-ECONOMIC OUTREACH IN CENTRAL ASIAN COUNTRIES AND FUTURE PROSPECTjpsjournal1
The rivalry between prominent international actors for dominance over Central Asia's hydrocarbon
reserves and the ancient silk trade route, along with China's diplomatic endeavours in the area, has been
referred to as the "New Great Game." This research centres on the power struggle, considering
geopolitical, geostrategic, and geoeconomic variables. Topics including trade, political hegemony, oil
politics, and conventional and nontraditional security are all explored and explained by the researcher.
Using Mackinder's Heartland, Spykman Rimland, and Hegemonic Stability theories, examines China's role
in Central Asia. This study adheres to the empirical epistemological method and has taken care of
objectivity. This study analyze primary and secondary research documents critically to elaborate role of
china’s geo economic outreach in central Asian countries and its future prospect. China is thriving in trade,
pipeline politics, and winning states, according to this study, thanks to important instruments like the
Shanghai Cooperation Organisation and the Belt and Road Economic Initiative. According to this study,
China is seeing significant success in commerce, pipeline politics, and gaining influence on other
governments. This success may be attributed to the effective utilisation of key tools such as the Shanghai
Cooperation Organisation and the Belt and Road Economic Initiative.
Application of SWMM to the Flooding Problem in Truro Nova Scotia.pdf
1. Full Terms & Conditions of access and use can be found at
https://www.tandfonline.com/action/journalInformation?journalCode=tcwr20
Canadian Water Resources Journal
ISSN: 0701-1784 (Print) 1918-1817 (Online) Journal homepage: https://www.tandfonline.com/loi/tcwr20
Application of SWMM to the Flooding Problem in
Truro, Nova Scotia
Ayad El-Sharif & David Hansen
To cite this article: Ayad El-Sharif & David Hansen (2001) Application of SWMM to the Flooding
Problem in Truro, Nova Scotia , Canadian Water Resources Journal, 26:4, 439-459, DOI: 10.4296/
cwrj2604439
To link to this article: https://doi.org/10.4296/cwrj2604439
Published online: 23 Jan 2013.
Submit your article to this journal
Article views: 756
View related articles
Citing articles: 3 View citing articles
2. Application of SWMM to the Flooding Problem
in Truro, Nova Scotia
Submitted September 2000; accepted May 2001
Written comments on this paper will be accepted until June 2002
Ayad El-Sharifland David Hansen2
ABSTRACT
The town of turo, Nova Scotia, has a long history of flooding problems, partly due
to its proximity to the Bay of Fundy and the extreme tidal variations that occur in
the Bay. The nature and extent of the unsteadiness of the flow in the downstream
reaches of the Salmon River, which flows through Truro, are lesser known. These
aspects of the hydraulics are complicated by the fact that many of the complaints
about water damage appear to be related to the storm sewer system, much of which
is o1d, and none of which could be considered to actually manage stormwater. Yet,
management of stormwater is indicated because the Salmon River is dyked along
much of its lower reaches, with aboiteau. present in some of these dykes. In this
study, the nature of the unsteadiness in the dynamic waves moving through the river
system and the relative importance of tidal effects were examined. The ability to
model the river and the storm sewer system in a unified manner was considered very
important, partly because of the aboiteau. The well-known U.S. trPA hydrologic/
hydraulic model 'SWMM' v.4.31. was selected for this purpose. It was of interest
to see how difficult it would be to adapt SWMM to the hydraulic problems of
Truro, even though SWMM is primarily used for designing/evaluating networks
of closed circular conduits. A representative part of the town's storm sewer system
was incorporated into the model to provide an indication of the severity of flooding.
Results were both interesting and favourable. It was found that the dynamic wave
caused by a 2-year flood event and a 100-year tide reached upstream as far the
Walker St. Bridge. This indicates that flood events result in a situation whereby a
one-way aboiteau, designed to permit the exit of Truro's stormwater, cannot do so
during the passage of large translatory waves. In addition, preliminary outcomes
of modelling Truro's stormwater system suggest that some of the flooding is often
caused not by an excess of water overtopping the dykes along the Salmon River,
but by the inadequacy of the storm sewers and the lack of any real management of
stormwater. Any future stormwater management plan should take into consideration
l Former Research Assistant and
2
Associate Professor, Dalhousie University, Sexton Campus, Department of Civil
E,ngineering, Halifax, NS
Canadian Water Resources Journal
Vol.26, N0.4,2001
439
3. the need for the translatory wave to first pass through the lower reaches of the
Salmon River, and should incorporate a flood warning system. It is recommended
that a flood-warning system be implemented for Truro and that SWMM be
seriously considered as the platform for operating such a system. SWMM would
likely be the best choice of operational model for such a warning system because it
can handle the natural and artificial systems under one platform.
REsUME
La ville de turo, en Nouvelle-Ecosse, connait depuis fort longtemps des probldmes
d'inondation, en partie i. cause de sa proximitd i 1a baie de Fundy et des variations de la
mar6e extr€mes qui se produisent dans la baie. La nature et l'ampleur de I'instabilit6 des
ddbits dans les passages en aval de la Rividre Saumon, qui traversent Truro, sont moins
connues. Ces aspects de l'hydraulique sont compliqu6s par le fait que bon nombre des
plaintes formul6es i. propos des d6gdts caus6s par l'eau semblent se rapporter au rdseau
d'6gouts pluvial, en grande partie trCs vieux, et dont on ne pourrait pas consid6rer qu'i1
gdre vraiment les eaux pluviales. Pourtant, la gestion des eaux pluviales est indiqu6e car la
Rividre Saumon comporte des digues le long de la majeure partie de ses biefs inferieurs,
avec un aboiteau
*
dans certaines de ces digues. Dans la pr6sente 6tude, on s'est pench6
sur la nature de cette instabilit6 dans 1es vagues dynamiques qui se d6placent d travers ce
r6seau fluvia1 et sur I'importance relative des effets des mar6es. La capacit6 de mod6liser
la rividre et le r6seau d'6gouts pluvial d'une manidre unifide a 6t6 jug6e trds importante,
en partie i cause de l'aboiteau. Le trds fameux moddle de simulation hydrologique et
hydraulique US trPA - OESWMMI v. 4.31a 6td retenu pour les besoins de l'6tude. 11
6tait intdressant dbbserver combien il serait difficile d'adapter le moddle de gestion des
eaux pluviales (SWMM) aux probldmes hydrauliques de turo, mdme si le " SWMM
" sert principalement i concevoir ou )" 6valuer les rdseaux de conduits circulaires ferm6s.
Une partie repr6sentative du r6seau d'6gouts pluvial de 1a ville a 6t6 int6gr6e au moddle
pour fournir une indication de 1'ampleur de I'inondation. Les r6sultats ont 6t6 i la fois
intdressants et favorables. On a constat6 que la vague dynamique causde par une crue i
r6currence de 20 ans et une mar6e i. rdcurrence de 100 ans atteignait aussi loin en amont
que le Walker St. Bridge. Cela indique que les inondations entrainent une situation oi
un aboiteau unidirectionnel, congu pour laisser s'dchapper les eaux pluviales de Truro,
n'arrive pas i le faire au moment du passage de grandes vagues de translation. De plus, les
rdsultats pr6liminaires de la mod6lisation du r6seau dtgouts pluvial de Tiuro indiquent
qu'une certaine partie de f inondation est souvent causde non pas par l'excds d'eau qui
d6borde des digues le long de la Rividre Saumon, mais par f inefEcacit6 des dgouts
*A gated culvert which only permits flow in the downstream direction. The
downstream ends are, in this case, located mainly in the estuarial reaches of the
river. Modest high tides are thereby prevented from flooding the town, but neither
can urban runoff leave the town when the tide is uo. Aboiteau' is an Acadian word
probably arising from the French'abattre'(to put down) and'eau'(water). There
are other less-common spellings, such as abateau.
440
Vol.26, N0.4,2001
Revue canadienne des ressources hydriques
4. pluviaux et le manque de v6ritable gestion des eaux pluviales. Tout plan futur de gestion
des eaux pluviales doit tenir compte du fait que la vague de translation doit d'abord
traverser les biefs in{Erieurs de la Rividre Saumon, et doit 6galement comprendre un
systdme d'avertissement de crue. I1 est recommand6 que le systtme d'avertissement soit
adopt6 i Tiuro et que le moddle SWMM soit envisagd sdrieusement i la plate-forme
pour le fonctionnement d'un tel systdme. Le moddle SWMM serait probablement le
meilleur choix de moddle d'exploitation pour un tel systdme d'avertissement car il peut
g6rer les systdmes naturels et artificiels sous une m€me plate-forme.
INTRODUCTION
Known as the 'Hub of Nova Scotia', the town of Tiuro, located 85 km northwest
Halifax, is a small town of about 12,000 people popular with tourists. The Salmon
River runs through the centre of town (Figure 1). The North River is a major tributary.
The Salmon and North Rivers drain a combined area of about 730 km2, and flow into
Cobequid Bay at the eastern end of the Bay of Fundy. The catchment area is devoid
of iakes and is primarily forested, with small amounts of agriculture. The North River
drains into the Salmon River, and the Salmon River debouches into a tidal estuary
near Burntcoat Head. The principal tributaries of the Salmon-North River system are
McClures, Lepper, Christie, Farnham, Soley and McCurdy Brooks.
This study attempts i) to better understand the spatial hydrodynamics of the system;
ii) to evaluate the potential interaction between the storm sewer sub-system and its much
larger receiving watercourse, one that acts both independently and with a high degree of
variability and iii) to determine if SWMM could be adapted to this task, knowing that it
was primarily designed for prismatic dendritic sewer systems. The research described in
this paper was based largely on data collected for the 1988 Maclaren Plansearch report
prepared for the Town of Truro. The Maclaren Plansearch study set out to predict a
maximum water surface profile for the river system flowing through the Tiuro-Bible
Hill area and to determine the necessary extent of the implied flood-risk mapping.
The main outcome was the determination of the maximum water surface orofile of the
Salmon-North River system for the 20- and 100-year return period events and the
determination of the associated flood-risk zones.
OBJECTIVES
1) Determination ofthe flood-wave type.
There are three categories of flood waves: kinematic, diffusive and
fully dynamic. This paper outlines available criteria for flood-wave
differentiation and describes a different way ofidentifying the type(s) of
flood wave at work in a flooding problem. This is of interest because it
potentially affects the amount of field work, the hydraulic complexity of
the problem and the numerical effort.
Canadian Water Resources Journal
Vol.26, N0.4,2001
441
5. a) Looking upstream and east. Shown here is the upstream limit ofthe study area, from approximately node 2600
to node 2400 in Figure 2. The river overflows toward the urban area shown at the bottom of photo (and beyond).
b) Floodplainjustdownstreamofthedownstreamlimitofthestudyarea(node2800inFigure2).Thereach
shown is close to (obequid Bay (on the Bay of Fundy) and is affected by the very large tidal variation in that bay.
Figure 1. Two Views of the Salmon River and 5ome of the Areas that Ftequently Experience Flood
Damage (Photos (ourtesy of Mr. Jon Noble, CBCL Ltd., Halifax).
442
Vol.26, N0.4,2001
Revue canadienne des ressources hydriques
6. 2) Reproduction of the 1988 Maclaren Plansearch results'
This research set out to reproduce, using SWMM, the maximum water
surface profile of the Saimon-North River system for the. 20- and
100-yeai design hydrographs and various outlet boundary conditions'
3) Evaluation of different scenarios for the river system'
The extent of the effect of the tides from the Bay of Fundy on the
maximum water surface profile of the river was investigated. The relative
importance of tide .,ersl,s river discharge in the determination of the
maximum water surface profile was also examined'
4) Study of flooding and surcharging problems for a representative
neighbourhood.
ThJ urban planner for the Town of Truro commented that "most of the
water-related complaints apPear to be related to runoff having 'nowhere
to go' rather than to tht 1,-rgr.r, of water from the Salmon River"
(Nison, 1998). This would indicate that a unified approach-must be
taken in studying turo's flooding problems' The U'S' trPA SWMM
modei appeat"a I t" well suited to examining such a problem' A small
neighbouihood that drains into Doggett's Brook and thence into the
Salmon River was selected as a case study' The storm sewer network
of this neighbourhood was added to the SWMM model of the Salmon-
North River system using the Runoff block of swMM. This included
examination of surcharging in the storm sewer network (as distinct from
flooding of the river sYstem).
PREVIOUS STUDIES
The flooding problem in turo and Bible Hill has been studied quite extensively
over the past
-90
years. As early as 7917, a study by Bell-Dawson Jnc' for the
Department of Naval Services investigated the tidal regime of cobequid Bay and
Burntcoat Head. Cox (1938) recom-.r-rd"d a set of remedial measures that included
modifications to the dyke system and channel recti{rcation measures' Several other
studies were done in the 1970s and were concerned mainly with the determination
of the tidal regime at Burntcoat Head in the tidal estuary of cobeqrrid Bay and
its relationship to the tidal regime at saint John, New Brunswick. In 1978, the
government of Cu.rudu und tf,. province of Nova Scotia entered into a general
igreement regarding flood damage reduction, resulting in the prepa_ration of flood-
.ik -up, urrifrrrthJr studies regarding possible remedial measures. In 1980, a study
by M.M. Di1lon Ltd. and W.N. Horner &Assoc. Ltd. emphasized the astronomical
and meteorological effects on tides. one of the main outcomes of this repoftwas a
set of regressio*n equations for predicting the tidal magnitude at Truro. The report
"Hydrotichnical Siudy of the Truro and Area Flood Plain" (Maclaren Plansearch,
tld8) was a relatively complete study that set out to determine the maximum water
Canadian Water Resources Journal
Vol.26, N0.4,2001
443
7. profile for the river system flowing through turo-Bible Hill, and the necessary
extent of the implied flood-risk mapping. Environment canada's one-D model
was used to generate these water surface profiles (Environment Canada, 1995;
Gunaratnam and Perkins, 1970).
A recent study entitled "turo Flood plain" (EDM, 1997) expanded somewhat
on the work done in the 1988 study, and also used the one-D -od.l. It attempted
to address the planning implications ofthe 1988 hydrotechnical study, and included
additional hydrotechnical work. The study area was revisited and the decades
of changes to the floodplain were included in the analysis. No comprehensive
stormwater management plan has ever been developed for the Town of turo.
METHOD
with respect to the choice of swMM, the authors are not aware of any other
single model that can simultaneously handle both the hydrology and hydraulics of
a network of storm sewers (that frequently surcharge) as well as the Mrology and
hydraulics of a natural receiving channel (with its own highly variable hydroiogy).
SWMM was also considered a good choice because there is a considerable amount
of experience, history and expertise with it in North America. The rainfall-runoff
algorithm used in swMM is called non-linear reservoir routing, in which the
so-called width of the sub-catchment and Mann tng's n are the key .orrtrolr. Table 1
gives the values of the various parameters. For sewer systems having relatively
steep slopes, the tansport block in SWMM then uses kinematic wave routins to
transmit inflow hydrographs downstream (Doggett's Brook and the salmon Rivlr).
The Extran block in swMM, used for modelling fu1ly dynamic translatory waves,
of the kind occurring in the salmon River, adopts a finite difference (FD) solution
of the st. venant equations. The FD numerical method used by swMM, known
as an enhanced explicit scheme, is accurate as long as the spatial and temporal
discretization is suitably fine (At and Ax not too large). In this case At was set equal
to 15 seconds and Ax to between 100 m (in and around upstream bridges) to g70b m
(downstream), with an average Ax of about 3000 m. The spacing w"as imposed by
the distance between cross-sections as provided by a previous sttidy that was based
on the Environment canada one-D model (which had no storm sewer comDonent).
The accuracy of the approximate finite difference method used by SWMMto solve
the St. venant equations was not examined in our work because this could not be
meaningfully assessed without hydraulic field data requiring the documentation of
actual dynamic waves of the Salmon River. This data-seidoes not yet exist but
should be collected if a flood-warning system is ro be considered by ihe Town of
turo. A11 three SWMM algorithms mentioned above are described in Bedient and
Huber (1992) and Huber and Dickinson (1988).
It was considered an important first step to investigate the degree to which
translatory waves moving through the salmon River aie indeed Jynamic. The
modelling of fu11y dynamic waves is computationally intensive and relatively difficult
in terms of calibration because true calibration requires simultaneous knowledge of
444
Vol.26, N0.4,2001
Revue canadienne des ressources hydriques
8. Area
No.
Area
(ha)
Length (L)
(m)
'widrh^
(A/L)
(m)
1.42.6
21.6.1
1.37.2
1,21..3
187.9
174.1
61..7
83.0
128.4
r-)z.J
24.6
83.7
1.1.5.6
55.8
42.5
75.0
69.3
Slope
(m/m)
Depression
storage for
pervious areas
(mm)'
1
2
3
4
5
o
7
8
9
10
11
12
l-)
1A
r-)
1/
IO
17
t.z)
1.40
l.l-)
1.71.
3.58
+.)r
0.47
1.06
2.30
1.84
0.30
1..02
2.82
2.21.
r. -)o
1.83
0.95
87.6
64.8
87.6
141.0
190.5
259.7
76.2
1.27.6
179.1.
139.7
121..9
1.21.9
243.8
396.2
320.0
243.8
1.37.2
0.0354
0.0074
0.0092
0.0109
0.0087
0.0367
0.1.444
0.0092
0.0087
0.0052
0.0797
0.0098
0.0082
0.0054
0.0131
0.0029
0.0262
4.0
8.5
7.7
7.0
7.8
3.9
2.0
7.7
7.8
10.1
5.3
7.4
8.1
10.0
6.4
1.3.4
4.6
Table 1. Characteristics of Doggett's Brook neighbourhood simulated using the Runoff block in
SWMM3.
3A Manning's n value of 0.011 was used for all impervious areas, and of 0.2 for
all pervious areas. The PC-SWMM'sensitivityWtzard'in the Runoff blockwas
used to determine that changes in n did not strongly affect the results, within
reasonable limits of z.
awhere L is the length of the path of a particle of water starting at the most distant
point in the sub-watershed.
s
calculated using Do = 0.0303 S 0 ae,
see Huber and Dickinson (1988)'
(anadian Water Resources Journal
Vol.26, N0.4,2001
445
9. the longitudinal and temporal variation in both flow and stage, and this is difficult
to obtain for even a single event. It is also known that the other extreme, kinematic
waves' are relatively easy to investigate and model. If conditions are kinematic, a
single flow of interest can be legitimately ascribed to an entire reach at a given
moment in time, and the implied field work is 1ess. Ponce (1989) has suggested two
criteria to determine whether a flood wave is kinematic, diffusive or fully dynamic.
The following dimensionless criteria to determine whether a flood wave is kinematic
or not were suggested:
tSV.
-ou>N 11 )
-;
- '/
where:
t, = time of rise of the input hydrograph (T);
s" = bottom slope of bed (dimensionless);
vo = average flow velocity (L/T);
do = flow depth (L); and
N = equal to 85,if 950/o accuracy is required over one period oftranslation.
The following criteria were suggested to determine whether a flood wave is diffusive
of not:
where:
g = gravitational acceleration (L/Tr); and
M = 15 (recommended).
If equation (2) is satisfied, then the flood wave associated with t_ is essentially
diffusive. When neither equation (1) nor (2) is true, then the wave is'dynamic, and
the use of lesser approximations is il1-advised. For events and boundary conditions of
interest these criteria were experimented with in order to determine the longitudinal
variation in the type of flood wave. The results of these numerical experiments (not
presented here) were found to be confusing and inconsistent, due partly to difficulty
of deciding what average depth and velocity to use. These quantities were found to
vary greatly over time for the Salmon River, as might be expected for a translatory
wave passing through a watercourse of this size. Thus, a more direct approach, based
on the temporal variation in friction slope s, relative to bed slope, was taken. This
quantity was examined for representative cross-sections at the beginning and near
the middle of the longitudinal profile, and near the outlet of the Salmon River.
For the reproduction of the various extreme water surface profiles generated
by the Maclaren Plansearch 1988 report, the Extran block in swMM was used.
'Extreme water surface pro6le'refers to a profile connecting the maximum water
surface elevations that occurred at different time steps: i.e. these water surface
446
Vol.26, N0.4,200'1
(2)
fql'!
t,s"lel 2 M
-LclJ
Revue canadienne des ressources hvdriques
10. w
h ",;
cgl
#Ef
!
a
Fl
U
I
L
7
!
J
4
23,
4
I
gY
f,
;
Y
E
a
9L
'E,i
i i|l
f 4
"
rE I
o-l
I
@
q
E
o
o
=
q
=
G
o
q
t,
ri
o
o
r
Canadian Water Resources Journal
Vol.26, No.4 2001
447
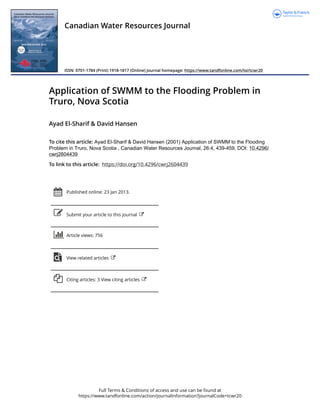
11. elevations were not reaTized simultaneously. The generation of such profiles required
data collected for the 1988 studv: a complete set of cross-sections for the Salmon
River, the North River, and McClures Brook, as well as any additional cross-
sectional data that were deemed necessary by EDM (7997) for their study. The
1988 Maclaren Plansearch study also included design flood hydrographs for the
three major rivers involr,ed and a set of boundary conditions for the Salmon River at
McNutt Brook (node 2800, Figure 2).
The upstream extent of the effect of various high tide scenarios on the Salmon
River was studied by comparing these high tide outcomes against outcomes that
used constant-elevation outlet boundary conditions, prepared using separate runs of
SWMM. The relative importance of tide vs. flow on water surface profile elevations
was examined by considering two extreme combinations: 1) a large river flow event
(a T = 100-year flow event) and a sma11 tidal event (a typical spring tide evenr); 2) a
modest flow event (aT = 2}-year flow event) and a large tidal event (a T = 100-year
tidal event). The outcomes of combining nominally extreme events was considered
to be of interest as a hypothetical endpoint of the behaviour of the system, so no
assumptions or detailed anolyses were made regarding the statistical independence
or non-independence of extreme rainfall events in relation to extreme tidal events.
A smal1 neighbourhood that drains its stormwater into Doggett's Brook was
taken as the basis for the behaviour of the storm sewer system and its interaction
with the river in a preliminary manner (Figure 3). Table 1 gives the characteristics
of the Doggett's Brook neighbourhood as used by the Runoff block in SWMM. A
24-hour AES hyetograph (Hogg, 1982) with a 2-year return period was used as
the precipitation input. This simulation incorporated the complete river system with
the pipe network of the Doggett's Brook sub-watershed added, and involved the use
of a feature in SWMM called Dynamic Grade Line (DGL) to enable viewing of
flooding/surcharging during the event. The extent of flooding was also determined
by examining plots of flooded nodes at different 'snapshots' in time during the
event. No flow data were available for this area and records of sewer sizes and invert
elevations were incomplete. The planimetric shape of the area as well as the drainage
area and ground slopes were determined from 1:1200 maps available from the office
of Land Management for Nova Scotia. These maps were used to decide on the
drainage divides of the subcatchments, and to calculate the areas using a planimeter.
The length of flow path(s) and the percent perviousness,/imperviousness of each
subcatchment were also determined. Typical values for Manning's z were used in the
Runoff block of the model.
ANALYSIS
Figure 4 describes the variation in the friction slope with time in the Salmon
River as compared to the bed slope during the flooding event. It was expected
that upstream reaches, in general the more likely to be kinematic, would have
the smallest s, - s" differences, compared to a downstream reach over time. For
more upstream reaches of the Salmon River (Figure 4, a and b), Figure 4 indicates
448
Vol.26, N0.4,2001
Revue canadienne des ressources hvdrioues
12. il t --.:
L/ '+'8rF(
3
u
=,
U
=
u
c
-
o
u
cn
o
o
o
u
F
o
EN
q
(anadian Water Resources Journal
Vol.26, N0.4,2001
449
13. 0.0050
r
0.00,1-5
0.0040
0.0035
0.0030
0.0025
0.0020 1
0.00 t5 '
0.0010 r
S" = 0.000714
0.0005.
0.0000
r0 20 30 ,t0
Time (hrs)
a) for sub-reach at upstream limit of study.
50
0.0050]
:
0.0040 l
0 0030
0.(D20
0.00 r0
So = 0.0008
L0 20 30 40
Tirnc (hrs)
b) for sub-reach midway along the study area.
0.0006
0 0005
0.000,1
0.0003
0.0002
0.0001
0.0000
'i
10 20 30 .+0 50
Time (hrs)
c) for sub-reach at downstream limit of study.
Figure 4. Variation in Friction Slope S,Over Time, as Compared to the Bed Slope S., for Three Sub-
Reaches ofthe Salmon River.
450
Vol.26, N0.4,2001
Revue canadienne des ressources hydriques
14. that, although the friction slope (sr) was different than the bed slope (so), it
was fairly constant throughout the temporal progression of representative flood
waves. Maximum or near-maximum water surface profiles would be reached neady
simultaneously in these reaches. In the most downstream reach, the behaviour of the
friction slope (sr) during the progression of the flood wave was erratic (Figure 4, c),
due to the strong interaction of the tidal effects in the estuary with the incoming
flood hydrograph. This implies that numerical simulations must be based on the
complete statement of the unsteadpflow equations (the St. Venant equations) in and
near the lower reaches. The collection of stage data in the field for use in calibrating
SWMM into a flood-warning tool should also focus on the lower half of this river
system. The more kinematic behaviour observed upstream implies that field-data
collection resources could be spread out more thinly without significantly affecting
the overall understanding ofthe behaviour ofsevere floods.
As can be seen from Figures 5 and 6, the reproduction of the previous One-D
results (EDM 1997) using Extran for both the T = 201ear and the T = 100-year
return period is quite good for both the Salmon River and the North River. Some
locations along the longitudinal profile of the Salmon River and the North River
appear to need particular attention. Figure 7 indicates the locations where the
profiles generated by Extran and One-D were quite different.
For the extent of the influence of tides on this river system, the SWMM
outcomes for two boundarpcondition scenarios are shown in Figure 8. These two
scenarios were prepared using the T = 2O1ear return period conditions (hydrologic
input and tide), showing that the associated maximum water surface profiles are
similar upstream of a point near the Walker St. Bridge. This point (Figure 7) is
located about 11,000 m from the start of the profile of the Salmon River.
The study of the relative importance of tide vs. flow results indicated that the
second combination (modest flow and high tide) had a higher maximum water-surface
profile. This suggests that tide plays a more prominent role than river flow in the lower
reaches of the river up to the upstream limit of noticeable tidal effects (Figure 9). The
effects of extreme tides dramatically decrease upstream of this point.
The flooding problem within the storm sewer system in the Doggett's Brook area
was also examined. The river contributed to the backing up of the storm sewer system
in the manner dictated by the conditions computed by Extran at the outfail. This
flooding problem was examined visually by using the DGL feature in SWMM to view
the progression of the flood wave through the stormwater system, and to determine
those locations of the junctions (manholes) where flooding occurs. This pilot storm
sewer-system modeiling effort showed that it is not large enough to handle the
volumes of water associated with significant events because street flooding occurred at
almost all of the junctions in this small neighbourhood. Figure 10 shows a snaPshot
of the progression of the surcharging of, and flooding in, the Doggett's Rrook storm
sewer system. A surcharged storm sewer is one in which the obverts are under water,
so that the pipe is under some pressure. A flooded storm sewer is defined as one which
has completely fi1led the manholes at either end and is causing water to go out onto the
street. None of this svstem was surcharsed after t = 24 hours.
Canadian Water Resources Journal
Vol.26, N0.4,2001
451
15. l
45.0
40.0
35.0
30.0
C zs.o
s 20.0
a
15.0
10.0
5.0
0.0
1
I
T
+
T
+
0.0
3s.0
30.0
25.0
E 20.0
il
q""
10.0
5.0
0.0
----*- wsp using ,Rtran'.
" "'-wspusing'1-D'.
-
locus olseclion inverls.
Salmon River
Rd. bridge
Walker St.
bridge
5000.0 10000.0 15000.0
Distance from node 2300 (m)
a) Salmon River.
Stewart
bridge
OnslowRd.
-_,--+
onoge
1000.0 2000.0 3000.0 4000.0 5000.0 6000.0 7000.0 8000.0 9000.0
Distance from node 300 (m)
b) North River.
Figute 5. Maximum Water Surface Profiles (WSP) Generated by Extran, as Compared to 0ne-D,
for T = 20-Year Return Period Conditions.
452
Vol.26, N0.4,2001
Revue canadienne des ressources hydriques
16. 45.0
40.0
35.0
30.0
g 25.O
il
s 20.0
q
15.0
10.0
5.0
0.0
T
T
0.0
Salmon Rivel
Rd. bridge
Walker St
bridge
10000.0 15000.0
Distance from node 2300 (m)
a) Salmon River.
35.00
30.00
25.00
E 20.00
a
A
I
I
T:,:ll
10.00
5.00
Onslow Rd
bridge
0.0
f
-
1ooo.o 2ooo.0 3000.0 4000.0 5000.0 6000.0 7000.0 8000.0 9000.0
Distance from node 300 (m)
b) North River.
----X-- *rp using 'Ertran'.
------wspusing'1-D'.
-
locus of section inverts.
Figure 6. Maximum Water Surface Profiles (WSP) Generated by Extran, as Compared to 0ne-D,
for T = 1 00-Year Return Period (onditions.
Canadian Water Resources Journal
Vol.26, N0.4,2001
453
20. a) At t = 36 hrs.
a nood.dnod.
O |'doodcd node
5105 node nrlmb.r
frfragr dud.
b) From t = 48 hrs onward.
Figure 10. Snapshots of the Progression of tlooding in the Doggett's Brook Storm Sewer Netwotk
(l-atter Half of Event).
Canadian Water Resources Journal
Vol.26, N0.4,2001
457
21. SUMMARY AND (ONCLUSIONS
1. Friction slope plots and water surface profiles indicate that the Salmon
River probably makes the transition from nearly kinematic behaviour to
fully-dynamic behaviour over a fairly short longitudinal distance. The
portion of the Salmon-North River system considered was simulated
using a model based on the complete statement of the gradually-varied
unsteady flow equations (the St. Venant equations). Results indicate that
efforts to document events that could be used to calibrate the model
should focus on reaches downstream of the Walker St. Bridge. Conditions
become dramatically more unsteady downstream of this location.
2. SWMM was used successfullv to reoroduce the maximum water surface
profiles previously prepared .,ri,-rg ih. One-D model of Environment
Canada to an adequate degree ofaccuracy.
Tidal effects from the Salmon River estuary play a more important role
than flow in the determination of the maximum water surface orofile
elevations, especially downstream of a point 11,000 m from the beginning
ofthe profile.
The Doggett's Brook storm sewer system is completely incapable of
handling significant flood events (T = 201ear or T = 100-year hydrologic
and tidal events). This situation is probably indicative of the capacity of
most of Truro's storm sewer system.
The Nova Scotia Minister responsible for the Emergency Measures Organization
recently gave the Town of Truro a mark of 'F' for its level of flood preparedness
(Chronicle-Herald,1999).It is believed that, if properly calibrated against observed
events, SWMM would be a very suitable model on which to base a flood warning
system, one that could improve significantly turo's present level of flood readiness.
ACKNOWLEDGEMENTS
The financial assistance of the National Research Council of Canada is
acknowledged. The cooperation of Mr. Peter Nelson, MCIR Director of Planning
and Deveiopment, and Mr. Andrew MacKinnon, Assistant Town Engineer for
the municipality of Truro is gratefully acknowledged. The SWMM user's group
at SWMM-USERS@LISTStrRV.UOGUtrLPH.CA oroved to be a valuable
resource.
458
Vol.26, N0.4,2001
3.
4.
Revue canadienne des ressources hvdrioues
22. REFERENCES
Bedient, P.B. and W.C. Huber. 1992. Hydrology and FloodplainAnalysis,2nd edition.
Addison Wesley, Reading, MA.
Hogg, W.D. 7982. "Drstribution of Rainfall with Time: Design Considerations'"
Chapman Conference on Rainfall Rates, American Geophysical Union' Urbana
Illinois, Aprrl 2729. (Reference for what is sometimes referred to as the 24-hour
AES hyetograph'.)
chronicle-HenId. 1999. "turo Gets F on EMO Report card." saturday,
January 30 (S. March reporting).
Cox, O.S. 1938. Tiuro Flood Control Progrant Public Works Canada.
trDM. 1997. Tiuro Flaocl Plain. Prepared by EDM and Maclaren Plansearch
and Wallace Macdonald and Lively Ltd. for the Joint Committee on Floodplain
Management for Truro District.
Environment Canada. 1995. Inland Waters Directorate and B.C. Environment
Water Management Division 1995. The ONE-D Hydrodynamic Pragram, User's
Manual, March.
Gunaratnam, DJ. and F.E. Perkins. 1970. "Numerical Solution of Unsteady Flows
in Open Channels." Hydrodynamics Lab. Report No. 127, Department of Civil
Engineering, MIT, July.
Huber, W.C. and R.E. Dickinson. 1988. Storm Water Management Model, Wrsion 4:
(Jser's Manual. U.S. Environmental Protection Agency, Athens' GA.
Maclaren Plansearch. 1988. Hydrotechnical Study of Tiura and Area Flood Plain.
Preoared for the Province of Nova Scotia and Environment Canada under the
Federal Flood Damage Reduction Program (FDRP).
Nelson, P. 1998. Personal Communication.
Ponce, V.M. 1989. Engineering Hydrology: Principles and Practices. Prentice Hall,
Englewood Cliffs, NJ.
(anadian Water Resources Journal
Vol.26, N0.4,2001
459