Download as PDF, PPTX

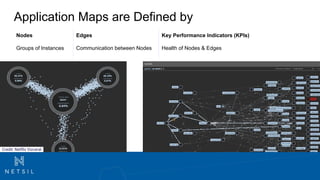
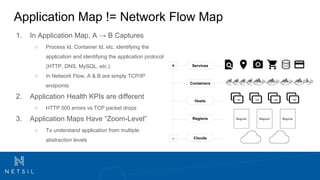
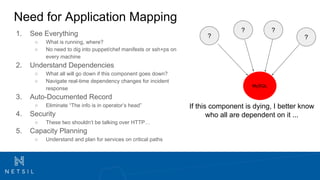
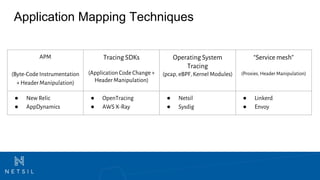

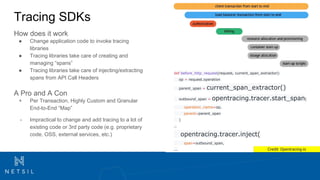
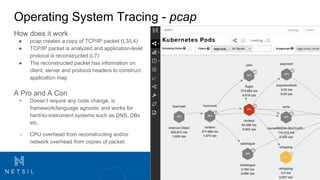
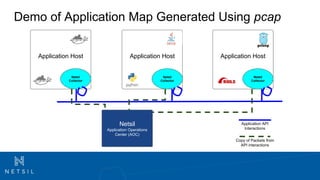

The document explains application maps, which define the relationships and health of application components, contrasting them with network flow maps. It discusses the need for application mapping to understand dependencies, document processes, enhance security, and aid in capacity planning, along with various techniques for generating these maps. Techniques mentioned include APM, tracing SDKs, operating system tracing, and service meshes, each with their own pros and cons regarding implementation and context preservation.