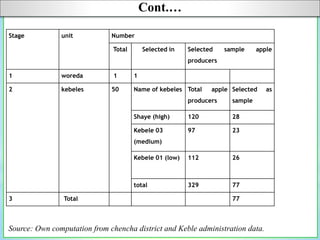
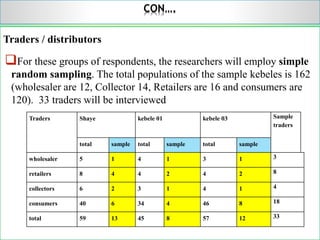
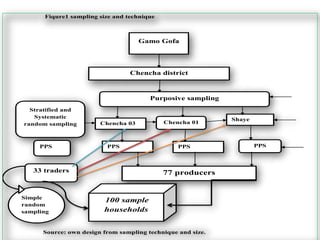
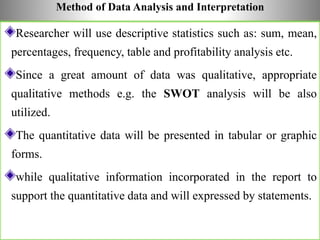
DEPARTMENT OF AGRIBUSINESS AND VALUE CHAIN MANAGEMENT
VALUE CHAIN ANALYSIS OF APPLE FRUIT IN CASE OF CHENCHA WOREDA,
GAMOGOFA ZONE,SNNPRS, ETHIOPIA.
FOR THE FULFILLMENT OF THE DEGREE OF BACHELOR IN AGRIBUSINESS
AND VALUE CHAIN MANAGEMENT
BY : GEDISHA KATOLA
ADIVISOR: ABEBAW ZENEBE
MARCH, 30, 2017
ARBAMINCH, ETHIOPIA
1 Introduction
1.1 Background 0f the study
The apple is the pomaceous fruit of the apple tree, species
Malus domestica in the rose family(Seifu Fetena, etal.,2014)
Apples are the most important world fruit crop after oranges,
bananas and grapes. China, Italy, USA, Chile and France are the
leading apple-producing and exporting countries. (Waqar et al.,
2009).
Apple is among important crops used for food security and
income generation in other African countries, but they were
not well recognized fruits in Ethiopia. (Seifu Fetena,
etal.,2014)
Cont.…..
In Ethiopia, apple was first brought to Chencha by Missionaries
about 63 years ago and established in the garden of Chencha
Kale-Hiwot Church. (Seifu Fetena, etal.,2014))
Despite the ample literature about apple tree in the world, it
seems hard to get research findings on apple tree in Ethiopia
which may make the study difficult.
This proposal paper, therefore, will aims and intends to analyze
the current apple value chain, major constraints and
opportunities and its market performance in the study area.
which helps to find the weakest link of the chain and to narrow
the information gap on the subject.
1.2 statement of the problem
Apple is perishable product and it is bulky and of relatively
small individual value, and requires rapid, cost-efficient
transportation to buyers and consumers. (IPMS.,2011)
Its quality also deteriorates very rapidly and the ability to
consistently provide high-quality products depends on the
commitment of all players in the supply chain. (IPMS.,2011)
Chencha Woreda the place where the study will be conducted
is highly known by its potential in producing apple fruits for
home consumption and market.
Cont.…
Furthermore, the current study of (Gebrerufael , etal,.2014)
showed that apples ;
Income was unevenly distributed across the district .
The Produce have low proportion to access market.
Are not significantly benefiting farmers.
However, This research did not provide information on the
value chain actors, their gap and their contribution to the
apple production rather than studying simple marketing.
It also fails in identifying the deep marketing channel with
their actors and their operation toward the apple production.
Cont.…
Similarly, the researches so far done have dealt on apple focuses on
production than marketing and equally they have not dealt on their
market performance. Its value chain and their characteristics have
not yet been studied and analyzed.
And there are still problems that influence the marketing potential
and performance of apple in the woreda.
Questions arises that, do apples have any market potential? What is
their market performance? Etc.
Thus, the contribution and the challenges that the sub-sector faces
needs to be investigated.
Statement of the problem Cont.…..
These inspire the researcher to conduct value chain analysis on the
study area and believe that value chain analysis is essential, which
will narrow the information gap on the subject and will contribute to
better understand on improved strategies for reorienting marketing
system for the benefit of small farmer’s development and traders.
Because, VCA is a powerful diagnostic tool that can identify critical
issues and blockages for specific target groups – and provides a
framework for interventions to change the circumstances of the poor
resource; . (Jonathan Mitchell, etal.,2009)
1.3 Research Questions
Under the study, the following research questions
will have been addressed in the study area.
What are the apple value chain actors and who is
more benefiting from apple value chain?
What are the existing market channels on apple
fruit value chain?
What are major constraints and opportunities in the
value chain activities of apple production?
1.4 objective
1.4.1 General objective
To analyze the value chain of apple fruit in the study area.
1.4.2 Specific objective
To identify apple value chain actors and examine the
performance of actors in the chain;
To describe important marketing channels and actors
involved on apple fruit value chain.
To identify major constraints and opportunities some actors
along Apple fruit value chain in study area.
1.5 Significance of the study
The main significance of the study will be for all actors in
the value chain system to make improvement on their day
to day activities and their operation by having of the
forwarded supportive points of the researcher.
The study will also help the researcher to gain insight on
how to conduct research and it helps other researcher as
source material for further study.
2. methodology
2.1 Description of the Study Area
Location:
 Chencha woreda is located in the Gamo Gofa administrative
zone of the Southern Nations, Nationalities and Peoples’
Regional State (SNNPR) of Ethiopia.
Topography and climate condition:
 The altitudes of the district range from 1600-3200 masl. It has
two agro-ecological zones: ‘dega’ (2300-3200 masl, 82%) and
‘woinadega’ (1500-2300 masl, 18%); with total area coverage
of 37,650 ha. (CSA, 2007)
con…
Population:
The population of the district is 125,628 (Female: 66,363
and Male 59,263) and 21,655 households, of which 2461
households are female headed. ( Woreda Agriculture and
Rural Development office)
Major crops grown:
Main cash and food crops grown in the area includes
field croups, Legumes and tubers and fruit trees
2.2 Type of Data
Researcher will use both quantitative and qualitative types
of data.
Quantitative Data: are regarding the market performance
and value distribution of the value chain.
Qualitative Data: related to the value chain activities, the
role and integration of actors, and the challenges and
opportunities of apple marketing.
2. Sources and data collection method
both primary and secondary sources of data will be used.
The primary data will be collected by using questionnaire, visiting
sites and interview with key informants
Due to lack of previous studies and knowledge about activities within
the value chain of apple in Chencha preliminary data gathering is
necessary.
It is considered necessary to start the research by on-site visits to
farmers, wholesale markets and retail markets.
The secondary data will be from published and unpublished reports of
different level of agricultural bureau, report of CSA, etc.
3.5 Sampling techniques
Probability and non-probability sampling techniques will be
employed to delineate the study population and draw household
respondents.
Apple was first introduced to Chencha and it is cultivated almost in
all the 50 Keble administrations of the district (Seifu Fetena, etal.
(2014)). and the district is purposively selected by production
potential.
The population of the district is homogeneous in, socio-economic
condition and share common culture but, they are different in agro-
ecology and production potential from Keble to Keble.
Thus according to production potential the 50 kebeles are
divided into three subgroups,(high, medium and low
production) called strata each with many elements in it.
Homogeneity is secure within subgroups and
heterogeneity is between subgroups. From 50 kebeles 17
kebeles are the most apple producing 20 are the medium
and 13 are lower.
simple random sampling technique will be used to select
sample kebele administrations from each strata.
con…
cont.…..
Using the household list of the sampled strata kebelles
using Yamane (1967), 77 sample farmers will be selected
randomly based on proportional to the population size of
the selected kebelles.
Sample size determination
Yamane (1967), simplified formula to calculate the sample
size with the desired confidence level of 90% is used.
𝑛 =
𝑁
1+𝑁( 𝑒2)
= 𝑛 =
329
1+329(0.12)
= 77
con…
The sample kebeles have different household size. Thus it
will be based on population proportionate to size to select
sample from each kebeles.
nt =
𝑛𝑖∗𝑛 .
𝑁
𝑛 = 𝑠𝑎𝑚𝑝𝑙𝑒 𝑠𝑖𝑧𝑒, 𝑛𝑖 =
𝑡𝑜𝑡𝑎𝑙 𝑎𝑝𝑝𝑙𝑒 𝑝𝑟𝑜𝑑𝑢𝑐𝑒𝑟𝑠 𝑜𝑓 𝑡ℎ𝑒 𝑘𝑒𝑏𝑒𝑙𝑒, 𝑛𝑡 = 𝑠𝑖𝑧𝑒 𝑜𝑓 𝑠𝑎𝑚𝑝𝑙𝑒from each
kebele pps
Which will be
120∗77
329
=28 is from shaye and similarly in such
manner 23 and 26 from 03 and 01 kebeles respectively.
Sampling techniques cont.…..
Source: Own computation from chencha district and Keble administration data.
Stage unit Number
Total Selected in Selected sample apple
producers
1 woreda 1 1
2 kebeles 50 Name of kebeles Total apple
producers
Selected as
sample
Shaye (high) 120 28
Kebele 03
(medium)
97 23
Kebele 01 (low) 112 26
total 329 77
3 Total 77
Cont.…
CON….
Traders / distributors
For these groups of respondents, the researchers will employ simple
random sampling. The total populations of the sample kebeles is 162
(wholesaler are 12, Collector 14, Retailers are 16 and consumers are
120). 33 traders will be interviewed
Traders Shaye kebele 01 kebele 03 Sample
traders
total sample total sample total sample
wholesaler 5 1 4 1 3 1 3
retailers 8 4 4 2 4 2 8
collectors 6 2 3 1 4 1 4
consumers 40 6 34 4 46 8 18
total 59 13 45 8 57 12 33
Fiqure1 sampling size and technique
Source: own design from sampling technique and size.
Chencha district
Chencha 03
Shaye
PPSPPS
77 producers
Gamo Gofa
Stratified and
Systematic
random sampling Chencha 01
PPS
Purposive sampling
PPS
33 traders
100 sample
households
Simple
random
sampling
Method of Data Analysis and Interpretation
Researcher will use descriptive statistics such as: sum, mean,
percentages, frequency, table and profitability analysis etc.
Since a great amount of data was qualitative, appropriate
qualitative methods e.g. the SWOT analysis will be also
utilized.
The quantitative data will be presented in tabular or graphic
forms.
while qualitative information incorporated in the report to
support the quantitative data and will expressed by statements.
Con..
market performance can be evaluated by analyzing the costs
and margins of marketing agents in different channels.
marketing margin or price spread will used for the measure
of system performance .
Margin or spread can be a useful descriptive statistics if it
used to show how the consumer’s food price is divided
among participants at different levels of marketing system
(Getachew, 2002).
4.1 TIME TABLE
To accomplish the research the researcher will use the following time table plan. The
researcher will use the time table plan to know each month do any activity perfectly.
Table 1; duration of time table plan
NO ACTIVITIES
Y
2
E
0
A
0
R
9 E C
M O N T H
DECEBER JANURY FEBRURY MARCH APPRIL MAY JUN
1 Title selection X
2 Gather source for titles X
3 Proposal preparation X
3 Proposal presentation X
4 Data collection X
5 Data analysis X
6 Research writing X X
7 Research submission X
8 Research presentation X
apple value chain analysis by gedish

apple value chain analysis by gedish

  • 1.
    DEPARTMENT OF AGRIBUSINESSAND VALUE CHAIN MANAGEMENT VALUE CHAIN ANALYSIS OF APPLE FRUIT IN CASE OF CHENCHA WOREDA, GAMOGOFA ZONE,SNNPRS, ETHIOPIA. FOR THE FULFILLMENT OF THE DEGREE OF BACHELOR IN AGRIBUSINESS AND VALUE CHAIN MANAGEMENT BY : GEDISHA KATOLA ADIVISOR: ABEBAW ZENEBE MARCH, 30, 2017 ARBAMINCH, ETHIOPIA
  • 2.
    1 Introduction 1.1 Background0f the study The apple is the pomaceous fruit of the apple tree, species Malus domestica in the rose family(Seifu Fetena, etal.,2014) Apples are the most important world fruit crop after oranges, bananas and grapes. China, Italy, USA, Chile and France are the leading apple-producing and exporting countries. (Waqar et al., 2009). Apple is among important crops used for food security and income generation in other African countries, but they were not well recognized fruits in Ethiopia. (Seifu Fetena, etal.,2014)
  • 3.
    Cont.….. In Ethiopia, applewas first brought to Chencha by Missionaries about 63 years ago and established in the garden of Chencha Kale-Hiwot Church. (Seifu Fetena, etal.,2014)) Despite the ample literature about apple tree in the world, it seems hard to get research findings on apple tree in Ethiopia which may make the study difficult. This proposal paper, therefore, will aims and intends to analyze the current apple value chain, major constraints and opportunities and its market performance in the study area. which helps to find the weakest link of the chain and to narrow the information gap on the subject.
  • 4.
    1.2 statement ofthe problem Apple is perishable product and it is bulky and of relatively small individual value, and requires rapid, cost-efficient transportation to buyers and consumers. (IPMS.,2011) Its quality also deteriorates very rapidly and the ability to consistently provide high-quality products depends on the commitment of all players in the supply chain. (IPMS.,2011) Chencha Woreda the place where the study will be conducted is highly known by its potential in producing apple fruits for home consumption and market.
  • 5.
    Cont.… Furthermore, the currentstudy of (Gebrerufael , etal,.2014) showed that apples ; Income was unevenly distributed across the district . The Produce have low proportion to access market. Are not significantly benefiting farmers. However, This research did not provide information on the value chain actors, their gap and their contribution to the apple production rather than studying simple marketing. It also fails in identifying the deep marketing channel with their actors and their operation toward the apple production.
  • 6.
    Cont.… Similarly, the researchesso far done have dealt on apple focuses on production than marketing and equally they have not dealt on their market performance. Its value chain and their characteristics have not yet been studied and analyzed. And there are still problems that influence the marketing potential and performance of apple in the woreda. Questions arises that, do apples have any market potential? What is their market performance? Etc. Thus, the contribution and the challenges that the sub-sector faces needs to be investigated.
  • 7.
    Statement of theproblem Cont.….. These inspire the researcher to conduct value chain analysis on the study area and believe that value chain analysis is essential, which will narrow the information gap on the subject and will contribute to better understand on improved strategies for reorienting marketing system for the benefit of small farmer’s development and traders. Because, VCA is a powerful diagnostic tool that can identify critical issues and blockages for specific target groups – and provides a framework for interventions to change the circumstances of the poor resource; . (Jonathan Mitchell, etal.,2009)
  • 8.
    1.3 Research Questions Underthe study, the following research questions will have been addressed in the study area. What are the apple value chain actors and who is more benefiting from apple value chain? What are the existing market channels on apple fruit value chain? What are major constraints and opportunities in the value chain activities of apple production?
  • 9.
    1.4 objective 1.4.1 Generalobjective To analyze the value chain of apple fruit in the study area. 1.4.2 Specific objective To identify apple value chain actors and examine the performance of actors in the chain; To describe important marketing channels and actors involved on apple fruit value chain. To identify major constraints and opportunities some actors along Apple fruit value chain in study area.
  • 10.
    1.5 Significance ofthe study The main significance of the study will be for all actors in the value chain system to make improvement on their day to day activities and their operation by having of the forwarded supportive points of the researcher. The study will also help the researcher to gain insight on how to conduct research and it helps other researcher as source material for further study.
  • 11.
    2. methodology 2.1 Descriptionof the Study Area Location:  Chencha woreda is located in the Gamo Gofa administrative zone of the Southern Nations, Nationalities and Peoples’ Regional State (SNNPR) of Ethiopia. Topography and climate condition:  The altitudes of the district range from 1600-3200 masl. It has two agro-ecological zones: ‘dega’ (2300-3200 masl, 82%) and ‘woinadega’ (1500-2300 masl, 18%); with total area coverage of 37,650 ha. (CSA, 2007)
  • 12.
    con… Population: The population ofthe district is 125,628 (Female: 66,363 and Male 59,263) and 21,655 households, of which 2461 households are female headed. ( Woreda Agriculture and Rural Development office) Major crops grown: Main cash and food crops grown in the area includes field croups, Legumes and tubers and fruit trees
  • 13.
    2.2 Type ofData Researcher will use both quantitative and qualitative types of data. Quantitative Data: are regarding the market performance and value distribution of the value chain. Qualitative Data: related to the value chain activities, the role and integration of actors, and the challenges and opportunities of apple marketing.
  • 14.
    2. Sources anddata collection method both primary and secondary sources of data will be used. The primary data will be collected by using questionnaire, visiting sites and interview with key informants Due to lack of previous studies and knowledge about activities within the value chain of apple in Chencha preliminary data gathering is necessary. It is considered necessary to start the research by on-site visits to farmers, wholesale markets and retail markets. The secondary data will be from published and unpublished reports of different level of agricultural bureau, report of CSA, etc.
  • 15.
    3.5 Sampling techniques Probabilityand non-probability sampling techniques will be employed to delineate the study population and draw household respondents. Apple was first introduced to Chencha and it is cultivated almost in all the 50 Keble administrations of the district (Seifu Fetena, etal. (2014)). and the district is purposively selected by production potential. The population of the district is homogeneous in, socio-economic condition and share common culture but, they are different in agro- ecology and production potential from Keble to Keble.
  • 16.
    Thus according toproduction potential the 50 kebeles are divided into three subgroups,(high, medium and low production) called strata each with many elements in it. Homogeneity is secure within subgroups and heterogeneity is between subgroups. From 50 kebeles 17 kebeles are the most apple producing 20 are the medium and 13 are lower. simple random sampling technique will be used to select sample kebele administrations from each strata. con…
  • 17.
    cont.….. Using the householdlist of the sampled strata kebelles using Yamane (1967), 77 sample farmers will be selected randomly based on proportional to the population size of the selected kebelles. Sample size determination Yamane (1967), simplified formula to calculate the sample size with the desired confidence level of 90% is used. 𝑛 = 𝑁 1+𝑁( 𝑒2) = 𝑛 = 329 1+329(0.12) = 77
  • 18.
    con… The sample kebeleshave different household size. Thus it will be based on population proportionate to size to select sample from each kebeles. nt = 𝑛𝑖∗𝑛 . 𝑁 𝑛 = 𝑠𝑎𝑚𝑝𝑙𝑒 𝑠𝑖𝑧𝑒, 𝑛𝑖 = 𝑡𝑜𝑡𝑎𝑙 𝑎𝑝𝑝𝑙𝑒 𝑝𝑟𝑜𝑑𝑢𝑐𝑒𝑟𝑠 𝑜𝑓 𝑡ℎ𝑒 𝑘𝑒𝑏𝑒𝑙𝑒, 𝑛𝑡 = 𝑠𝑖𝑧𝑒 𝑜𝑓 𝑠𝑎𝑚𝑝𝑙𝑒from each kebele pps Which will be 120∗77 329 =28 is from shaye and similarly in such manner 23 and 26 from 03 and 01 kebeles respectively.
  • 19.
    Sampling techniques cont.….. Source:Own computation from chencha district and Keble administration data. Stage unit Number Total Selected in Selected sample apple producers 1 woreda 1 1 2 kebeles 50 Name of kebeles Total apple producers Selected as sample Shaye (high) 120 28 Kebele 03 (medium) 97 23 Kebele 01 (low) 112 26 total 329 77 3 Total 77 Cont.…
  • 20.
    CON…. Traders / distributors Forthese groups of respondents, the researchers will employ simple random sampling. The total populations of the sample kebeles is 162 (wholesaler are 12, Collector 14, Retailers are 16 and consumers are 120). 33 traders will be interviewed Traders Shaye kebele 01 kebele 03 Sample traders total sample total sample total sample wholesaler 5 1 4 1 3 1 3 retailers 8 4 4 2 4 2 8 collectors 6 2 3 1 4 1 4 consumers 40 6 34 4 46 8 18 total 59 13 45 8 57 12 33
  • 21.
    Fiqure1 sampling sizeand technique Source: own design from sampling technique and size. Chencha district Chencha 03 Shaye PPSPPS 77 producers Gamo Gofa Stratified and Systematic random sampling Chencha 01 PPS Purposive sampling PPS 33 traders 100 sample households Simple random sampling
  • 22.
    Method of DataAnalysis and Interpretation Researcher will use descriptive statistics such as: sum, mean, percentages, frequency, table and profitability analysis etc. Since a great amount of data was qualitative, appropriate qualitative methods e.g. the SWOT analysis will be also utilized. The quantitative data will be presented in tabular or graphic forms. while qualitative information incorporated in the report to support the quantitative data and will expressed by statements.
  • 23.
    Con.. market performance canbe evaluated by analyzing the costs and margins of marketing agents in different channels. marketing margin or price spread will used for the measure of system performance . Margin or spread can be a useful descriptive statistics if it used to show how the consumer’s food price is divided among participants at different levels of marketing system (Getachew, 2002).
  • 24.
    4.1 TIME TABLE Toaccomplish the research the researcher will use the following time table plan. The researcher will use the time table plan to know each month do any activity perfectly. Table 1; duration of time table plan NO ACTIVITIES Y 2 E 0 A 0 R 9 E C M O N T H DECEBER JANURY FEBRURY MARCH APPRIL MAY JUN 1 Title selection X 2 Gather source for titles X 3 Proposal preparation X 3 Proposal presentation X 4 Data collection X 5 Data analysis X 6 Research writing X X 7 Research submission X 8 Research presentation X