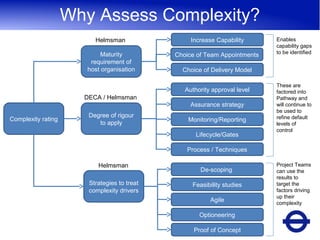
Delivery & Commercial Capability
Programme
Understanding Complexity

1
The Killer Question...
• Are "complex projects" real or are they simply a result
of poorly defined scope. How can one distinguish
between a genuinely complex project and one that has
not had its scope and context sufficiently developed?

2
Complexity & Capability
Projects this side of the cliff
need a greater maturity than
current organisation al
capability

Complexity v
Performance
for Company X
Project portfolio

Projects this side of the cliff are
within the host organisation’s
inherent capability

Helmsman performance cliff model
A project’s performance/complexity rating

Increasing maturity level raises the complexity cliff
Note: Diagram is illustrative. Not TfL data.

Complexity
Cliff
Why Assess Complexity?
Helmsman

Increase Capability

Maturity
requirement of
host organisation

Choice of Team Appointments
Choice of Delivery Model
Authority approval level

DECA / Helmsman
Assurance strategy
Complexity rating

Degree of rigour
to apply

Enables
capability gaps
to be identified

Monitoring/Reporting
Lifecycle/Gates

These are
factored into
Pathway and
will continue to
be used to
refine default
levels of
control

Process / Techniques
Helmsman
Strategies to treat
complexity drivers

De-scoping
Feasibility studies
Agile
Optioneering
Proof of Concept

Project Teams
can use the
results to
target the
factors driving
up their
complexity
Helmsman Model (comprehensive)
The Helmsman model measures
both hard and soft factors
Results for Project ‘X’
Comparing similar projects
8.0
7.0
6.0
5.0
4.0
3.0
2.0
1.0
0.0
C ontex t

S oc ial

A mbig uity

Tec hnic al

P rojec t
Manag ement

C omplex ity
R ating

B aker S treet S tation Improvement

5.3

5.0

5.0

3.1

5.4

4.8

B ond S treet S tation Upg rade

6.7

5.0

6.6

6.2

7.0

6.3

C hanc ery L ane S tation Improvement

4.7

5.3

5.0

3.1

5.3

4.7

G reen P ark S F A

5.3

4.5

4.7

3.6

6.1

4.8

Marble A rc h

5.3

6.0

5.1

4.2

6.3

5.4

Notting Hill G ate

5.3

4.0

4.6

3.9

5.4

4.6

Tottenham C ourt R oad S tation Improvements

7.0

5.6

4.9

7.3

7.6

6.5

V ic toria S tation Upg rade P rojec t

7.3

5.5

5.3

5.5

7.0

6.1
Top 5 Sub-Factors
10.0

The D&CC governance
workstream has been
helping with this issue,
but there’s still more to
do: e.g. Only submitting
investment papers to
the final decision-maker

9.0
8.0

conflict

7.0
6.0
5.0
4.0
3.0
2.0
1.0
0.0
Multi-dis c iplinary
A verag e R ating

Timeframes

S truc ture

L evel of
A c c ountability

S takeholder
Numbers

8.1

7.4

7.2

7.1

6.9

• TfL typically has a large number of core disciplines involved in projects.
• Timeframes are typically quite long, meaning it is likely that scope will be
ambiguous and/or subject to change and continuity of stakeholders and
project personnel is unlikely.
• Project Managers typically are accountable for delivering new capabilities
(not just tangible outputs), However, there are typically 4-5 decision-making
layers above the Project Manager
• There are generally a lot of stakeholders interested in TfL projects
8
Complexity & Cost
10

Generally, the bigger the project by cost, the
more complex it is.

9

But lower value projects have a wider spread of
complexity. The ranges shown here cover a 90%
confidence interval..

8

It could be more critical to understand complexity
drivers for projects <£100m than in other cost
bands.

7
6
5
4
3
2
1
£1-25m

£25£50m

£50m£100m

£100m£300m

£300m£1bn

£1bn+
Variability
Most variable

Least variable

To be addressed
by projects teams

To be addressed
corporately

8.00
7.00
6.00
5.00
4.00
3.00
2.00
1.00
0.00

TfL P ortfolio A verag e

S TD E V

• The least variable complexity drivers should be addressed
corporately – e.g. factored into TfL pathway, tools/systems,
competency development etc
• The most variable complexity drivers should be addressed
locally, and factored into team selection, assurance etc.
What we are doing next...
Context

ource: Ackoff / Senge & Roth

Approach
The Killer Question...
• Are "complex projects" real or are they simply a result
of poorly defined scope. How can one distinguish
between a genuinely complex project and one that has
not had its scope and context sufficiently developed?
• My experience...
– Even for well defined projects
– Some complexity drivers are inherent
– Some can be tamed
– Others cannot

– Some complexity drivers are self-inflicted
– For poorly defined projects
– Most complexity drivers are self-inflicted

12

Delivery & Commercial Capability Programme - Understanding complexity - Andy Murray

  • 1.
    Delivery & CommercialCapability Programme Understanding Complexity 1
  • 2.
    The Killer Question... •Are "complex projects" real or are they simply a result of poorly defined scope. How can one distinguish between a genuinely complex project and one that has not had its scope and context sufficiently developed? 2
  • 3.
    Complexity & Capability Projectsthis side of the cliff need a greater maturity than current organisation al capability Complexity v Performance for Company X Project portfolio Projects this side of the cliff are within the host organisation’s inherent capability Helmsman performance cliff model A project’s performance/complexity rating Increasing maturity level raises the complexity cliff Note: Diagram is illustrative. Not TfL data. Complexity Cliff
  • 4.
    Why Assess Complexity? Helmsman IncreaseCapability Maturity requirement of host organisation Choice of Team Appointments Choice of Delivery Model Authority approval level DECA / Helmsman Assurance strategy Complexity rating Degree of rigour to apply Enables capability gaps to be identified Monitoring/Reporting Lifecycle/Gates These are factored into Pathway and will continue to be used to refine default levels of control Process / Techniques Helmsman Strategies to treat complexity drivers De-scoping Feasibility studies Agile Optioneering Proof of Concept Project Teams can use the results to target the factors driving up their complexity
  • 5.
    Helmsman Model (comprehensive) TheHelmsman model measures both hard and soft factors
  • 6.
  • 7.
    Comparing similar projects 8.0 7.0 6.0 5.0 4.0 3.0 2.0 1.0 0.0 Contex t S oc ial A mbig uity Tec hnic al P rojec t Manag ement C omplex ity R ating B aker S treet S tation Improvement 5.3 5.0 5.0 3.1 5.4 4.8 B ond S treet S tation Upg rade 6.7 5.0 6.6 6.2 7.0 6.3 C hanc ery L ane S tation Improvement 4.7 5.3 5.0 3.1 5.3 4.7 G reen P ark S F A 5.3 4.5 4.7 3.6 6.1 4.8 Marble A rc h 5.3 6.0 5.1 4.2 6.3 5.4 Notting Hill G ate 5.3 4.0 4.6 3.9 5.4 4.6 Tottenham C ourt R oad S tation Improvements 7.0 5.6 4.9 7.3 7.6 6.5 V ic toria S tation Upg rade P rojec t 7.3 5.5 5.3 5.5 7.0 6.1
  • 8.
    Top 5 Sub-Factors 10.0 TheD&CC governance workstream has been helping with this issue, but there’s still more to do: e.g. Only submitting investment papers to the final decision-maker 9.0 8.0 conflict 7.0 6.0 5.0 4.0 3.0 2.0 1.0 0.0 Multi-dis c iplinary A verag e R ating Timeframes S truc ture L evel of A c c ountability S takeholder Numbers 8.1 7.4 7.2 7.1 6.9 • TfL typically has a large number of core disciplines involved in projects. • Timeframes are typically quite long, meaning it is likely that scope will be ambiguous and/or subject to change and continuity of stakeholders and project personnel is unlikely. • Project Managers typically are accountable for delivering new capabilities (not just tangible outputs), However, there are typically 4-5 decision-making layers above the Project Manager • There are generally a lot of stakeholders interested in TfL projects 8
  • 9.
    Complexity & Cost 10 Generally,the bigger the project by cost, the more complex it is. 9 But lower value projects have a wider spread of complexity. The ranges shown here cover a 90% confidence interval.. 8 It could be more critical to understand complexity drivers for projects <£100m than in other cost bands. 7 6 5 4 3 2 1 £1-25m £25£50m £50m£100m £100m£300m £300m£1bn £1bn+
  • 10.
    Variability Most variable Least variable Tobe addressed by projects teams To be addressed corporately 8.00 7.00 6.00 5.00 4.00 3.00 2.00 1.00 0.00 TfL P ortfolio A verag e S TD E V • The least variable complexity drivers should be addressed corporately – e.g. factored into TfL pathway, tools/systems, competency development etc • The most variable complexity drivers should be addressed locally, and factored into team selection, assurance etc.
  • 11.
    What we aredoing next... Context ource: Ackoff / Senge & Roth Approach
  • 12.
    The Killer Question... •Are "complex projects" real or are they simply a result of poorly defined scope. How can one distinguish between a genuinely complex project and one that has not had its scope and context sufficiently developed? • My experience... – Even for well defined projects – Some complexity drivers are inherent – Some can be tamed – Others cannot – Some complexity drivers are self-inflicted – For poorly defined projects – Most complexity drivers are self-inflicted 12