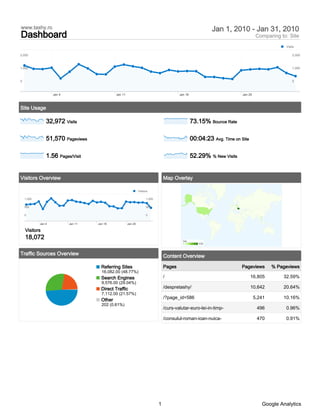
This document summarizes website analytics for www.tashy.ro from January 1-31, 2010. It received 32,972 visits from 101 countries. The homepage received the most pageviews at 16,805. Referring sites accounted for 48.77% of traffic and search engines accounted for 29.04% of traffic. The site had a 73.15% bounce rate and average time on site was 4 minutes and 23 seconds. Romania contributed the most visits at 14,020.
The document summarizes website analytics data for affluentmagazine.com from October 17, 2010 to November 16, 2010 and compares it to the previous period. There was an increase in visits, unique visitors, pageviews, and traffic from search engines. However, bounce rate and percentage of new visits increased while average time on site and pages per visit decreased.
The document provides analytics data for the website www.tashy.ro from December 1-31, 2009. Some key details:
- There were 87,204 visits and 61,196 unique visitors to the site.
- The top traffic source was Google organic search (69.97% of visits).
- The top page was /partiale-exit-poll-uri-alegeri-prezidentiale-2009-%E2%80%93- which received 22.98% of pageviews.
- The site had a 70.53% bounce rate and visitors spent an average of 3 minutes and 4 seconds on site.
This document summarizes web analytics data for the website www.tashy.ro from October 23, 2009 to November 22, 2009. Some key findings include:
- There were 4,172 total visits during this period, with most visits occurring from October 23-24 and fewer visits in subsequent periods.
- Visitors viewed a total of 8,150 pages with an average of 1.95 pages per visit and an average time on site of 3 minutes and 15 seconds. The bounce rate was 64.84% and 87.9% of visits were from new visitors.
- Traffic sources were mostly from search engines (89.14%), primarily Google organic searches. Direct traffic and referring sites accounted for the remainder.
The website www.runmx.com received 82,559 visits from May 16 to June 15, 2011. The majority of traffic, 76.26%, came from search engines like Google and Bing. Mexico accounted for the largest number of visits at 63,880. Users from Mexico averaged 6.92 pages per visit and spent 3 minutes and 41 seconds on the site. The overall bounce rate was 23.7% and 60.91% of visits were from new users.
The document discusses implications of Web 3.0 for GIS data and maps. Key points include: Web 3.0 will improve searchability of GIS data through more metadata, tags, and standards to make systems more interoperable. Mobile GIS will allow data streaming and simple data access on devices. Augmented reality combines location data with mobile devices and could be the future of GIS. Preparing for Web 3.0 requires adding more data, information, tags and prioritizing user feedback to improve search results.
Southwest Airlines –Nuts about Online CommunicationBSI
This document summarizes Southwest Airlines' use of online communication tools like blogs, social media, YouTube, and Flickr. It discusses the launch of their blog "Nuts About Southwest" in 2006 and how it now serves as a virtual focus group, place to share news and stories, and generate revenue. It describes their presence on Twitter, Facebook, Flickr and more. It also provides statistics on blog traffic and examples of how they have used the blog to engage with customers during incidents and shape discussions.
for Cyprus companies breakthrough e-Marketing tool from KIPR.ru (Russia)Dmitry Kravtsov
If your Cyprus Real Estate business is to Develop and Sale Property - this offer is only for your attention. Boost your Property sales in Russia with KIPR.ru & list your offers for 6.5M audience.
The document discusses plans to pivot the APStartup social network for entrepreneurs into a new platform called CrowdRound.bz based in Belize. It will facilitate international crowdfunding for startups. CrowdRound.bz will take a 10% equity stake in startups in exchange for helping them raise early funding. It will create a special purpose vehicle (SPV) company in Belize for each startup, issue shares in the SPV to investors, and sell up to 50 shares to crowdfunding investors internationally. This offshore structure is meant to simplify regulations compared to different jurisdictions.
Restaurantul Integra este singurul restaurant de pe litoralul romanesc care a introdus un meniu complet raw vegan. Dieta Raw Vegan este noul trend in materie de nutritie pe Planeta. www.laintegra.ro
Analytics Forum Ibm 20080101 20091120 (Dashboard Report) 1Raony Guimarães
This document provides analytics data from Google Analytics for a forum website called "Forum IBM" between January 2008 and November 2009. It summarizes key metrics about visits, visitors, traffic sources, technical details, maps, and content for the site over this time period. The highest visiting country was Brazil, which accounted for over 112,000 visits from 311 cities. The top city was Ribeirao Preto with over 52,000 visits.
Analytics e baske_tsk_201106_(visitorsoverviewreport)OneClick
According to the site analytics for June 1-30, 2011:
1) There were 114,080 total visits from 24,701 unique visitors who viewed 315,638 pages.
2) The average time on site was 5 minutes and 2 seconds with a 41.23% bounce rate and 13.54% of visits being new.
3) Firefox, Internet Explorer, and Chrome were the most commonly used browsers, accounting for over 80% of visits.
Estatísticas analisadas do Blog do Torcedor (www.blogdotorcedor.com.br), de 2...Jamildo Melo
This document summarizes analytics data for the website www.blogdotorcedor.com.br between October 29, 2008 and April 29, 2009. Some key findings include:
- The site had 404,371 visitors over this period with 2,894,871 total visits and 4,137,711 pageviews.
- The majority of traffic came from Brazil, with over 2.7 million visits, and other top countries included the US, Portugal, Canada, and Spain.
- The most visited page was the main page at /blogs/blogdotorcedor/ which received over 2.3 million views alone.
Building your online bridge to customers with social mediaWOMDavid
The document discusses strategies for marketing a dance instruction business called Dancin' Time including using various online and offline marketing channels such as search engines, referrals, TV, radio, print, and social media. It also provides analytics on website traffic and visitor behavior for the Dancin' Time website from January to June 2011. The document advocates using a multi-channel customer funnel approach including free content, social media, websites, and in-person interactions to generate sales.
The document is a report from Google Analytics summarizing website traffic and usage for affluentmagazine.com over two periods: October 17, 2010 - November 16, 2010 and September 16, 2010 - October 16, 2010. Key findings include a 56.37% increase in visits, higher bounce rates and shorter average time on site compared to the previous period, and traffic primarily from search engines and direct visits. The United States was the top country for traffic.
This summary analyzes web traffic to the site www.sematopia.com from January 2006 to April 2011:
- The site received over 1.2 million visits from over 1 million unique visitors who viewed nearly 1.6 million pages.
- Most visits were from search engines (84.58%), followed by referring sites (9.77%) and direct traffic (5.65%).
- The top search engine referrals were from Google, and the most popular organic search keywords were related to learning Ajax, PHP, and checking engine lights.
This document summarizes website analytics data from April 1-30, 2010 and compares it to March 1-31, 2010. It shows that visits increased 1.90% to 43,245, pageviews increased 106.52% to 250,055, and time on site and pages per visit also increased from the previous month, while the bounce rate decreased 46.11%. Search engines accounted for 79.96% of traffic.
This document summarizes analytics data for the website www.zahara.co.za from October 1, 2011 to January 1, 2012. It shows that there were 2,482 total visits over this period, with 2,139 unique visitors. Visitors viewed a total of 4,738 pages across these visits, spending an average of 2 minutes and 8 seconds on the site per visit. The bounce rate was 65.83% and 86.14% of visits were from new visitors. The top three browsers used were Opera Mini, Internet Explorer, and Firefox. The majority of traffic came from direct visits and search engines like Google. South Africa accounted for the largest share of visits geographically.
Analytics e baske_tsk_201107_(visitorsoverviewreport)OneClick
Visitors to the site increased from July 4th to July 25th, peaking at around 3,000 visitors per day. Over the month there were 25,966 unique visitors who made 107,347 visits and viewed 271,425 pages with an average of 2.53 pages per visit. Visitors spent on average 4 minutes and 19 seconds on the site with a bounce rate of 47.58% and 16.54% of visits being from new visitors. Firefox was the most commonly used browser for visiting the site, accounting for 36.41% of visits.
Estatísticas analisadas do Blog do Torcedor (www.blogdotorcedor.com.br), de 2...Blog do Torcedor/JC Online
This document summarizes analytics data for the website www.blogdotorcedor.com.br from October 28, 2008 to April 28, 2009. Some key findings include:
- There were over 2.8 million visits and 4.1 million pageviews during this period.
- The majority of traffic (42%) came from referring sites like google and jc.uol.com.br, while 39% was direct and 18% from search engines.
- The top page was /blogs/blogdotorcedor/ which received over 2.3 million views alone, accounting for 57% of all pageviews.
Analytics e baske_tsk_201104_(visitorsoverviewreport)OneClick
Visitors to the site fluctuated between around 4,000 and 8,000 over the month of April 2011. There were a total of 43,296 unique visitors who made 192,328 visits and viewed 707,018 pages with an average of 3.68 pages per visit. Visitors spent an average of 00:07:05 on the site and 30.82% bounced without viewing additional pages. Firefox was the most commonly used browser, accounting for 38.95% of visits.
How to Craft a Successful Facebook Ad Campaignzehno
This document provides an overview of how to craft a successful Facebook ad campaign. It discusses setting goals rather than focusing on tools, the benefits of Facebook ads like hypertargeting and measurability, and tips from case studies. Lightning round case studies on campaigns for St. Ambrose University, Bowdoin College, and Tulane University show how targeting specific audiences drove website traffic, engagement, and conversions. The presentation emphasizes starting small, continual testing and optimization, and integrating ads with other marketing tools.
According to the analytics data from a website between January 2009 and March 2010:
- The site had over 7.5 million visitors and over 13 million pageviews
- Most visitors used Internet Explorer or Firefox as their browser and had DSL or cable internet connections
- Visitors spent an average of just under 1 minute on the site and over 70% bounced without viewing multiple pages
This document summarizes analytics data for the website granitecountertopsraleighnc.com from February 11, 2011 to November 2, 2011. Some key findings include: there were 2,221 total visits, 1,670 unique visitors, and 7,606 total pageviews. The average time on site was 3 minutes 10 seconds and the bounce rate was 36.56%. The majority of traffic came from search engines (77.58%), with the top search engine being Google (66.28%).
Analytics e baske_tsk_201109_(visitorsoverviewreport)OneClick
The document is a report from Google Analytics summarizing website traffic for a site between September 1-30, 2011. It shows that there were 22,289 visitors who made 114,941 visits to the site, viewing 248,589 pages over an average time of 4 minutes and 3 seconds. The bounce rate was 53.55% and 14.34% of visits were from new visitors. Firefox was the most commonly used browser, accounting for 35.91% of visits.
The document summarizes website analytics data from July 1 to September 30, 2011 and compares it to the previous period of April 1 to June 30, 2011. There was an increase in visits, pageviews, time on site, and unique visitors over the period. Top pages included webinars and short course materials. The majority of traffic came from direct visits and bounce rate and new visits also increased compared to the previous period.
The document summarizes website analytics for a sample report between August 1, 2009 and November 30, 2009. There were 1,678 total visits to the site with the majority (61.56%) coming from referrals from elonphoenix.com. The top five pages viewed were related to photos, students, events, and alumni. Most traffic came from North Carolina (52.68%), with the majority from the city of Elon College. Over 80% of visits were from new visitors.
Analytics Forum Ibm 20090810 20090909 (Dashboard Report)Raony Guimarães
This document provides analytics data for a forum website from August 10, 2009 to September 9, 2009. It summarizes key metrics such as visits (7,343), pageviews (43,638), average time on site (00:06:06), bounce rate (32.77%), and new visits (36.74%). The top traffic sources were direct (41.06%) and search engines (37.19%). The majority of visits came from Brazil (6,938 visits, 94.48% of total), with the top city being Ribeirao Preto (4,104 visits). The most viewed page was the forum index page (/infobio/forum/index.php).
Heritage Portal Website Latest google analytics_reportBank of Ireland
This summary analyzes web traffic and usage for a heritage portal website between April 23-29, 2012 and compares it to the previous period of April 16-22, 2012. Key findings include a 17.78% decrease in visits, 35.91% decrease in pageviews, and increases in bounce rate and new visits. The top traffic source was organic Google searches, followed by direct traffic. Browser usage saw decreases for Firefox, Chrome and Safari but an increase for Opera. Popular pages like the homepage and blog saw pageview decreases between 30-40%.
Similar to Analytics Www Tashy Ro 201001 (Dashboard Report) (20)
Studiu privind atitudinile disfunctionale in trafic:comportamentul agresivDr. Tanase Tasente
Cadrul si scopul studiului:prezentul studiu doreste sa evidentieze comportamentul agresiv al participantilor la trafic, pe axele de impulsivitate si ostilitate. Ca si cadru teoretic s-a pornit de la ideea legaturii dintre cognitii-atitutidini si comportament, cognitiile disfunctinale determina subiectii sa dezvolte atitudini si comportamente disfunctionale.Mai precis modul in care participantii din trafic prelucreaza informatiile, determina comportamentele acestora. Schema de mai jos sintetizeaza cel mai bine acest principiu. In psihologia sigurantei se muta accentul de pe skill(abilitati de conducere auto) pe stil(comportamentul in trafic).
Studiu privind atitudinile disfunctionale in trafic: comportamentul agresivDr. Tanase Tasente
Cadrul si scopul studiului:prezentul studiu doreste sa evidentieze comportamentul agresiv al participantilor la trafic, pe axele de impulsivitate si ostilitate. Ca si cadru teoretic s-a pornit de la ideea legaturii dintre cognitii-atitutidini si comportament, cognitiile disfunctinale determina subiectii sa dezvolte atitudini si comportamente disfunctionale.Mai precis modul in care participantii din trafic prelucreaza informatiile, determina comportamentele acestora. Schema de mai jos sintetizeaza cel mai bine acest principiu. In psihologia sigurantei se muta accentul de pe skill(abilitati de conducere auto) pe stil(comportamentul in trafic).
Politica monetară postcriză: Reconfigurarea obiectivelor şi a instrumentelorDr. Tanase Tasente
Mugur Isărescu, guvernatorul BNR
Disertaţie susţinută cu ocazia decernării titlului de Doctor Honoris Causa al Universităţii “Andrei Şaguna” din Constanţa
Implicatiile utilizarii internetului in activitatile scolare si extrascolare ...Dr. Tanase Tasente
Asist. univ. drd. Nicoleta Ciacu, asist. univ. Tanase Tasente, Implicatiile utilizarii internetului in activitatile scolare si extrascolare
ale studentilor (The Consequences of Using the Internet in the Student's Curricular and Extracurricular Activities), Revista "Strategii manageriale" - Universitatea "Constantin Brancoveanu" Pitesti, anul III, nr. 4 (10)/2010, ISSN 1844 – 668X.
Dandelion Hashtable: beyond billion requests per second on a commodity serverAntonios Katsarakis
This slide deck presents DLHT, a concurrent in-memory hashtable. Despite efforts to optimize hashtables, that go as far as sacrificing core functionality, state-of-the-art designs still incur multiple memory accesses per request and block request processing in three cases. First, most hashtables block while waiting for data to be retrieved from memory. Second, open-addressing designs, which represent the current state-of-the-art, either cannot free index slots on deletes or must block all requests to do so. Third, index resizes block every request until all objects are copied to the new index. Defying folklore wisdom, DLHT forgoes open-addressing and adopts a fully-featured and memory-aware closed-addressing design based on bounded cache-line-chaining. This design offers lock-free index operations and deletes that free slots instantly, (2) completes most requests with a single memory access, (3) utilizes software prefetching to hide memory latencies, and (4) employs a novel non-blocking and parallel resizing. In a commodity server and a memory-resident workload, DLHT surpasses 1.6B requests per second and provides 3.5x (12x) the throughput of the state-of-the-art closed-addressing (open-addressing) resizable hashtable on Gets (Deletes).
How information systems are built or acquired puts information, which is what they should be about, in a secondary place. Our language adapted accordingly, and we no longer talk about information systems but applications. Applications evolved in a way to break data into diverse fragments, tightly coupled with applications and expensive to integrate. The result is technical debt, which is re-paid by taking even bigger "loans", resulting in an ever-increasing technical debt. Software engineering and procurement practices work in sync with market forces to maintain this trend. This talk demonstrates how natural this situation is. The question is: can something be done to reverse the trend?
Must Know Postgres Extension for DBA and Developer during MigrationMydbops
Mydbops Opensource Database Meetup 16
Topic: Must-Know PostgreSQL Extensions for Developers and DBAs During Migration
Speaker: Deepak Mahto, Founder of DataCloudGaze Consulting
Date & Time: 8th June | 10 AM - 1 PM IST
Venue: Bangalore International Centre, Bangalore
Abstract: Discover how PostgreSQL extensions can be your secret weapon! This talk explores how key extensions enhance database capabilities and streamline the migration process for users moving from other relational databases like Oracle.
Key Takeaways:
* Learn about crucial extensions like oracle_fdw, pgtt, and pg_audit that ease migration complexities.
* Gain valuable strategies for implementing these extensions in PostgreSQL to achieve license freedom.
* Discover how these key extensions can empower both developers and DBAs during the migration process.
* Don't miss this chance to gain practical knowledge from an industry expert and stay updated on the latest open-source database trends.
Mydbops Managed Services specializes in taking the pain out of database management while optimizing performance. Since 2015, we have been providing top-notch support and assistance for the top three open-source databases: MySQL, MongoDB, and PostgreSQL.
Our team offers a wide range of services, including assistance, support, consulting, 24/7 operations, and expertise in all relevant technologies. We help organizations improve their database's performance, scalability, efficiency, and availability.
Contact us: info@mydbops.com
Visit: https://www.mydbops.com/
Follow us on LinkedIn: https://in.linkedin.com/company/mydbops
For more details and updates, please follow up the below links.
Meetup Page : https://www.meetup.com/mydbops-databa...
Twitter: https://twitter.com/mydbopsofficial
Blogs: https://www.mydbops.com/blog/
Facebook(Meta): https://www.facebook.com/mydbops/
Getting the Most Out of ScyllaDB Monitoring: ShareChat's TipsScyllaDB
ScyllaDB monitoring provides a lot of useful information. But sometimes it’s not easy to find the root of the problem if something is wrong or even estimate the remaining capacity by the load on the cluster. This talk shares our team's practical tips on: 1) How to find the root of the problem by metrics if ScyllaDB is slow 2) How to interpret the load and plan capacity for the future 3) Compaction strategies and how to choose the right one 4) Important metrics which aren’t available in the default monitoring setup.
"NATO Hackathon Winner: AI-Powered Drug Search", Taras KlobaFwdays
This is a session that details how PostgreSQL's features and Azure AI Services can be effectively used to significantly enhance the search functionality in any application.
In this session, we'll share insights on how we used PostgreSQL to facilitate precise searches across multiple fields in our mobile application. The techniques include using LIKE and ILIKE operators and integrating a trigram-based search to handle potential misspellings, thereby increasing the search accuracy.
We'll also discuss how the azure_ai extension on PostgreSQL databases in Azure and Azure AI Services were utilized to create vectors from user input, a feature beneficial when users wish to find specific items based on text prompts. While our application's case study involves a drug search, the techniques and principles shared in this session can be adapted to improve search functionality in a wide range of applications. Join us to learn how PostgreSQL and Azure AI can be harnessed to enhance your application's search capability.
"What does it really mean for your system to be available, or how to define w...Fwdays
We will talk about system monitoring from a few different angles. We will start by covering the basics, then discuss SLOs, how to define them, and why understanding the business well is crucial for success in this exercise.
"$10 thousand per minute of downtime: architecture, queues, streaming and fin...Fwdays
Direct losses from downtime in 1 minute = $5-$10 thousand dollars. Reputation is priceless.
As part of the talk, we will consider the architectural strategies necessary for the development of highly loaded fintech solutions. We will focus on using queues and streaming to efficiently work and manage large amounts of data in real-time and to minimize latency.
We will focus special attention on the architectural patterns used in the design of the fintech system, microservices and event-driven architecture, which ensure scalability, fault tolerance, and consistency of the entire system.
QR Secure: A Hybrid Approach Using Machine Learning and Security Validation F...AlexanderRichford
QR Secure: A Hybrid Approach Using Machine Learning and Security Validation Functions to Prevent Interaction with Malicious QR Codes.
Aim of the Study: The goal of this research was to develop a robust hybrid approach for identifying malicious and insecure URLs derived from QR codes, ensuring safe interactions.
This is achieved through:
Machine Learning Model: Predicts the likelihood of a URL being malicious.
Security Validation Functions: Ensures the derived URL has a valid certificate and proper URL format.
This innovative blend of technology aims to enhance cybersecurity measures and protect users from potential threats hidden within QR codes 🖥 🔒
This study was my first introduction to using ML which has shown me the immense potential of ML in creating more secure digital environments!
What is an RPA CoE? Session 1 – CoE VisionDianaGray10
In the first session, we will review the organization's vision and how this has an impact on the COE Structure.
Topics covered:
• The role of a steering committee
• How do the organization’s priorities determine CoE Structure?
Speaker:
Chris Bolin, Senior Intelligent Automation Architect Anika Systems
"Scaling RAG Applications to serve millions of users", Kevin GoedeckeFwdays
How we managed to grow and scale a RAG application from zero to thousands of users in 7 months. Lessons from technical challenges around managing high load for LLMs, RAGs and Vector databases.
Essentials of Automations: Exploring Attributes & Automation ParametersSafe Software
Building automations in FME Flow can save time, money, and help businesses scale by eliminating data silos and providing data to stakeholders in real-time. One essential component to orchestrating complex automations is the use of attributes & automation parameters (both formerly known as “keys”). In fact, it’s unlikely you’ll ever build an Automation without using these components, but what exactly are they?
Attributes & automation parameters enable the automation author to pass data values from one automation component to the next. During this webinar, our FME Flow Specialists will cover leveraging the three types of these output attributes & parameters in FME Flow: Event, Custom, and Automation. As a bonus, they’ll also be making use of the Split-Merge Block functionality.
You’ll leave this webinar with a better understanding of how to maximize the potential of automations by making use of attributes & automation parameters, with the ultimate goal of setting your enterprise integration workflows up on autopilot.
As AI technology is pushing into IT I was wondering myself, as an “infrastructure container kubernetes guy”, how get this fancy AI technology get managed from an infrastructure operational view? Is it possible to apply our lovely cloud native principals as well? What benefit’s both technologies could bring to each other?
Let me take this questions and provide you a short journey through existing deployment models and use cases for AI software. On practical examples, we discuss what cloud/on-premise strategy we may need for applying it to our own infrastructure to get it to work from an enterprise perspective. I want to give an overview about infrastructure requirements and technologies, what could be beneficial or limiting your AI use cases in an enterprise environment. An interactive Demo will give you some insides, what approaches I got already working for real.
Keywords: AI, Containeres, Kubernetes, Cloud Native
Event Link: https://meine.doag.org/events/cloudland/2024/agenda/#agendaId.4211
The Department of Veteran Affairs (VA) invited Taylor Paschal, Knowledge & Information Management Consultant at Enterprise Knowledge, to speak at a Knowledge Management Lunch and Learn hosted on June 12, 2024. All Office of Administration staff were invited to attend and received professional development credit for participating in the voluntary event.
The objectives of the Lunch and Learn presentation were to:
- Review what KM ‘is’ and ‘isn’t’
- Understand the value of KM and the benefits of engaging
- Define and reflect on your “what’s in it for me?”
- Share actionable ways you can participate in Knowledge - - Capture & Transfer
[OReilly Superstream] Occupy the Space: A grassroots guide to engineering (an...Jason Yip
The typical problem in product engineering is not bad strategy, so much as “no strategy”. This leads to confusion, lack of motivation, and incoherent action. The next time you look for a strategy and find an empty space, instead of waiting for it to be filled, I will show you how to fill it in yourself. If you’re wrong, it forces a correction. If you’re right, it helps create focus. I’ll share how I’ve approached this in the past, both what works and lessons for what didn’t work so well.
In the realm of cybersecurity, offensive security practices act as a critical shield. By simulating real-world attacks in a controlled environment, these techniques expose vulnerabilities before malicious actors can exploit them. This proactive approach allows manufacturers to identify and fix weaknesses, significantly enhancing system security.
This presentation delves into the development of a system designed to mimic Galileo's Open Service signal using software-defined radio (SDR) technology. We'll begin with a foundational overview of both Global Navigation Satellite Systems (GNSS) and the intricacies of digital signal processing.
The presentation culminates in a live demonstration. We'll showcase the manipulation of Galileo's Open Service pilot signal, simulating an attack on various software and hardware systems. This practical demonstration serves to highlight the potential consequences of unaddressed vulnerabilities, emphasizing the importance of offensive security practices in safeguarding critical infrastructure.
QA or the Highway - Component Testing: Bridging the gap between frontend appl...zjhamm304
These are the slides for the presentation, "Component Testing: Bridging the gap between frontend applications" that was presented at QA or the Highway 2024 in Columbus, OH by Zachary Hamm.
GraphRAG for LifeSciences Hands-On with the Clinical Knowledge Graph
Analytics Www Tashy Ro 201001 (Dashboard Report)
1. www.tashy.ro Jan 1, 2010 - Jan 31, 2010
Dashboard Comparing to: Site
Visits
2,000 2,000
1,000 1,000
0 0
Jan 4 Jan 11 Jan 18 Jan 25
Site Usage
32,972 Visits 73.15% Bounce Rate
51,570 Pageviews 00:04:23 Avg. Time on Site
1.56 Pages/Visit 52.29% % New Visits
Visitors Overview Map Overlay
Visitors
1,000 1,000
500 500
0 0
Jan 4 Jan 11 Jan 18 Jan 25
Visitors
18,072 Visits
1 14,020
Traffic Sources Overview Content Overview
Referring Sites Pages Pageviews % Pageviews
16,082.00 (48.77%)
Search Engines / 16,805 32.59%
9,576.00 (29.04%)
Direct Traffic /despretashy/ 10,642 20.64%
7,112.00 (21.57%)
Other /?page_id=586 5,241 10.16%
202 (0.61%)
/curs-valutar-euro-lei-in-timp- 496 0.96%
/consulul-roman-ioan-nuica- 470 0.91%
1 Google Analytics
2. www.tashy.ro Jan 1, 2010 - Jan 31, 2010
Visitors Overview Comparing to: Site
Visitors
1,000 1,000
500 500
0 0
Jan 4 Jan 11 Jan 18 Jan 25
18,072 people visited this site
32,972 Visits
18,072 Absolute Unique Visitors
51,570 Pageviews
1.56 Average Pageviews
00:04:23 Time on Site
73.15% Bounce Rate
52.29% New Visits
Technical Profile
Browser Visits % visits Connection Speed Visits % visits
Firefox 20,409 61.90% Unknown 18,085 54.85%
Internet Explorer 6,874 20.85% DSL 6,559 19.89%
Chrome 3,350 10.16% Cable 5,483 16.63%
Opera 1,511 4.58% T1 2,482 7.53%
SeaMonkey 478 1.45% Dialup 355 1.08%
2 Google Analytics
3. www.tashy.ro Jan 1, 2010 - Jan 31, 2010
Traffic Sources Overview Comparing to: Site
Visits
2,000 2,000
1,000 1,000
0 0
Jan 4 Jan 11 Jan 18 Jan 25
All traffic sources sent a total of 32,972 visits
21.57% Direct Traffic Referring Sites
16,082.00 (48.77%)
Search Engines
48.77% Referring Sites 9,576.00 (29.04%)
Direct Traffic
7,112.00 (21.57%)
29.04% Search Engines Other
202 (0.61%)
Top Traffic Sources
Sources Visits % visits Keywords Visits % visits
google (organic) 9,298 28.20% tashy 376 3.93%
trafficspammer.com (referral) 8,949 27.14% bercea mondialu 243 2.54%
(direct) ((none)) 7,112 21.57% blogul lui mircea badea 156 1.63%
247autohits.com (referral) 3,904 11.84% www.tashy.ro 124 1.29%
parolamess.go.ro (referral) 616 1.87% vacanta 2010 117 1.22%
3 Google Analytics
4. www.tashy.ro Jan 1, 2010 - Jan 31, 2010
Map Overlay Comparing to: Site
Visits
1 14,020
32,972 visits came from 101 countries/territories
Site Usage
Visits Pages/Visit Avg. Time on Site % New Visits Bounce Rate
32,972 1.56 00:04:23 52.42% 73.15%
% of Site Total: Site Avg: Site Avg: Site Avg: Site Avg:
100.00% 1.56 (0.00%) 00:04:23 (0.00%) 52.29% (0.26%) 73.15% (0.00%)
Country/Territory Visits Pages/Visit Avg. Time on % New Visits Bounce Rate
Site
Romania 14,020 1.70 00:02:35 69.76% 73.24%
United States 3,411 1.53 00:06:19 33.86% 69.77%
Vietnam 1,805 1.64 00:07:33 27.65% 66.43%
Netherlands 947 1.71 00:09:08 25.87% 62.94%
Poland 882 1.42 00:05:28 30.27% 73.92%
Italy 847 1.62 00:07:40 40.73% 67.06%
Hungary 731 1.50 00:06:36 65.94% 72.64%
United Kingdom 644 1.40 00:04:14 43.32% 77.02%
Lithuania 612 1.49 00:15:01 11.76% 69.77%
4 Google Analytics
5. Germany 580 1.41 00:04:02 62.76% 76.21%
1 - 10 of 101
5 Google Analytics
6. www.tashy.ro Jan 1, 2010 - Jan 31, 2010
Content Overview Comparing to: Site
Pageviews
3,000 3,000
1,500 1,500
0 0
Jan 4 Jan 11 Jan 18 Jan 25
Pages on this site were viewed a total of 51,570 times
51,570 Pageviews
40,524 Unique Views
73.16% Bounce Rate
Top Content
Pages Pageviews % Pageviews
/ 16,805 32.59%
/despretashy/ 10,642 20.64%
/?page_id=586 5,241 10.16%
/curs-valutar-euro-lei-in-timp-real-pe-piata-interbancara-eurobor/ 496 0.96%
/consulul-roman-ioan-nuica-actor-de-filme-porno-in-chisinau/ 470 0.91%
6 Google Analytics