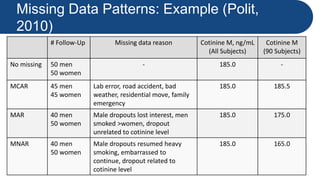
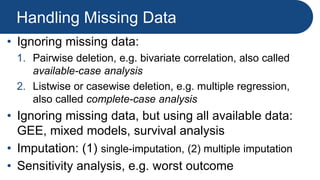
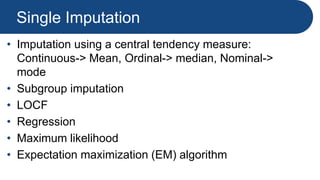
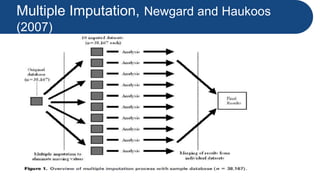
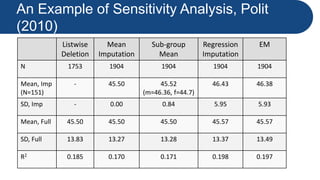
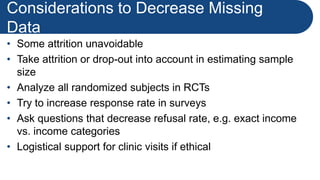
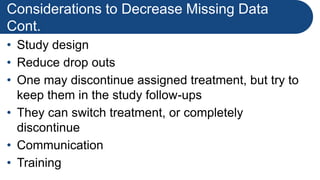
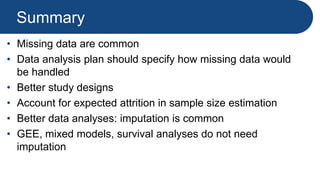
Analysis of Data
with Missing
Values
Chakra Budhathoki, PhD
02/17/2022
Nursing Office for Research Administration
Outline
1. Background
2. Extent of missingness
3. Pattern of missingness
4. Strategies in dealing with missing data
5. Examples
6. Prevention of missing data
7. Summary
Background
• Missing data very common in research studies
• Best solution? Avoid them!!
• Not taught in many statistical courses
• Handling missing data
• Reporting of missing data
Background Cont.
• Preventing missing data
• Study designs: (1) longitudinal vs. cross-sectional,
(2) randomized vs. observational studies
• Missingness is generally an outcome in some pilot
or feasibility studies
Missing Data: Cross-sectional
ID Var_1 Var_2 Var_3 .. .. .. .. Var_k
1 x x x x x x x x
2 x . x x x x x x
3 x . . . . . . .
..
..
..
n x x x x x x x x
Missing Data: Cross-sectional, Scales
ID SS1_1 SS1_2 SS1_3 SS2_1 SS2_2 .. .. SSx_nk
1 x x x x x x x x
2 x . x x x x x x
3 x x x . x x . x
..
..
..
n x x x x x x x x
Missing Data: Longitudinal
ID T1_Var_
1
T2_Var_
1
T3_Var_
1
T1_Var_
2
T2_Var_
2
T3_Var_
2
.. ..
1 x x x x x x x x
2 x x . x x x x x
3 x . x x . x x x
..
..
..
n x x x x x x x x
Coding Missing Data
• Often coded as values that are not possible, e.g.
999, -999
• If coded that way, make sure to specify them as
missing in data analysis
• Sometimes such coding scheme developed to list
different reasons of missing data
• If they are not important, safer to leave blank or
enter “.”
Extent of Missing Data
• <1%, <5%, 10% or higher?
• By item/variable or by subject?
• Most values missing in one or a few variables?
• Missing values in one or a few primary variables?
• Missing values in one or a few secondary
variables?
• Few values missing in several variables?
Pattern of Missing Data
• Item-level missingness
• Subject-level missingness
• Missing in outcome or predictor variable?
• Missing in continuous or categorical variable?
• Designed trials or designed surveys?
• Unstructured surveys?
Type of Missing Data
1. Missing completely at random
(MCAR)
2. Missing at random (MAR)
3. Missing not at random (MNAR)
Missing Completely at Random
(MCAR)
• Reasons: Lab error, road accident, bad weather,
residential move, family emergency, inadvertently
skipping questions
• Example: income and age, prob of missing data on
income does not depend on income and age, i.e.
participants of all ages likely to report income
• Little’s MCAR test
• Non-significant test => MCAR
Missing at Random (MAR)
• Also called ignorable missingness
• Probability of missingness on Y does not depend
on Y itself after controlling for other variables
• Example: prob of missingness on income depends
on age (older more likely to report than younger),
but participants within each group equally likely to
report income, i.e. prob of missingness on income
unrelated within an age group
Missing Not at Random (MNAR)
• Also called nonignorable missingness
• Missingness is not MCAR or MAR
• Probability of missingness on Y depends on values
of Y itself, e.g. people with higher income do not
report income (even after controlling for other
factors)
• No statistical tests for MAR and MNAR, but can
run some sensitivity analyses
Missing Data Patterns: Example (Polit,
2010)
# Follow-Up Missing data reason Cotinine M, ng/mL
(All Subjects)
Cotinine M
(90 Subjects)
No missing 50 men
50 women
- 185.0 -
MCAR 45 men
45 women
Lab error, road accident, bad
weather, residential move, family
emergency
185.0 185.5
MAR 40 men
50 women
Male dropouts lost interest, men
smoked >women, dropout
unrelated to cotinine level
185.0 175.0
MNAR 40 men
50 women
Male dropouts resumed heavy
smoking, embarrassed to
continue, dropout related to
cotinine level
185.0 165.0
Handling Missing Data
• Ignoring missing data:
1. Pairwise deletion, e.g. bivariate correlation, also called
available-case analysis
2. Listwise or casewise deletion, e.g. multiple regression,
also called complete-case analysis
• Ignoring missing data, but using all available data:
GEE, mixed models, survival analysis
• Imputation: (1) single-imputation, (2) multiple imputation
• Sensitivity analysis, e.g. worst outcome
Single Imputation
• Imputation using a central tendency measure:
Continuous-> Mean, Ordinal-> median, Nominal->
mode
• Subgroup imputation
• LOCF
• Regression
• Maximum likelihood
• Expectation maximization (EM) algorithm
Multiple Imputation, Newgard and Haukoos
(2007)
An Example of Sensitivity Analysis, Polit
(2010)
Listwise
Deletion
Mean
Imputation
Sub-group
Mean
Regression
Imputation
EM
N 1753 1904 1904 1904 1904
Mean, Imp
(N=151)
- 45.50 45.52
(m=46.36, f=44.7)
46.43 46.38
SD, Imp - 0.00 0.84 5.95 5.93
Mean, Full 45.50 45.50 45.50 45.57 45.57
SD, Full 13.83 13.27 13.28 13.37 13.49
R2 0.185 0.170 0.171 0.198 0.197
Example: Mean Imputation
Example: Mode Imputation
Example: LOCF
Example: MI
Considerations to Decrease Missing
Data
• Some attrition unavoidable
• Take attrition or drop-out into account in estimating sample
size
• Analyze all randomized subjects in RCTs
• Try to increase response rate in surveys
• Ask questions that decrease refusal rate, e.g. exact income
vs. income categories
• Logistical support for clinic visits if ethical
Considerations to Decrease Missing Data
Cont.
• Study design
• Reduce drop outs
• One may discontinue assigned treatment, but try to
keep them in the study follow-ups
• They can switch treatment, or completely
discontinue
• Communication
• Training
Summary
• Missing data are common
• Data analysis plan should specify how missing data would
be handled
• Better study designs
• Account for expected attrition in sample size estimation
• Better data analyses: imputation is common
• GEE, mixed models, survival analyses do not need
imputation
References
Allison, P. D. (2002). Missing data. Sage publications.
Newgard, C. D., & Haukoos, J. S. (2007). Advanced
Statistics: Missing Data in Clinical Research-Part 2: Multiple
Imputation. Academic Emergency Medicine, 14: 669-678.
Polit, D. (2010). Statistics and data analysis for nursing
research. Pearson.

Analysis-of-data-with-missing-values.pptx

  • 1.
    Analysis of Data withMissing Values Chakra Budhathoki, PhD 02/17/2022 Nursing Office for Research Administration
  • 2.
    Outline 1. Background 2. Extentof missingness 3. Pattern of missingness 4. Strategies in dealing with missing data 5. Examples 6. Prevention of missing data 7. Summary
  • 3.
    Background • Missing datavery common in research studies • Best solution? Avoid them!! • Not taught in many statistical courses • Handling missing data • Reporting of missing data
  • 4.
    Background Cont. • Preventingmissing data • Study designs: (1) longitudinal vs. cross-sectional, (2) randomized vs. observational studies • Missingness is generally an outcome in some pilot or feasibility studies
  • 5.
    Missing Data: Cross-sectional IDVar_1 Var_2 Var_3 .. .. .. .. Var_k 1 x x x x x x x x 2 x . x x x x x x 3 x . . . . . . . .. .. .. n x x x x x x x x
  • 6.
    Missing Data: Cross-sectional,Scales ID SS1_1 SS1_2 SS1_3 SS2_1 SS2_2 .. .. SSx_nk 1 x x x x x x x x 2 x . x x x x x x 3 x x x . x x . x .. .. .. n x x x x x x x x
  • 7.
    Missing Data: Longitudinal IDT1_Var_ 1 T2_Var_ 1 T3_Var_ 1 T1_Var_ 2 T2_Var_ 2 T3_Var_ 2 .. .. 1 x x x x x x x x 2 x x . x x x x x 3 x . x x . x x x .. .. .. n x x x x x x x x
  • 8.
    Coding Missing Data •Often coded as values that are not possible, e.g. 999, -999 • If coded that way, make sure to specify them as missing in data analysis • Sometimes such coding scheme developed to list different reasons of missing data • If they are not important, safer to leave blank or enter “.”
  • 9.
    Extent of MissingData • <1%, <5%, 10% or higher? • By item/variable or by subject? • Most values missing in one or a few variables? • Missing values in one or a few primary variables? • Missing values in one or a few secondary variables? • Few values missing in several variables?
  • 10.
    Pattern of MissingData • Item-level missingness • Subject-level missingness • Missing in outcome or predictor variable? • Missing in continuous or categorical variable? • Designed trials or designed surveys? • Unstructured surveys?
  • 11.
    Type of MissingData 1. Missing completely at random (MCAR) 2. Missing at random (MAR) 3. Missing not at random (MNAR)
  • 12.
    Missing Completely atRandom (MCAR) • Reasons: Lab error, road accident, bad weather, residential move, family emergency, inadvertently skipping questions • Example: income and age, prob of missing data on income does not depend on income and age, i.e. participants of all ages likely to report income • Little’s MCAR test • Non-significant test => MCAR
  • 13.
    Missing at Random(MAR) • Also called ignorable missingness • Probability of missingness on Y does not depend on Y itself after controlling for other variables • Example: prob of missingness on income depends on age (older more likely to report than younger), but participants within each group equally likely to report income, i.e. prob of missingness on income unrelated within an age group
  • 14.
    Missing Not atRandom (MNAR) • Also called nonignorable missingness • Missingness is not MCAR or MAR • Probability of missingness on Y depends on values of Y itself, e.g. people with higher income do not report income (even after controlling for other factors) • No statistical tests for MAR and MNAR, but can run some sensitivity analyses
  • 15.
    Missing Data Patterns:Example (Polit, 2010) # Follow-Up Missing data reason Cotinine M, ng/mL (All Subjects) Cotinine M (90 Subjects) No missing 50 men 50 women - 185.0 - MCAR 45 men 45 women Lab error, road accident, bad weather, residential move, family emergency 185.0 185.5 MAR 40 men 50 women Male dropouts lost interest, men smoked >women, dropout unrelated to cotinine level 185.0 175.0 MNAR 40 men 50 women Male dropouts resumed heavy smoking, embarrassed to continue, dropout related to cotinine level 185.0 165.0
  • 16.
    Handling Missing Data •Ignoring missing data: 1. Pairwise deletion, e.g. bivariate correlation, also called available-case analysis 2. Listwise or casewise deletion, e.g. multiple regression, also called complete-case analysis • Ignoring missing data, but using all available data: GEE, mixed models, survival analysis • Imputation: (1) single-imputation, (2) multiple imputation • Sensitivity analysis, e.g. worst outcome
  • 17.
    Single Imputation • Imputationusing a central tendency measure: Continuous-> Mean, Ordinal-> median, Nominal-> mode • Subgroup imputation • LOCF • Regression • Maximum likelihood • Expectation maximization (EM) algorithm
  • 18.
    Multiple Imputation, Newgardand Haukoos (2007)
  • 19.
    An Example ofSensitivity Analysis, Polit (2010) Listwise Deletion Mean Imputation Sub-group Mean Regression Imputation EM N 1753 1904 1904 1904 1904 Mean, Imp (N=151) - 45.50 45.52 (m=46.36, f=44.7) 46.43 46.38 SD, Imp - 0.00 0.84 5.95 5.93 Mean, Full 45.50 45.50 45.50 45.57 45.57 SD, Full 13.83 13.27 13.28 13.37 13.49 R2 0.185 0.170 0.171 0.198 0.197
  • 20.
  • 21.
  • 22.
  • 23.
  • 24.
    Considerations to DecreaseMissing Data • Some attrition unavoidable • Take attrition or drop-out into account in estimating sample size • Analyze all randomized subjects in RCTs • Try to increase response rate in surveys • Ask questions that decrease refusal rate, e.g. exact income vs. income categories • Logistical support for clinic visits if ethical
  • 25.
    Considerations to DecreaseMissing Data Cont. • Study design • Reduce drop outs • One may discontinue assigned treatment, but try to keep them in the study follow-ups • They can switch treatment, or completely discontinue • Communication • Training
  • 26.
    Summary • Missing dataare common • Data analysis plan should specify how missing data would be handled • Better study designs • Account for expected attrition in sample size estimation • Better data analyses: imputation is common • GEE, mixed models, survival analyses do not need imputation
  • 27.
    References Allison, P. D.(2002). Missing data. Sage publications. Newgard, C. D., & Haukoos, J. S. (2007). Advanced Statistics: Missing Data in Clinical Research-Part 2: Multiple Imputation. Academic Emergency Medicine, 14: 669-678. Polit, D. (2010). Statistics and data analysis for nursing research. Pearson.