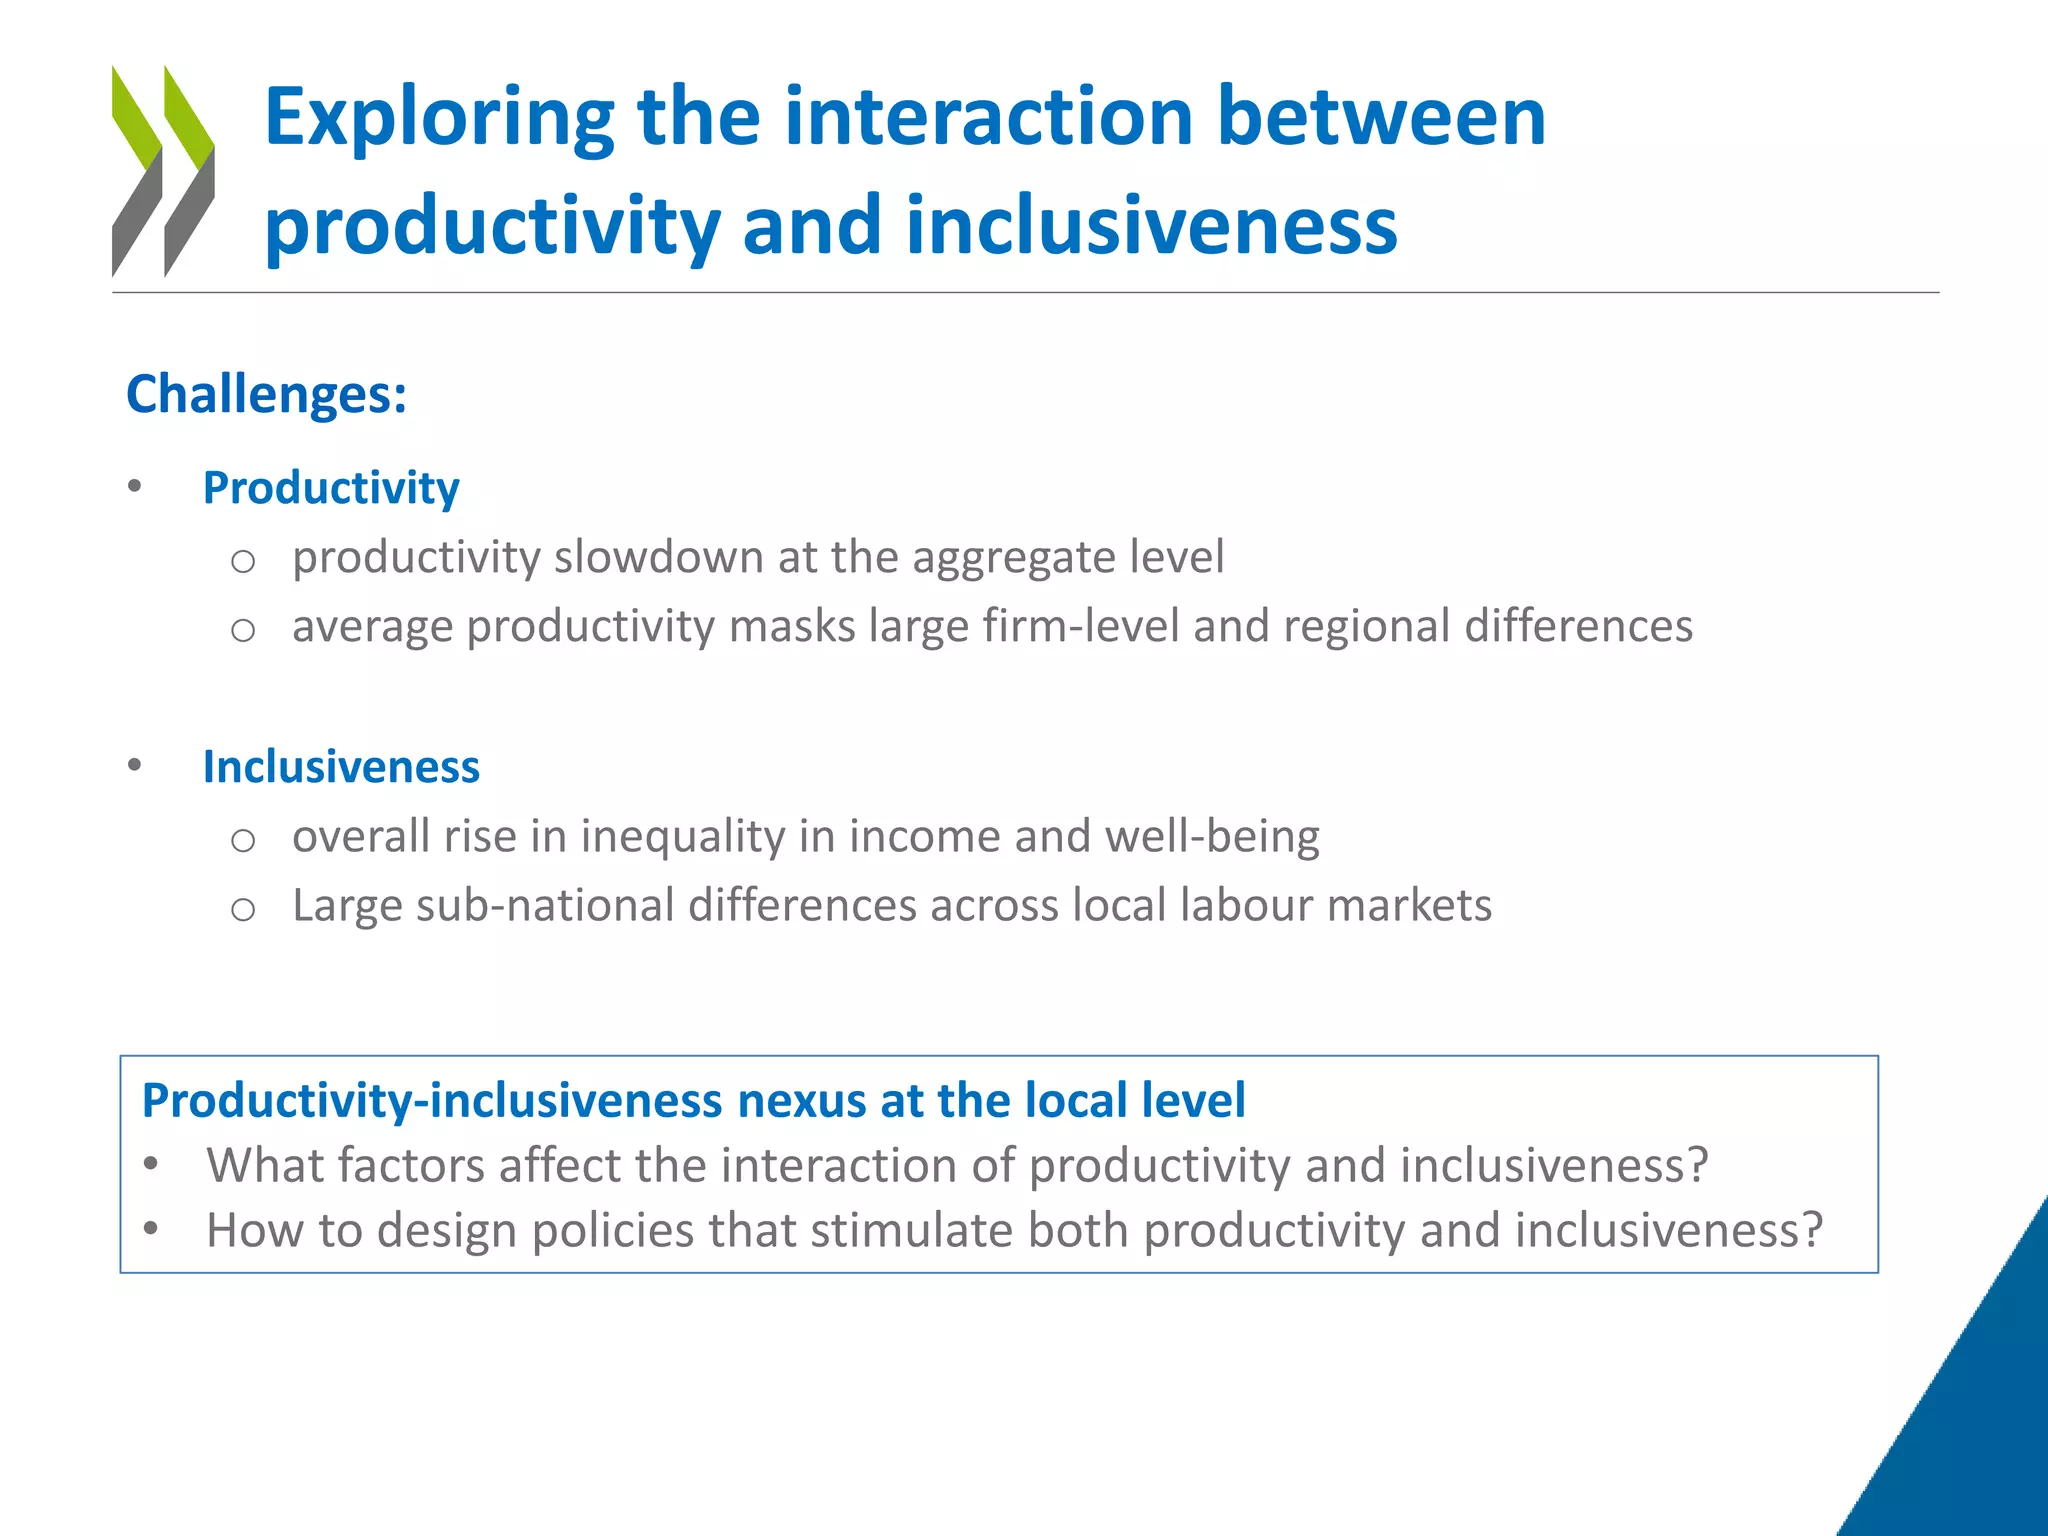
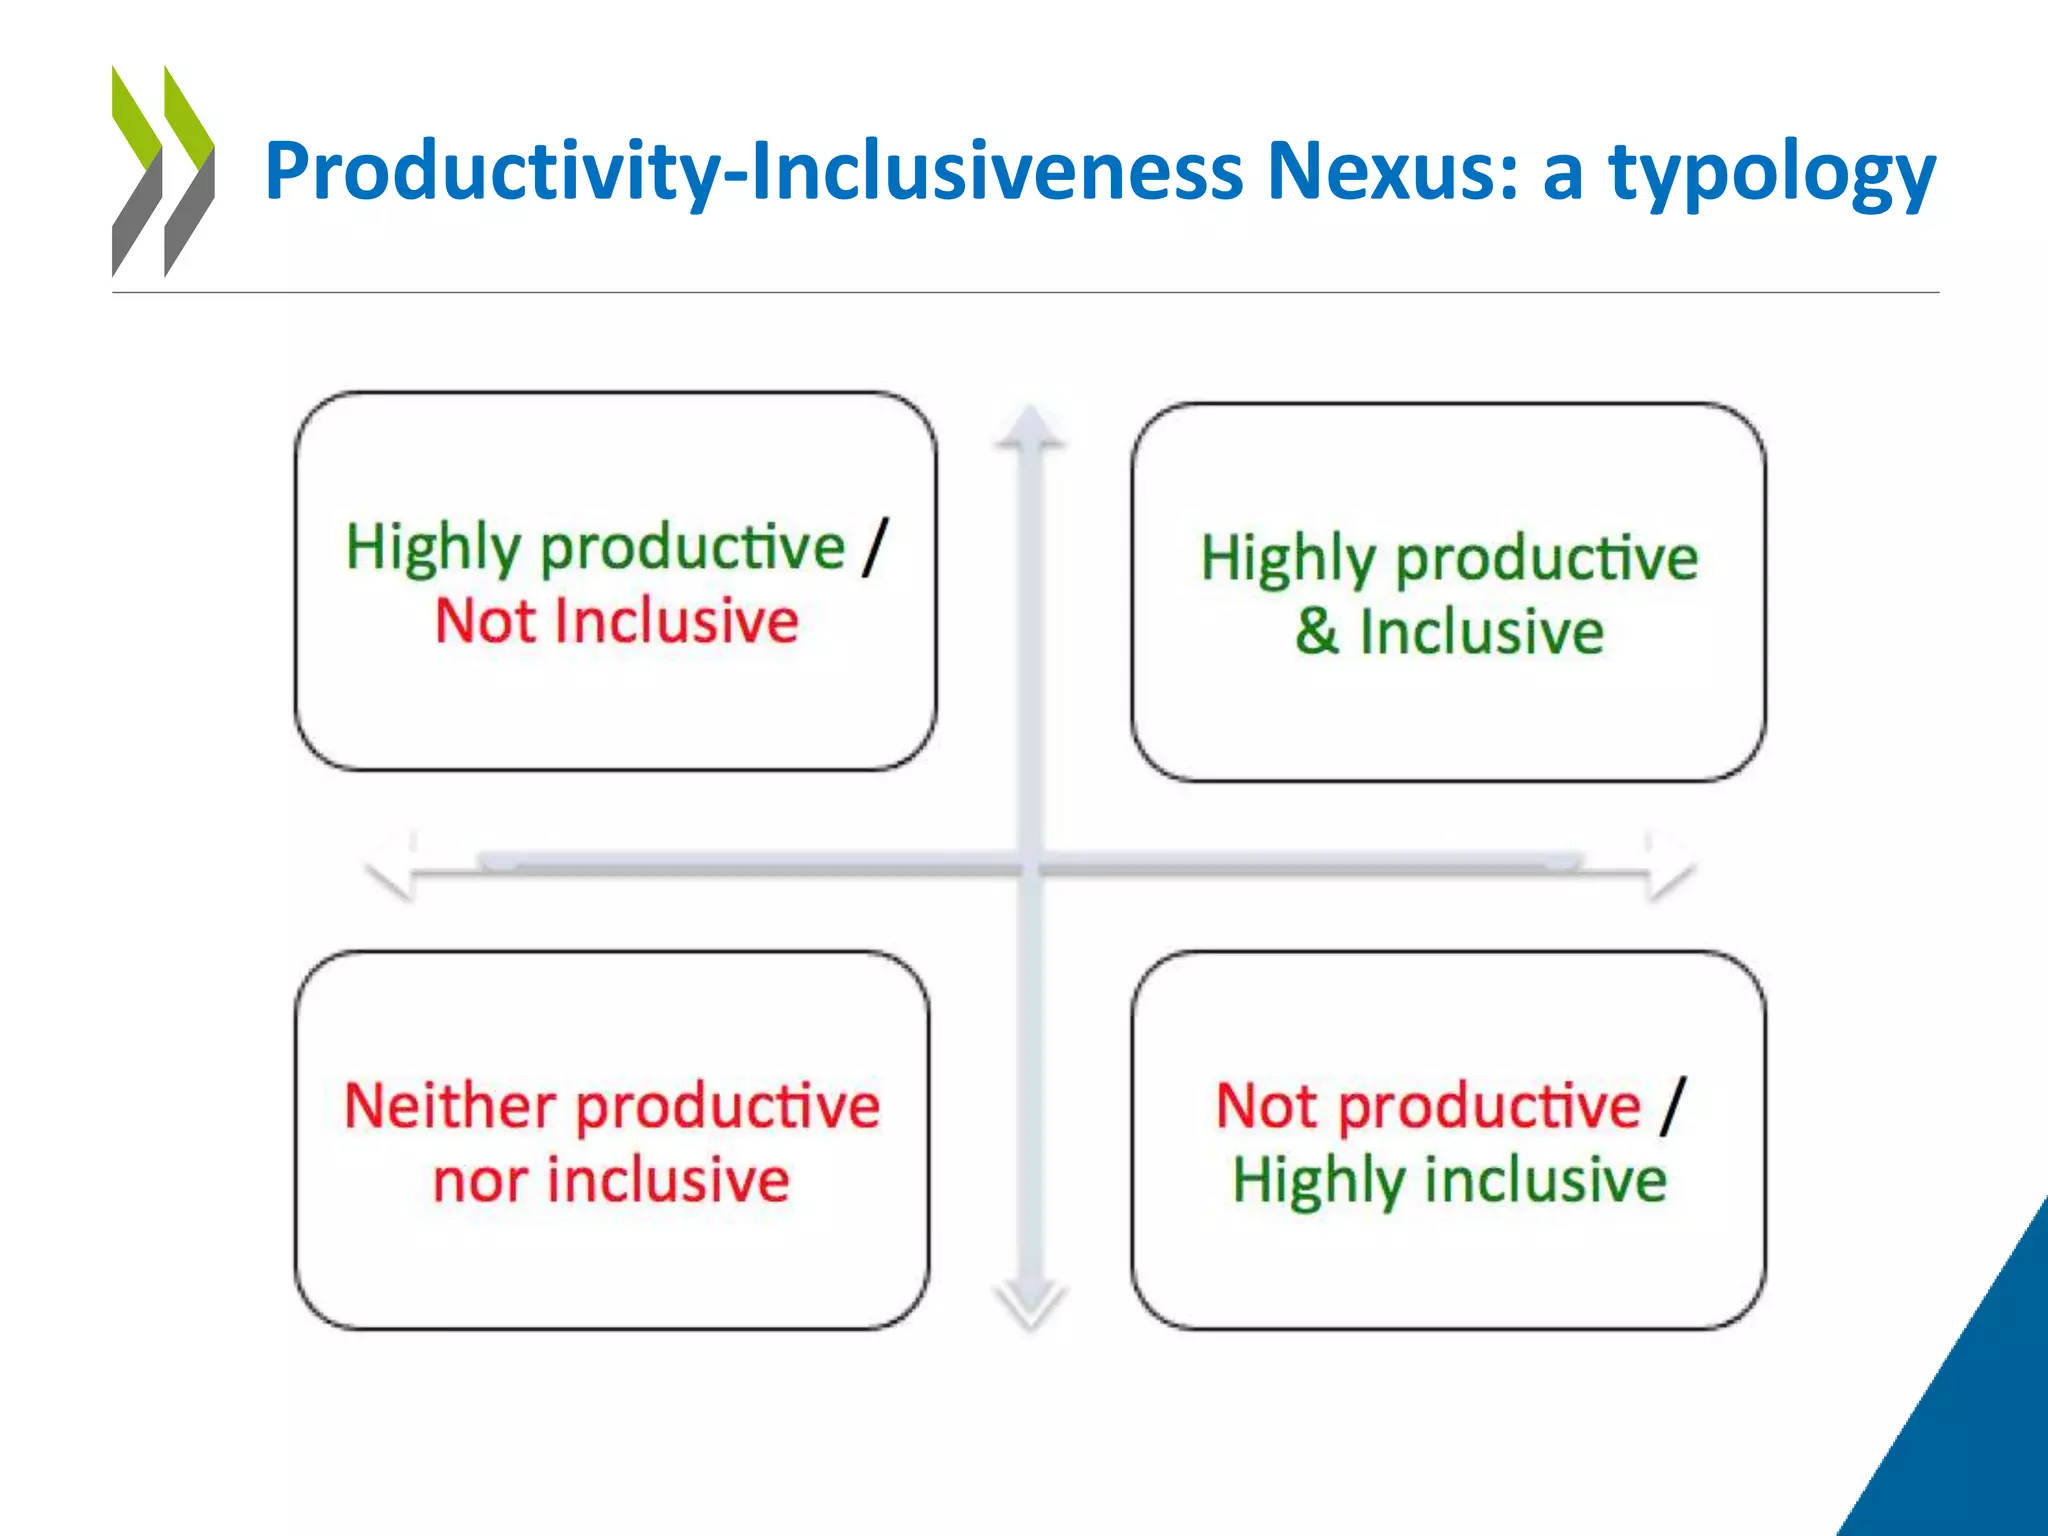
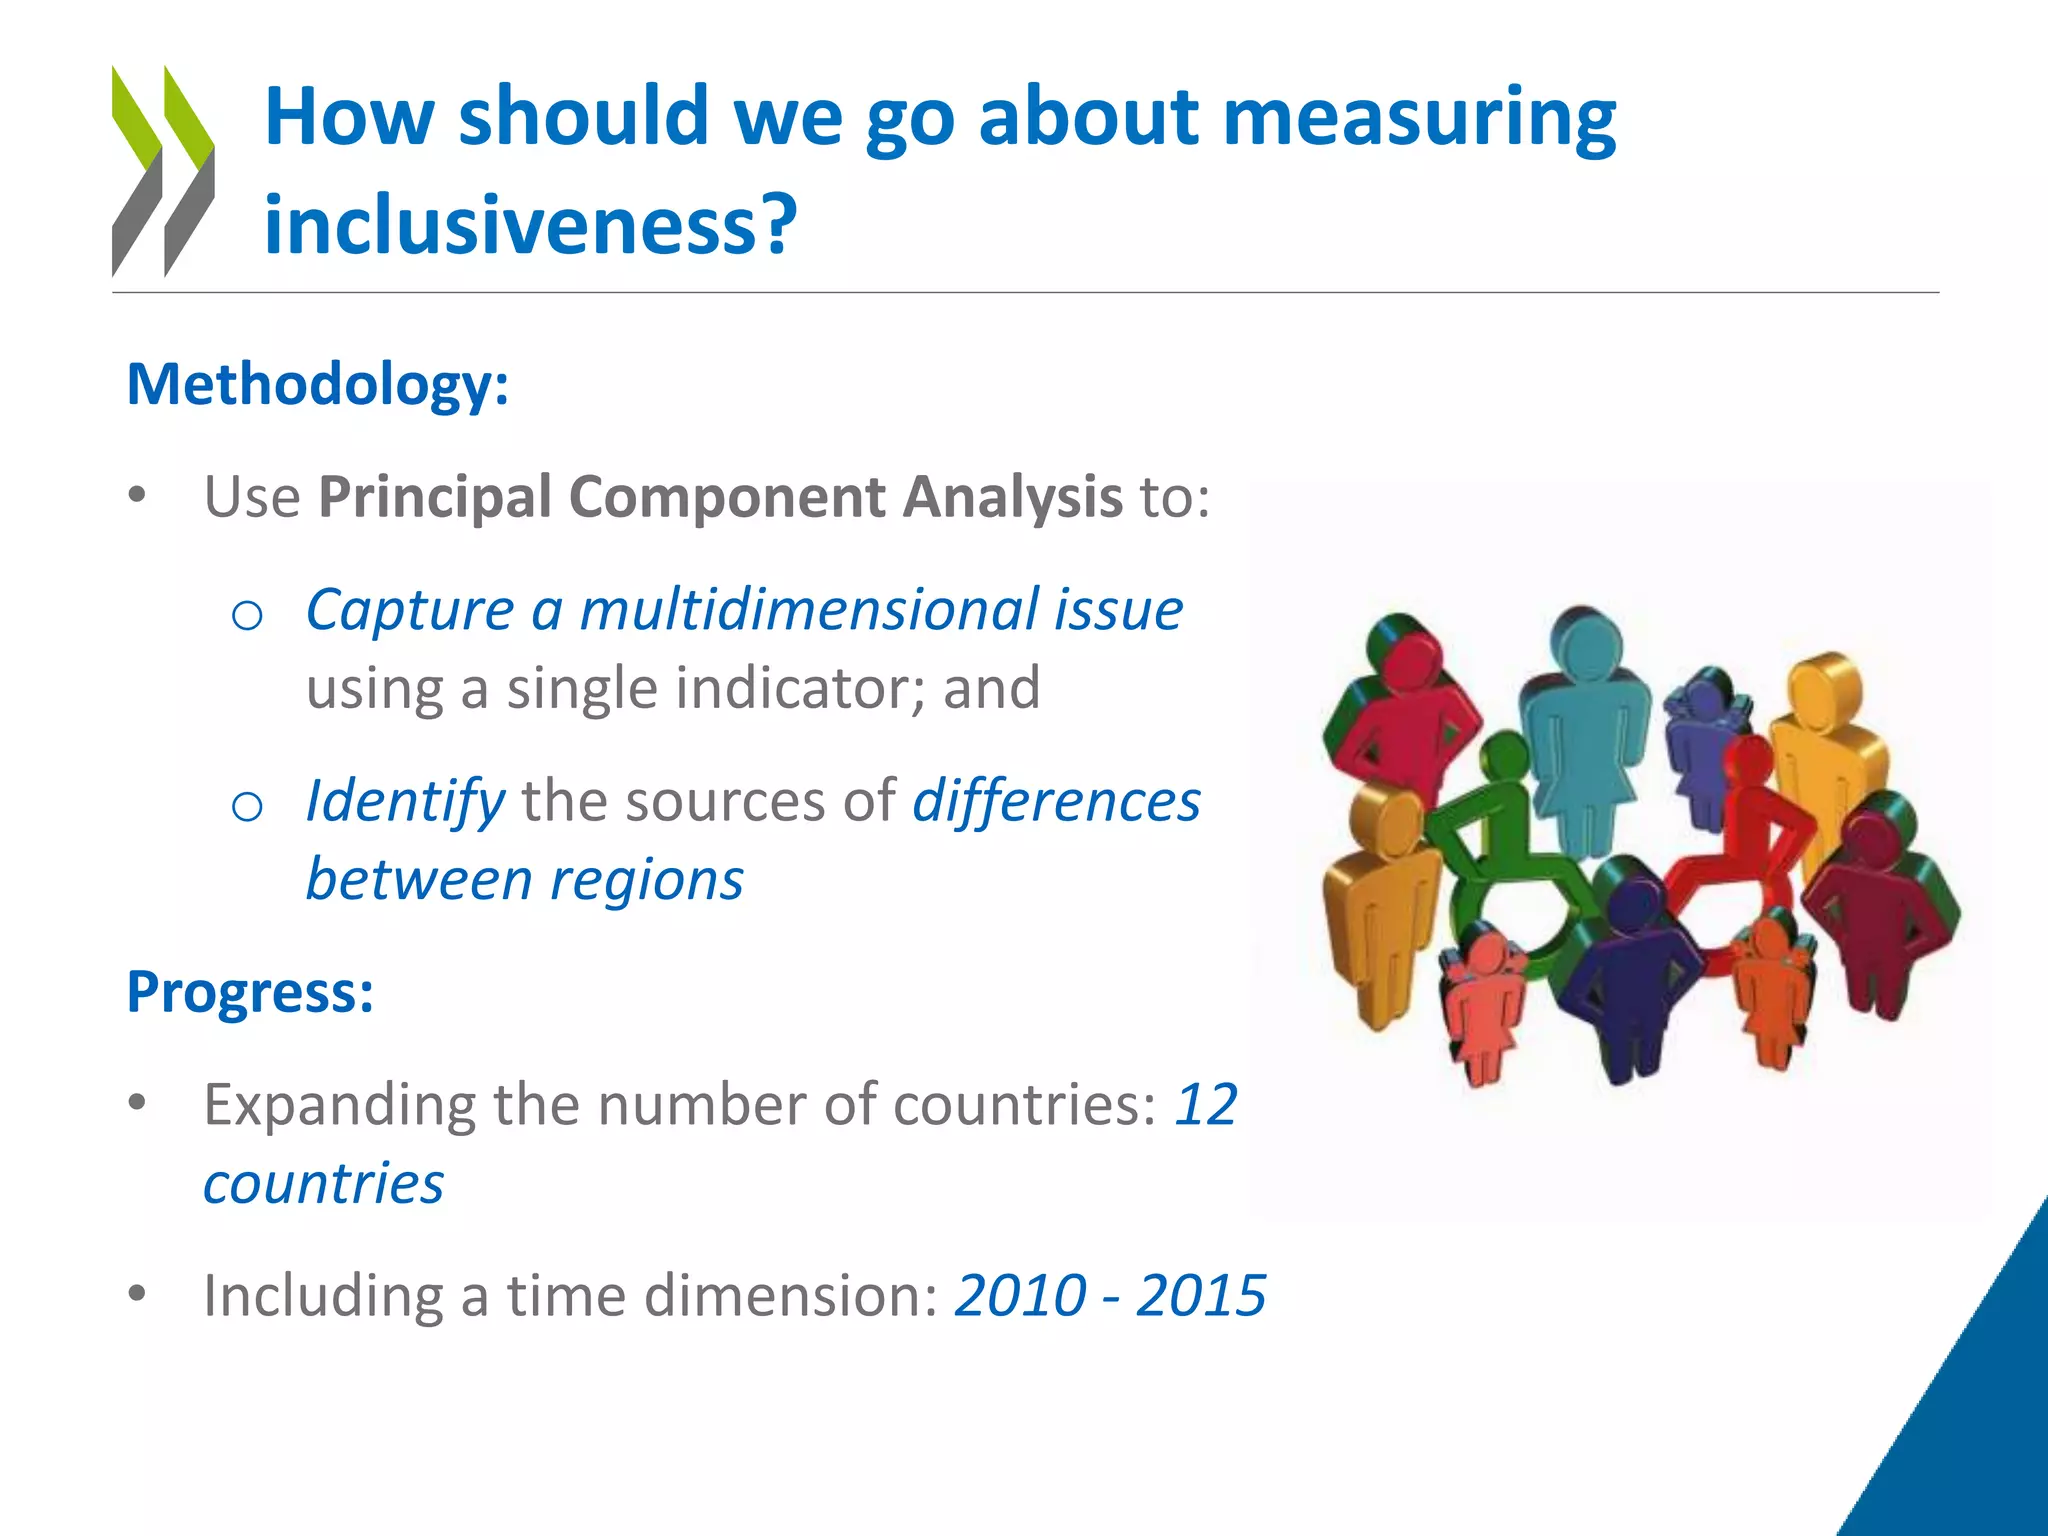
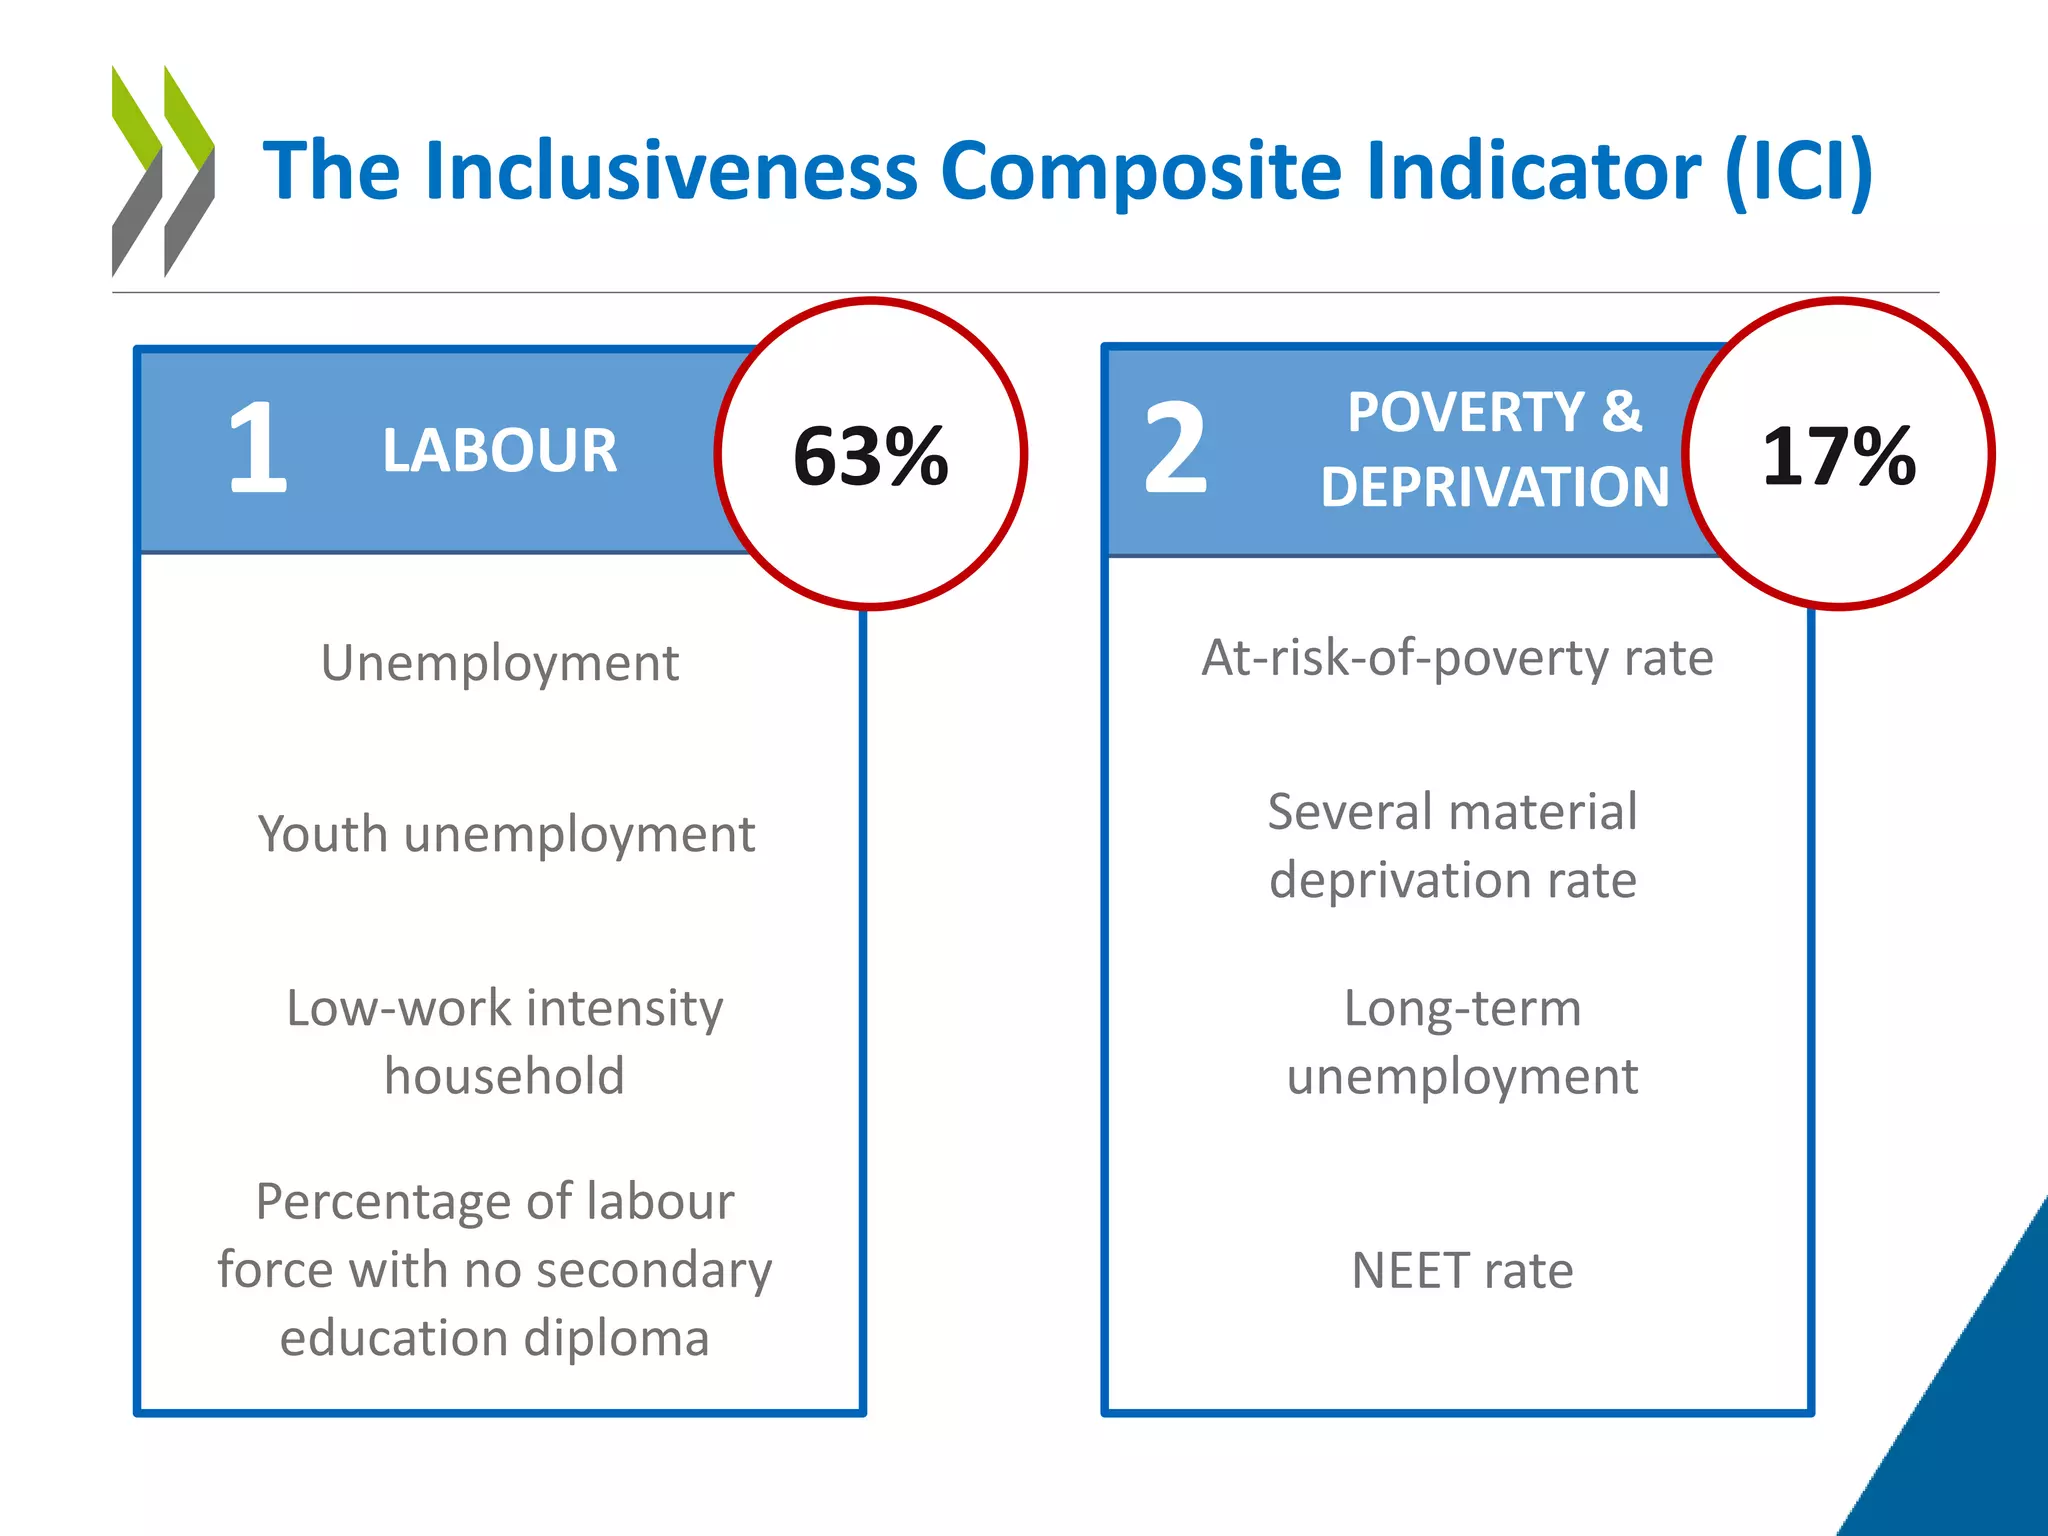
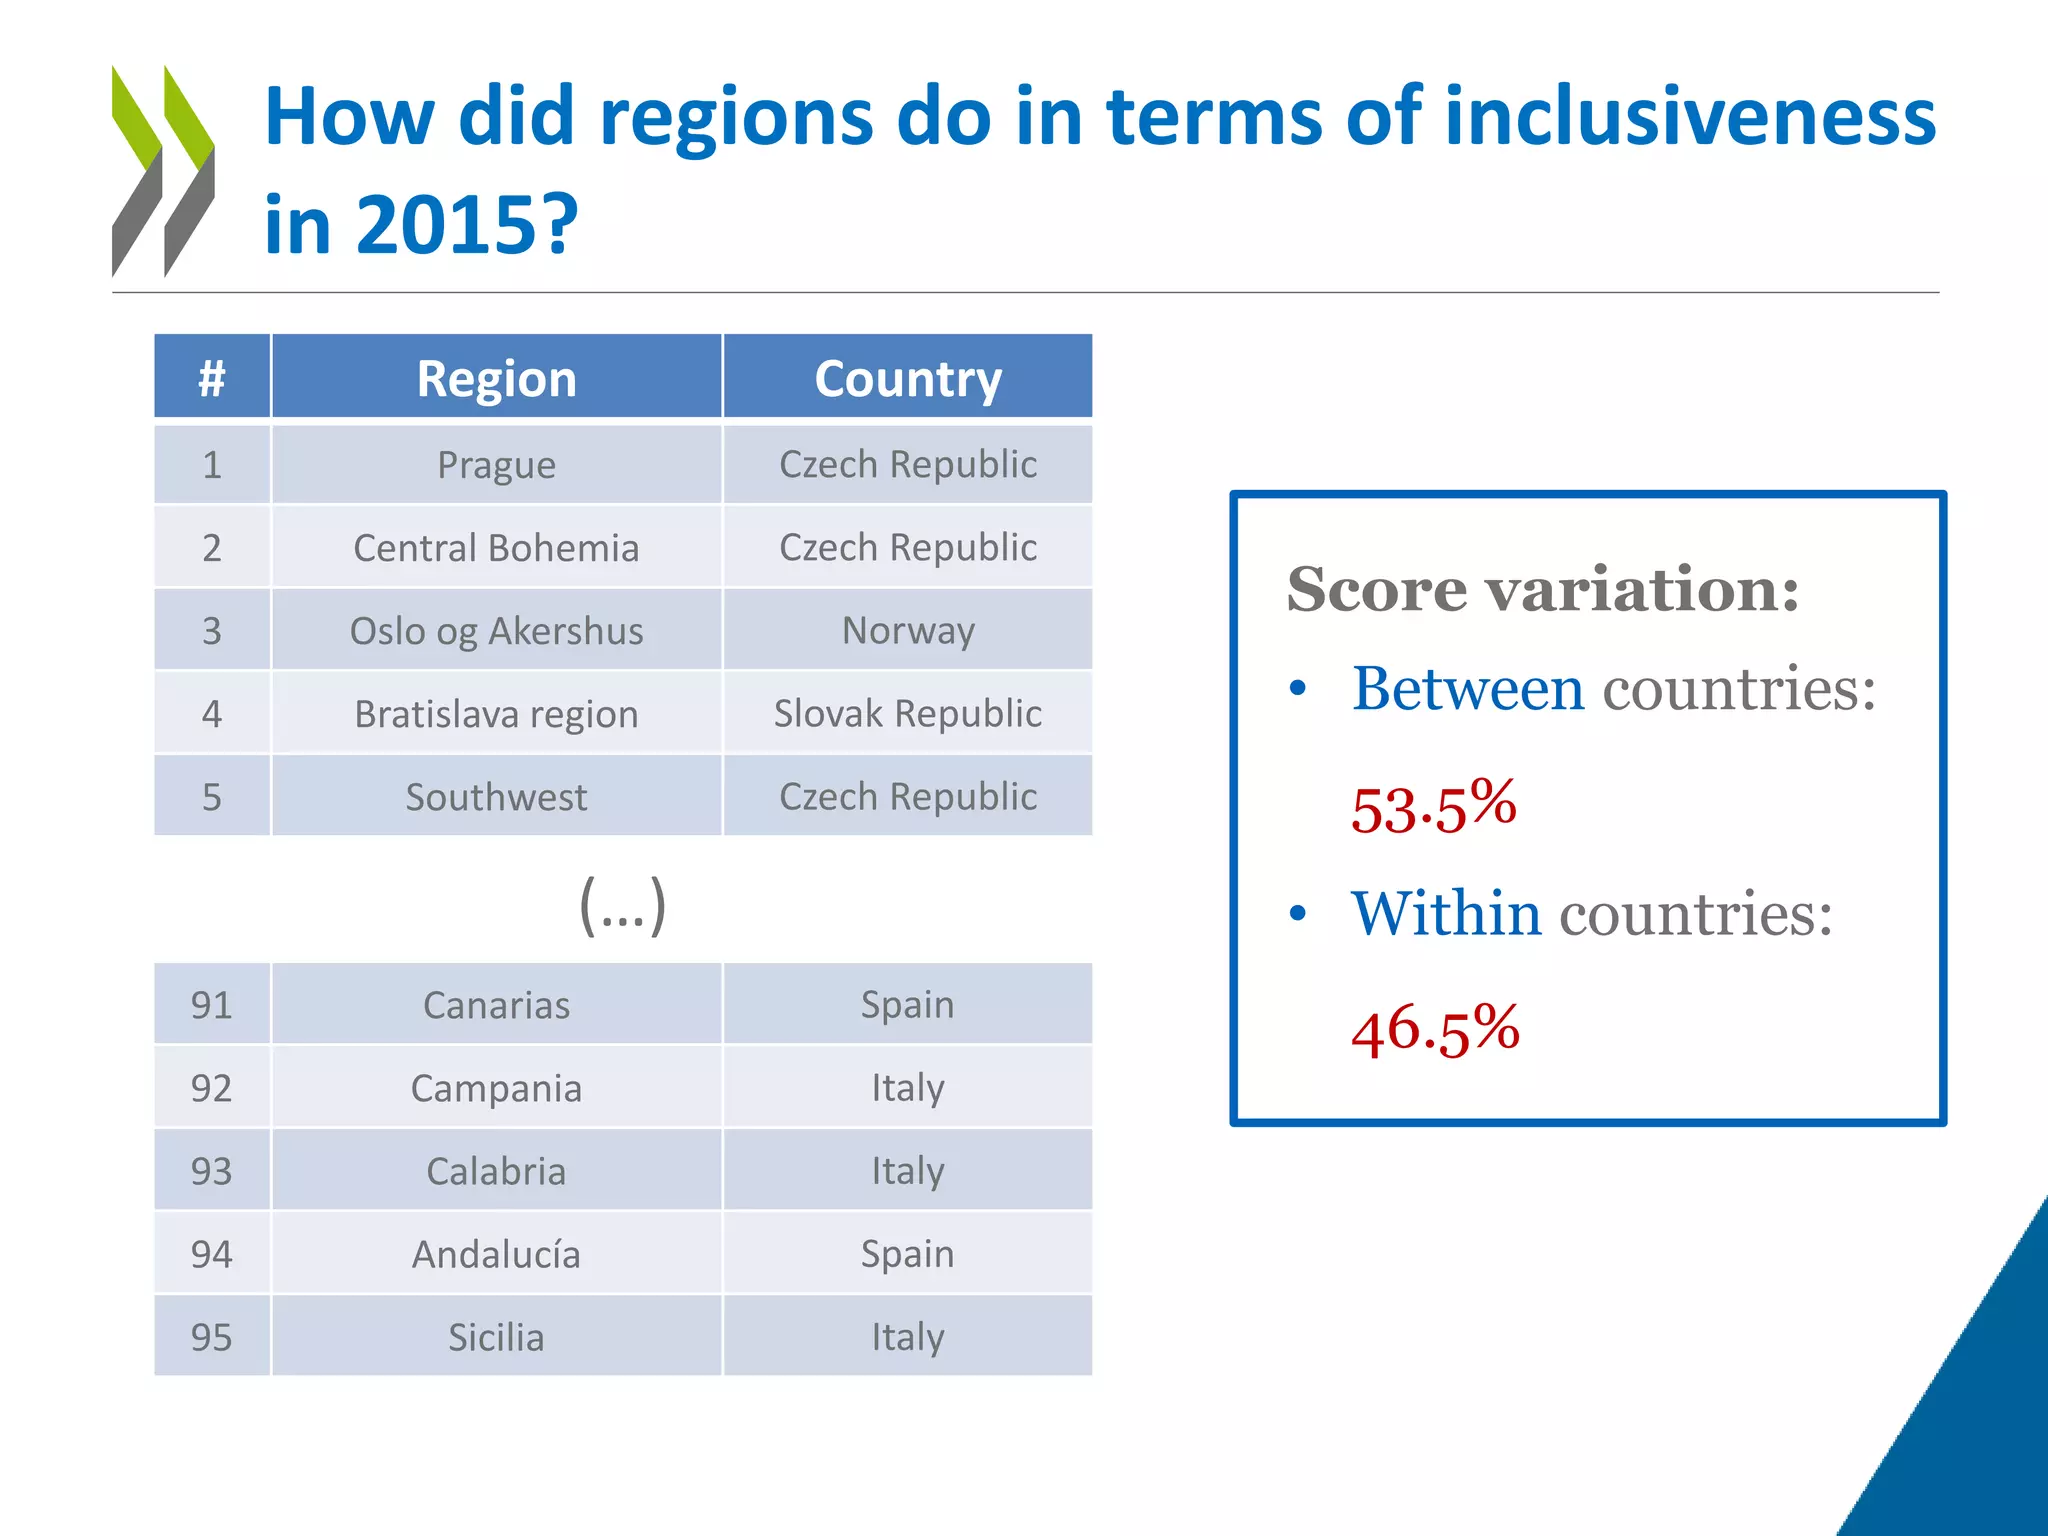
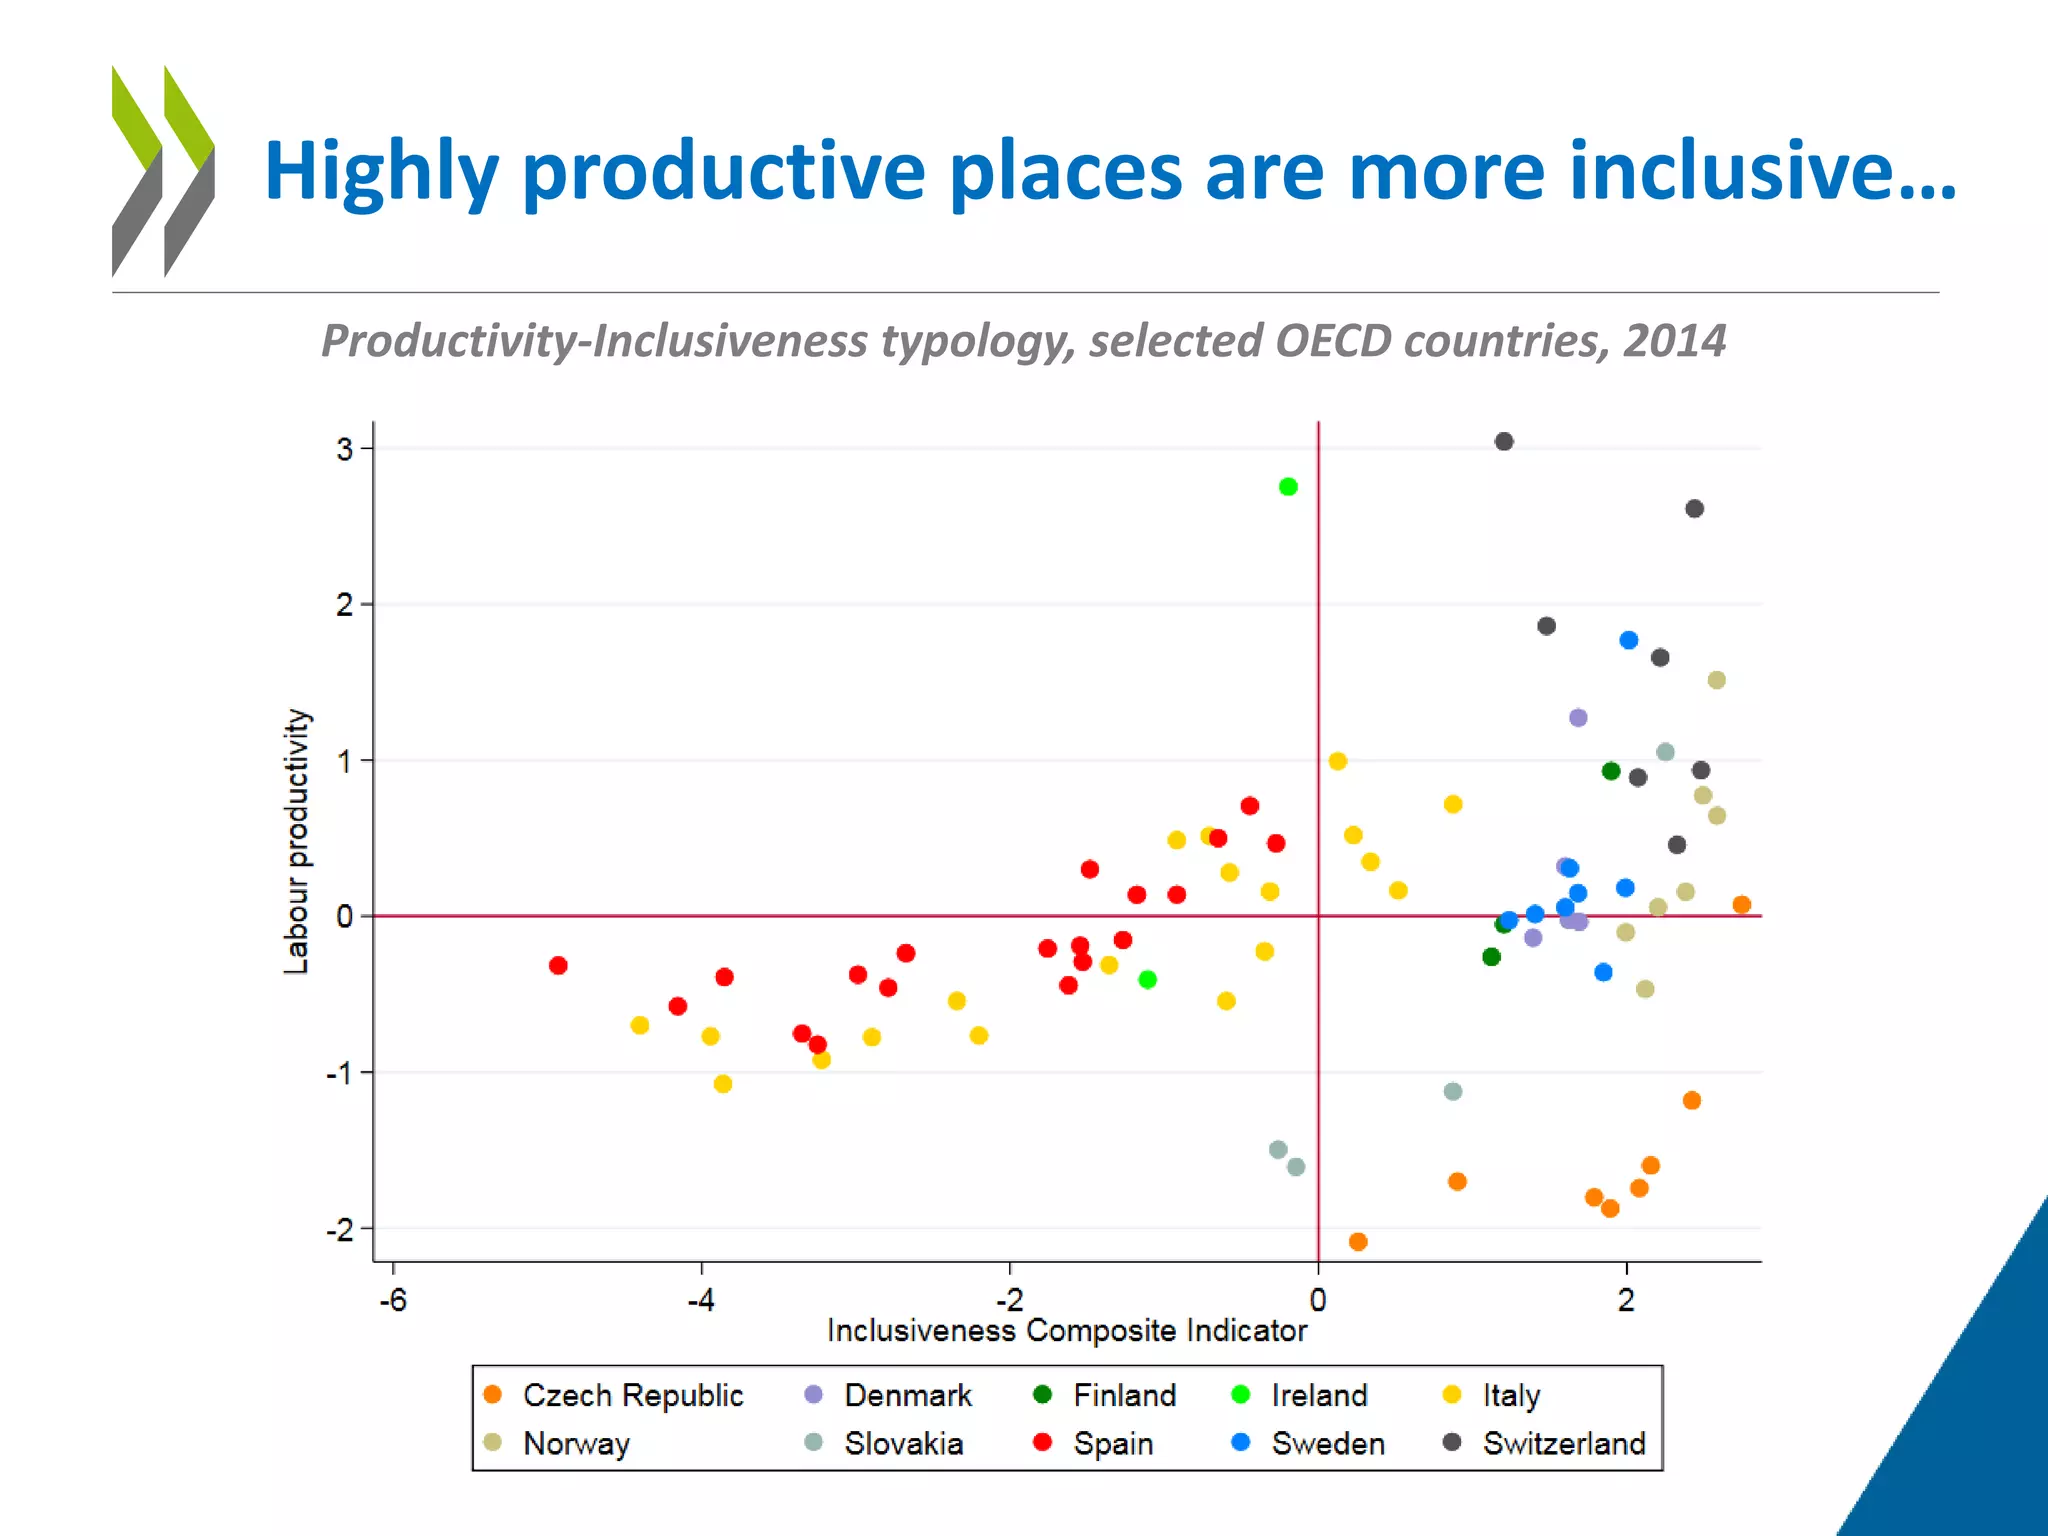
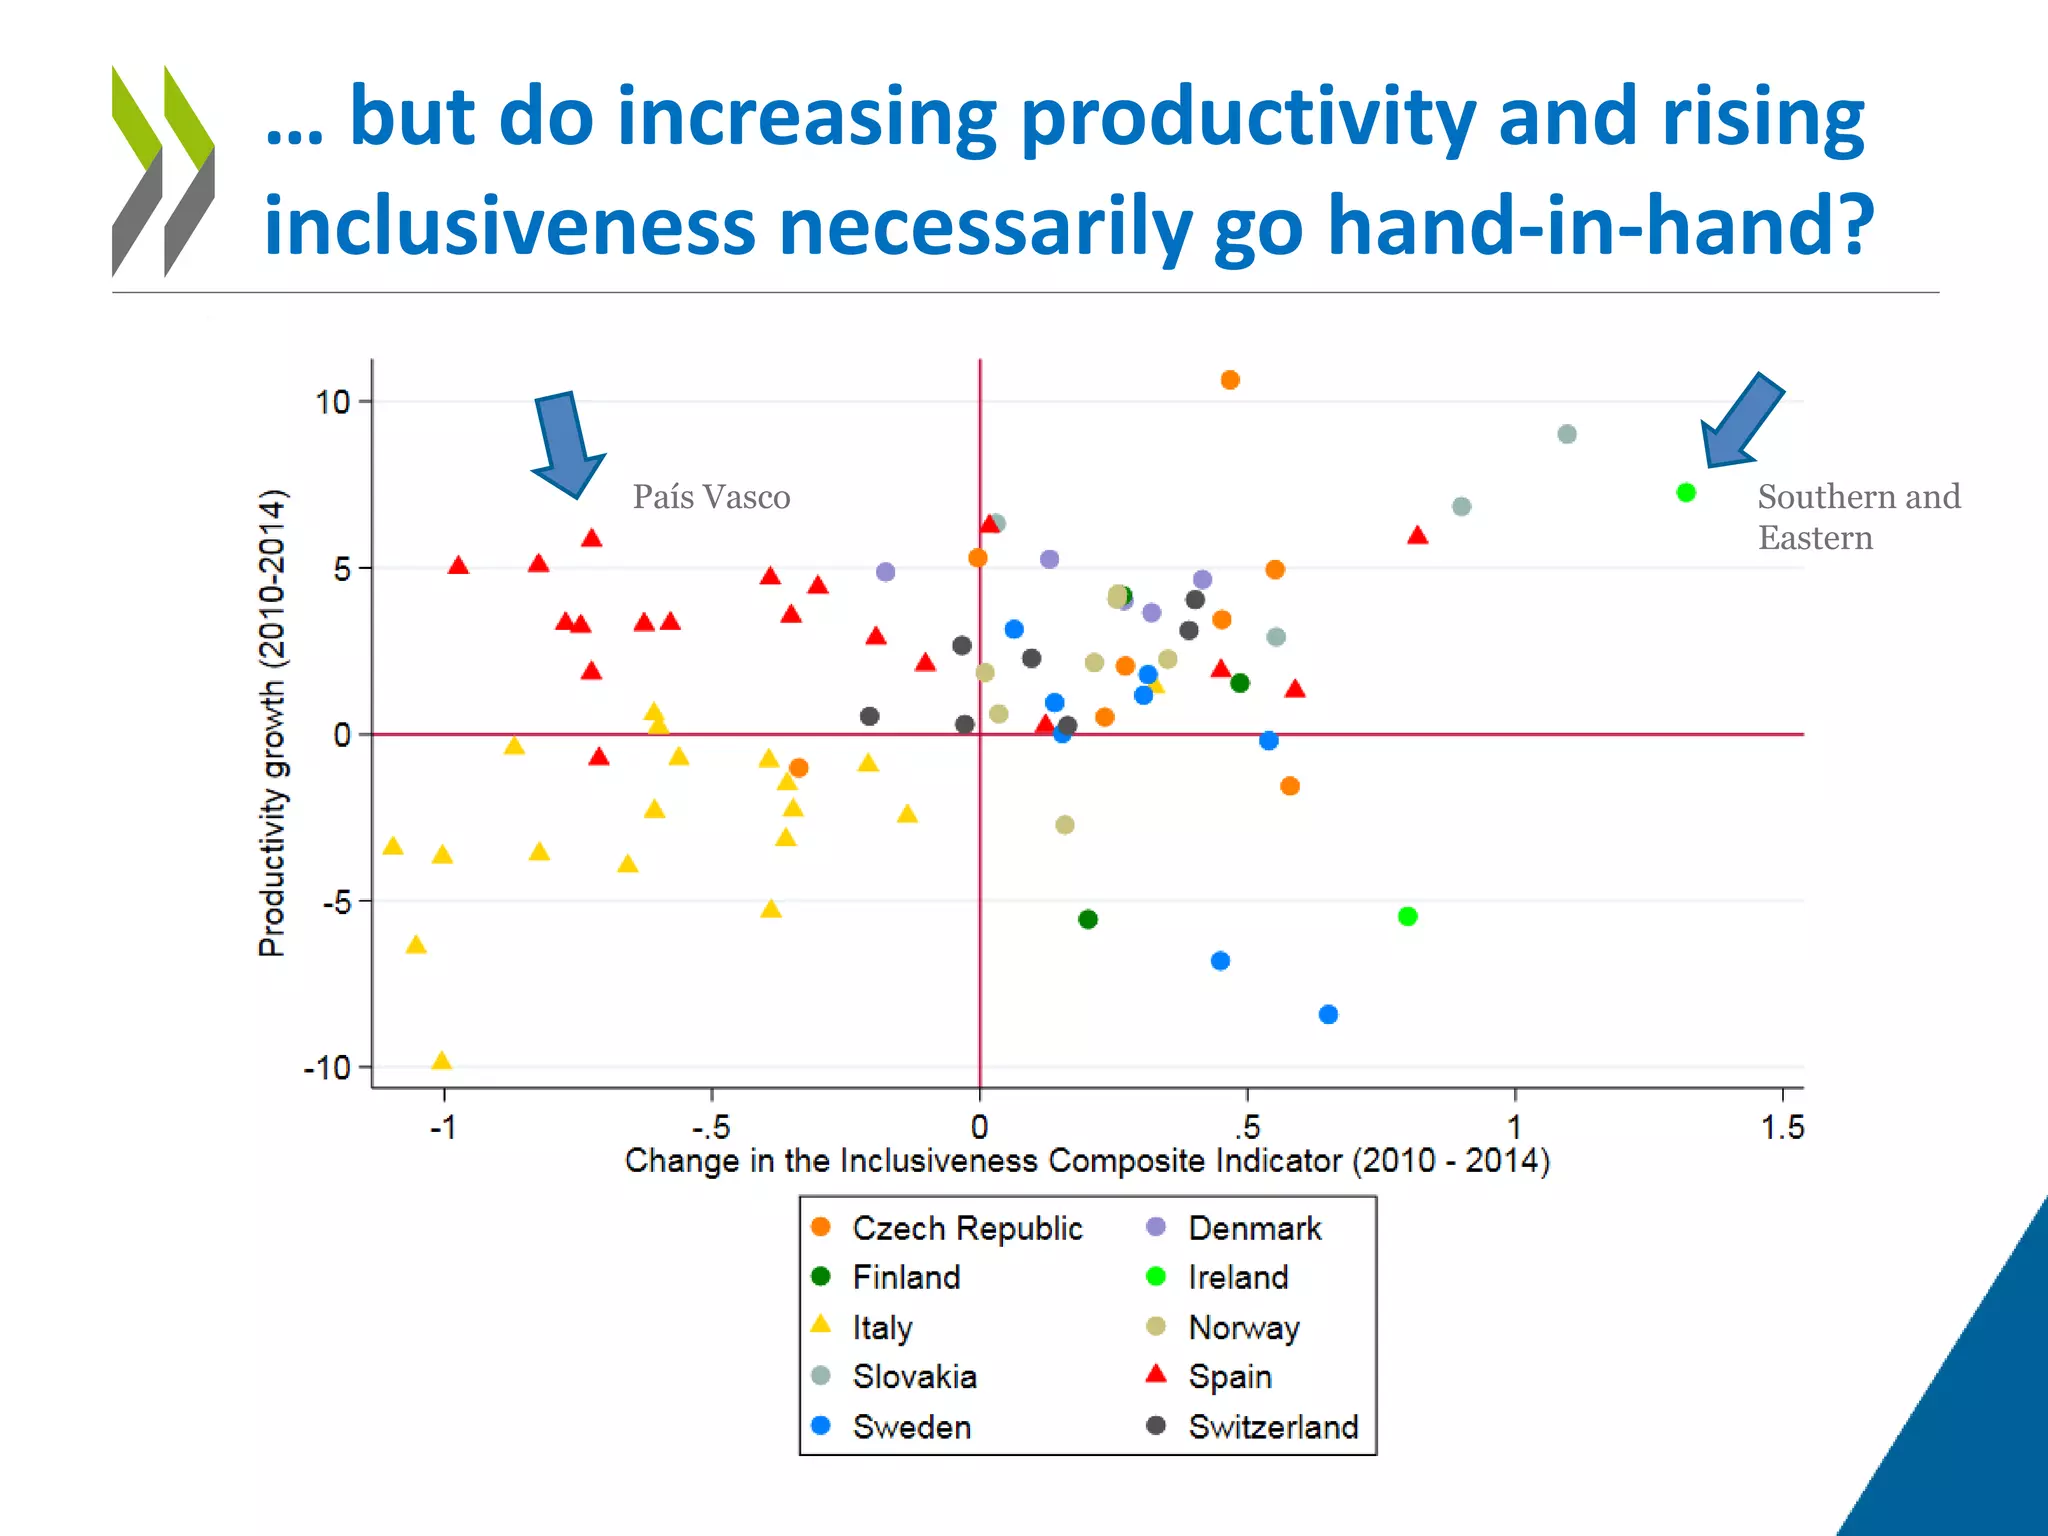
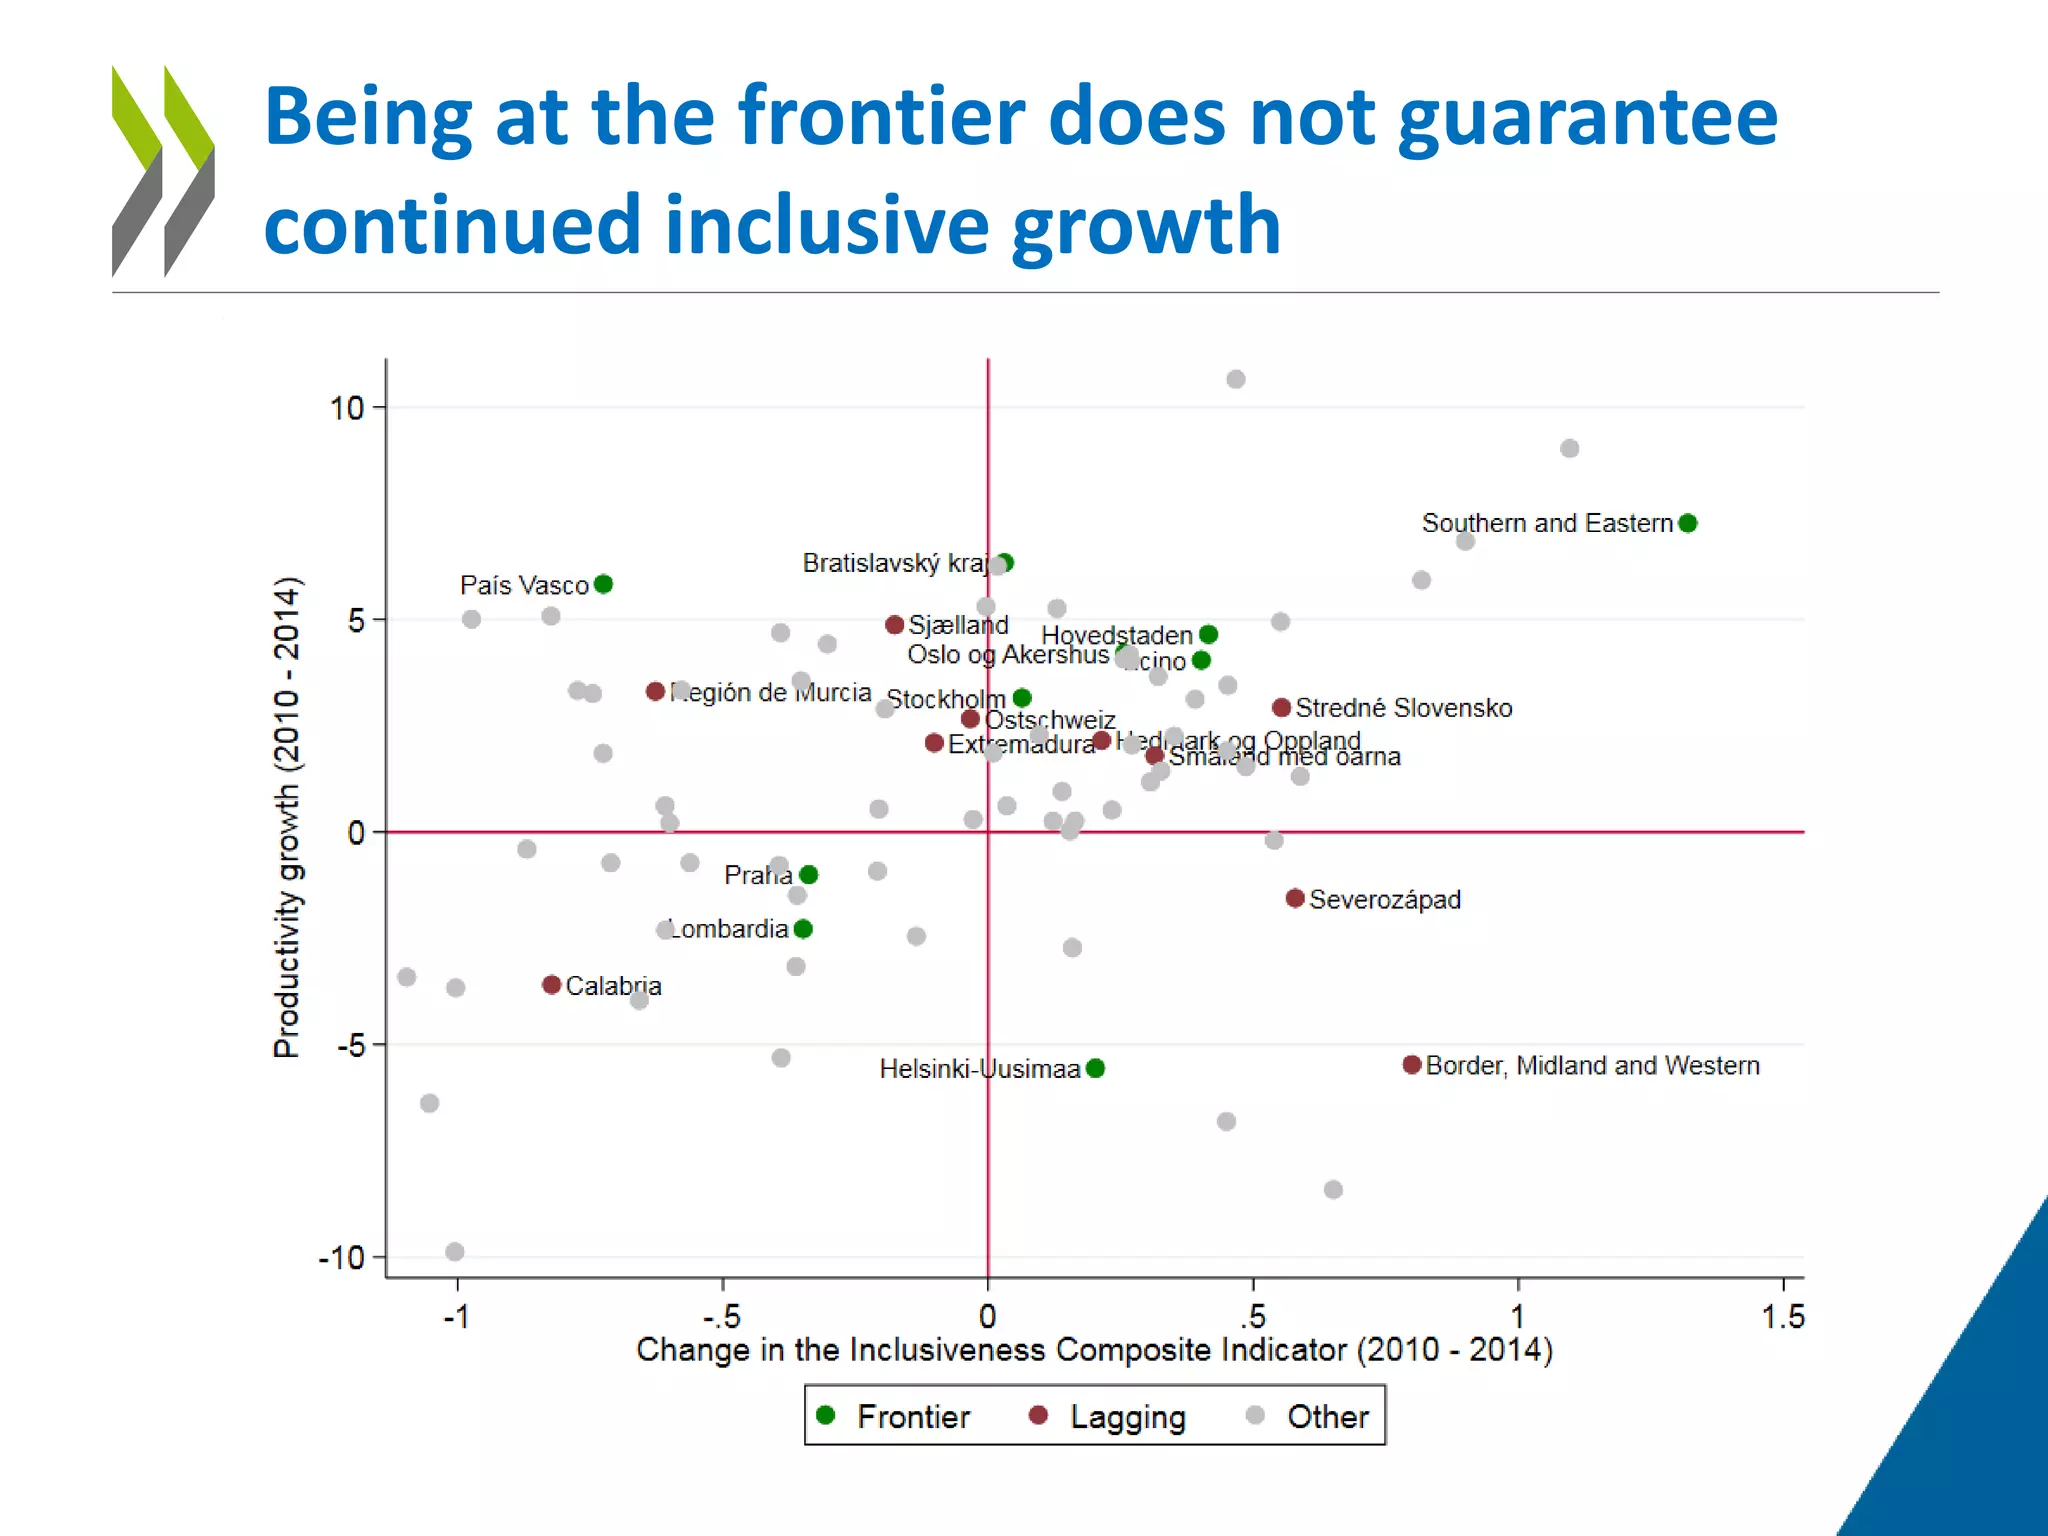
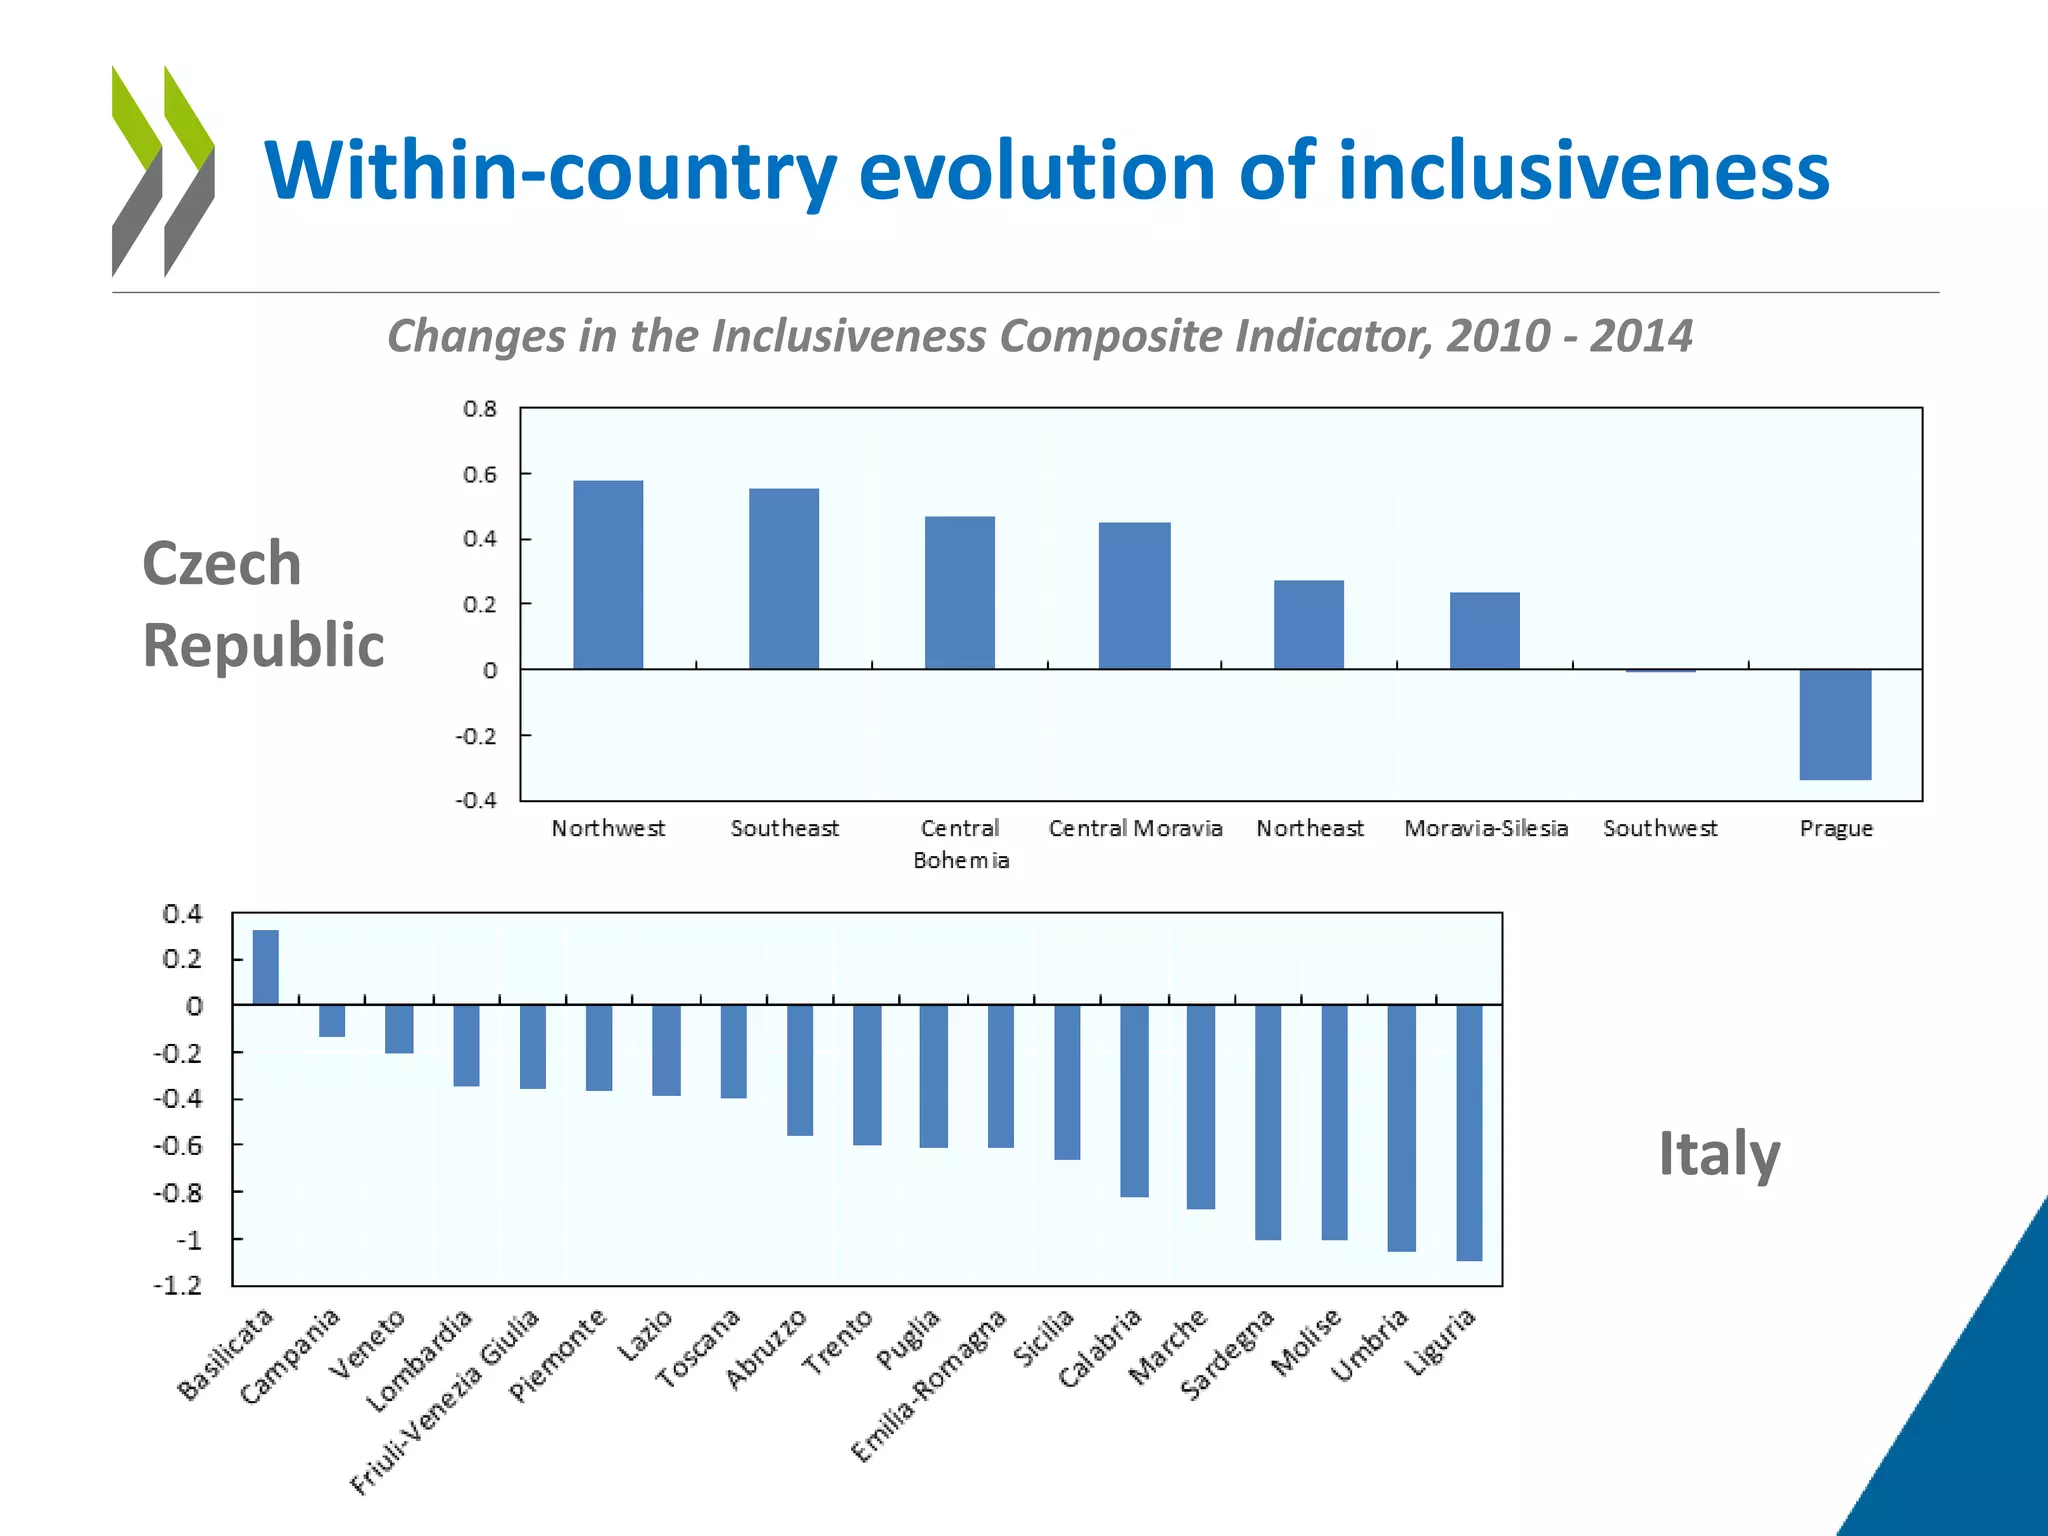
This document analyzes the relationship between productivity and inclusiveness at the local level. It explores challenges like slowing productivity growth and rising inequality. A typology is presented that categorizes regions based on their productivity and inclusiveness. An Inclusiveness Composite Indicator is used to measure and compare inclusiveness across regions in 12 countries. While highly productive regions tend to be more inclusive, increasing productivity does not always lead to greater inclusiveness. The analysis seeks to identify policies that can boost both productivity and inclusiveness.
1. ANALYSING THE LOCAL
DIMENSION OF PRODUCTIVITY
AND INCLUSIVENESS
Beatriz Jambrina Canseco, Organisation for Economic Co-
operation and Development (OECD)
2. Exploring the interaction between
productivity and inclusiveness
Challenges:
• Productivity
o productivity slowdown at the aggregate level
o average productivity masks large firm-level and regional differences
• Inclusiveness
o overall rise in inequality in income and well-being
o Large sub-national differences across local labour markets
Productivity-inclusiveness nexus at the local level
• What factors affect the interaction of productivity and inclusiveness?
• How to design policies that stimulate both productivity and inclusiveness?
4. How should we go about measuring
inclusiveness?
Methodology:
• Use Principal Component Analysis to:
o Capture a multidimensional issue
using a single indicator; and
o Identify the sources of differences
between regions
Progress:
• Expanding the number of countries: 12
countries
• Including a time dimension: 2010 - 2015
5. The Inclusiveness Composite Indicator (ICI)
1 2 POVERTY &
DEPRIVATION
At-risk-of-poverty rate
Several material
deprivation rate
Long-term
unemployment
NEET rate
2LABOUR
Unemployment
Low-work intensity
household
Youth unemployment
Percentage of labour
force with no secondary
education diploma
1 63% 17%
6. How did regions do in terms of inclusiveness
in 2015?
# Region Country
1 Prague Czech Republic
2 Central Bohemia Czech Republic
3 Oslo og Akershus Norway
4 Bratislava region Slovak Republic
5 Southwest Czech Republic
91 Canarias Spain
92 Campania Italy
93 Calabria Italy
94 Andalucía Spain
95 Sicilia Italy
(…)
Score variation:
• Between countries:
53.5%
• Within countries:
46.5%
7. Highly productive places are more inclusive…
Productivity-Inclusiveness typology, selected OECD countries, 2014
8. … but do increasing productivity and rising
inclusiveness necessarily go hand-in-hand?
Southern and
Eastern
País Vasco
9. Being at the frontier does not guarantee
continued inclusive growth
10. Next steps:
• Expand country coverage
• Investigate inclusiveness in catching-up regions
• Explore the sub-regional policy implications of the Nexus
• ‘Job Creation and Local Economic Development 2018’ will feature a
chapter on the Productivity-Inclusiveness nexus at the local level
Questions for discussion:
• What are the characteristics of places that manage to boost productivity
while increasing inclusiveness at the same time? What are some examples
from your country?
• Is a rise in productivity necessarily a harbinger of increasing inclusiveness?
Next steps and questions for discussion
11. Within-country evolution of inclusiveness
Italy
Czech
Republic
Changes in the Inclusiveness Composite Indicator, 2010 - 2014
Editor's Notes
Reminder of the diagram presented to the DC back in May.
What’s the ICI?
The ICI is a diagnostic instrument which served to visualize how different regions fare relative to each other in terms of inclusiveness.
It provides a way to measure regional differences both within the same country and across countries.
The focus of the indicator is on the most disadvantaged individuals in society (i.e. the bottom of the distribution). Therefore, it is not a measure of well-being.
How was it designed?
The ICI was designed using Principal Component Analysis. This technique groups the variables used in the analysis to form components in a way that is helpful to identify sources of differences between regions.
Countries: Czech Republic, Denmark, Finland, Ireland, Italy, Slovakia, Spain, Sweden, || Bulgaria, Romania, Norway and Switzerland (the last four are new to the analysis)
Years: 2010-2015
The Principal Component Analysis classifies the variables into two distinct groups or components (see this slide and next two for breakdown).
The first component is mainly driven by unemployment, youth employment, the percentage of people living in low work-intensity households (i.e. a household where the members of working age worked less than 20 % of their total potential during the previous year) and the percentage of the labour force that did not finish high school.
Given the type of variables included in this component, we have dubbed it ‘labour’. The component therefore summarizes how a region is doing in terms of inclusiveness in the labor market.
On its own, this component explains around 63% of the variance in the sample (depending on the year). This means that the first component accounts for 63% of the variation between the different 95 regions included in the sample. As a result, it has been given a proportionally higher weight in the construction of the ICI (around 77%).
The second component includes the following variables: at-risk-of-poverty rate, severe material deprivation, long-term unemployment and NEET rate. Because these variables link more with the idea of deprivation and being at the margins of society, we will from now on refer to this component as the ‘poverty & deprivation component’.
It accounts for around 17% of the variation between the different regions in the sample. Consequently, it has been assigned less weight than component 1 (about 23%).
In a nutshell, the difference in inclusiveness across regions depends mainly on the labour component (77%) and
BASED ON 12 COUNTRIES
Best and worst performing regions in the year 2015.
Prague is the best-performing region every year from 2010 to 2015. The rest of the top 5 changes from year to year but, in general, countries occupying the top positions are Switzerland, the Czech Republic, the Slovak Republic and Norway.
Although top and bottom performers consistently belong to the same set of countries, in reality variation depends both on differences between countries (53.5%) AND on variation within each country (46.5%). Therefore, while gaps between countries are important, policies targeting inclusiveness will also necessarily have to deal with region-specific factors This addresses the question of why countries seem to cluster together in the graph in slide 6. There is a clear advantage to doing this analysis at the regional level.
Positioning follows the same pattern as in the analysis presented to the DC back in May.
Year 2014
This graph shows the level of productivity vs. the level of inclusiveness of each of the regions in our sample.
In general terms, there is a positive relationship between productivity and inclusiveness. In a nutshell, more productive places tend to be more inclusive, although we do see large differences in inclusiveness between regions that have similar levels of productivity (and viceversa).
Therefore, the question remains: does this mean that increasing productivity will increase inclusiveness, or is there a trade-off between one and the other?
This graph shows the productivity growth rate between 2010-2014 on the Y axis and the change in the ICI over the same period. Looking at it, one can see two things:
Arguably, the best possible outcome would be to grow both in terms of productivity and inclusiveness. But it is quite clear that those places that managed to increase their productivity did not all succeed in generating inclusive growth.
What is then the difference between Southern and Eastern in Ireland and the Basque Country in Spain, for example? What drove their growth in productivity in a way that one managed to significantly increase its level of inclusiveness, while the other one saw its ICI drop instead?
Is it because of country-level policies, such as choices on welfare mechanisms? Or is it perhaps due to a region’s specific sectoral composition (reliance on employment in construction, manufacturing, etc.)?
These are the questions we will try to answer in the chapter of the Flagship on Productivity-Inclusiveness nexus at the sub-national level (the project?).
Note that the top-left quadrant is mainly Spain, while the bottom-left is mainly Italy.
2) How regions perform over time in terms of their growth in productivity and inclusiveness is independent of their initial position in terms of productivity (a.k.a. frontier or lagging regions).
Frontier region = In the top 10% of regions in a country in terms of productivity levels
Lagging region = In the bottom 10% of regions in a country in terms of productivity levels
Differences in movements for regions within the same country can be quite large.
Notice how the lagging region in ther Czech Republic is improving its performance in the ICI.
Italy’s situation after the crisis appears to be worsening rather than improving.