Download as PDF, PPTX


![23
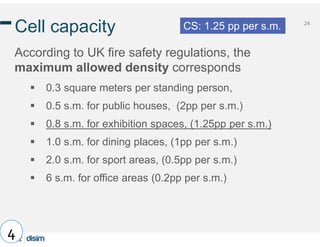
Door capacity
Door capacity = how many people «p» may pass
through a door of size «d», every second «s»
Daamen et al. [12] focuses on the relationship
between door capacity, user composition and stress
level
1.03 p/d/s - 3.23 p/d/s (d=1 meter)
resulting from a literature review
In our case, and since t = 5 seconds
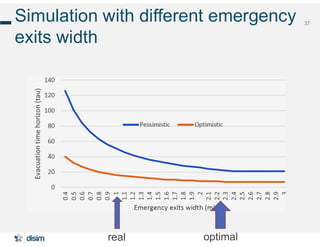
pessimistic – optimistic: 5 – 16 pp/d=1/s=5
3
CS: 5 – 16 pp/d=1/s=5](https://image.slidesharecdn.com/hicss2019muccini-190111190056/85/An-IoT-Software-Architecture-for-an-Evacuable-Building-Architecture-23-320.jpg)
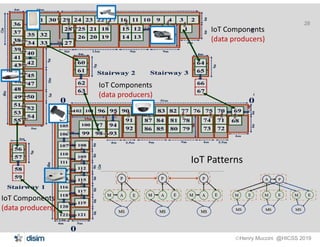

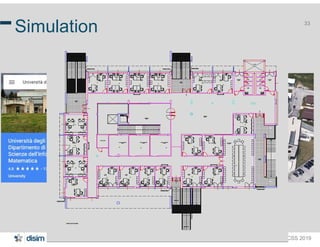
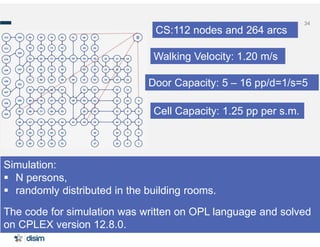
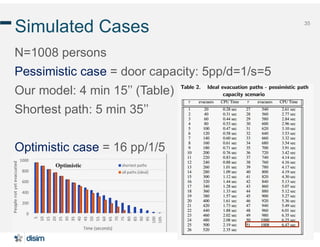
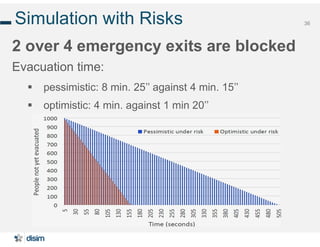


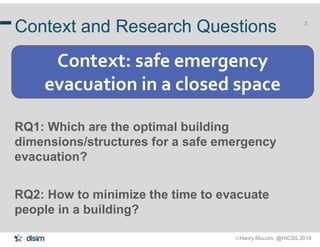
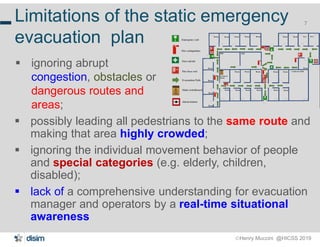
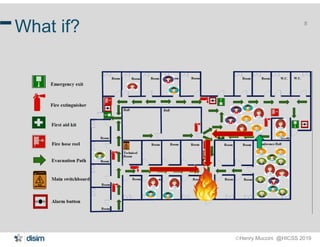
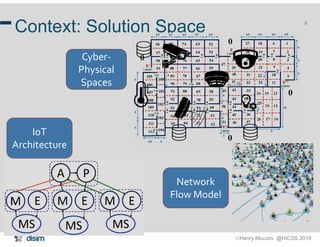
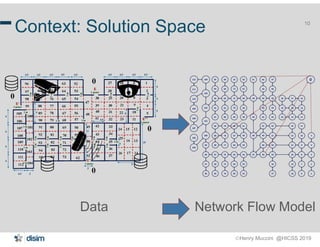
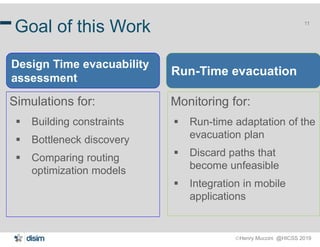
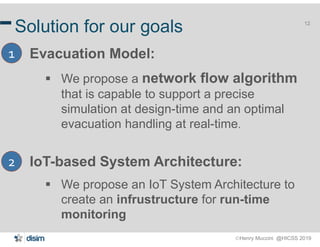
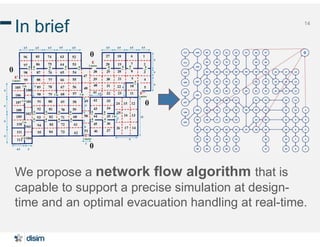
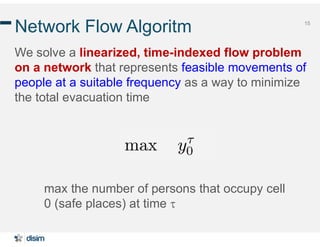
The document discusses an IoT software architecture aimed at improving emergency evacuations in buildings through an optimized network flow algorithm for real-time evacuation handling. It addresses research questions regarding optimal building dimensions for safety and minimizing evacuation time while highlighting the limitations of static evacuation plans. The proposed system focuses on simulations, real-time monitoring, and adapting evacuation strategies based on changing conditions.


