
Recommended
More Related Content
What's hot
What's hot (14)
Viewers also liked
Viewers also liked (20)
Similar to Amd Q206 Results
Similar to Amd Q206 Results (20)
More from earningsreport
More from earningsreport (20)
Recently uploaded
Recently uploaded (20)
Amd Q206 Results
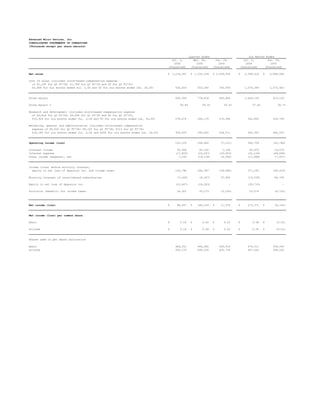
- 1. Advanced Micro Devices, Inc. CONSOLIDATED STATEMENTS OF OPERATIONS (Thousands except per share amounts) Quarter Ended Six Months Ended Jul. 2, Mar. 26, Jun. 26, Jul. 2, Jun. 26, 2006 2006 2005 2006 2005 (Unaudited) (Unaudited) (Unaudited) (Unaudited) (Unaudited) Net sales $ 1,216,367 $ 1,332,158 $ 1,259,918 $ 2,548,525 $ 2,486,546 Cost of sales (includes stock-based compensation expense of $2,200 for Q2 FY'06; $1,789 for Q1 FY'06 and $0 for Q2 FY'05; $3,989 for six months ended Jul. 2,06 and $0 for six months ended Jun. 26,05) 526,059 553,340 765,954 1,079,399 1,573,403 Gross margin 690,308 778,818 493,964 1,469,126 913,143 Gross margin % 56.8% 58.5% 39.2% 57.6% 36.7% Research and development (includes stock-based compensation expense of $6,834 for Q2 FY'06; $4,094 for Q1 FY'06 and $0 for Q2 FY'05; $10,928 for six months ended Jul. 2,06 and $0 for six months ended Jun. 26,05) 278,674 264,176 272,584 542,850 525,706 Marketing, general and administrative (includes stock-based compensation expense of $9,020 for Q2 FY'06; $9,162 for Q1 FY'06; $313 for Q2 FY'05; $18,182 for six months ended Jul. 2,06 and $456 for six months ended Jun. 26,05) 309,525 256,042 228,511 565,567 440,225 Operating income (loss) 102,109 258,600 (7,131) 360,709 (52,788) Interest income 35,308 28,162 7,194 63,470 14,079 Interest expense (17,859) (23,247) (25,653) (41,106) (49,898) Other income (expense), net 7,240 (19,128) (4,096) (11,888) (7,007) Income (loss) before minority interest, equity in net loss of Spansion Inc. and income taxes 126,798 244,387 (29,686) 371,185 (95,614) Minority interest of consolidated subsidiaries (7,183) (6,347) 37,905 (13,530) 84,758 Equity in net loss of Spansion Inc. (12,467) (18,243) - (30,710) - Provision (benefit) for income taxes 18,301 35,273 (3,100) 53,574 (4,752) Net income (loss) $ 88,847 $ 184,524 $ 11,319 $ 273,371 $ (6,104) Net income (loss) per common share Basic $ 0.18 $ 0.40 $ 0.03 $ 0.58 $ (0.02) Diluted $ 0.18 $ 0.38 $ 0.03 $ 0.55 $ (0.02) Shares used in per share calculation Basic 484,541 464,080 395,414 474,311 394,245 Diluted 500,176 495,326 405,739 497,542 394,245
- 2. Advanced Micro Devices, Inc. CONSOLIDATED BALANCE SHEETS (Thousands) Jul. 2, Mar. 26, Dec. 25, 2006 2006 2005* (Unaudited) (Unaudited) Assets Current assets: Cash, cash equivalents and short-term investments $ 2,530,062 $ 2,632,663 $ 1,794,766 Accounts receivable, net 571,539 819,963 805,531 Inventories 405,285 337,216 388,631 Prepaid expenses and other current assets 308,323 322,031 477,302 Deferred income taxes 90,323 104,980 92,606 Total current assets 3,905,532 4,216,853 3,558,836 Property, plant and equipment, net 3,163,181 2,874,887 2,701,000 Net investment in Spansion Inc. 686,984 700,329 721,342 Other assets 306,198 259,976 306,601 Total Assets $ 8,061,895 $ 8,052,045 $ 7,287,779 Liabilities and Stockholders' Equity Current liabilities: Accounts payable 706,454 847,178 855,834 Accrued compensation and benefits 161,547 258,791 226,874 Accrued liabilities 429,843 403,116 388,998 Income taxes payable 45,567 33,871 3,326 Deferred income on shipments to distributors 189,992 194,940 141,898 Current portion of long-term debt and capital lease obligations 45,139 42,408 43,224 Other current liabilities 175,947 168,220 161,807 Total current liabilities 1,754,489 1,948,524 1,821,961 Deferred income taxes 90,323 104,980 92,606 Long-term debt and capital lease obligations 647,109 615,874 1,327,065 Other long-term liabilities 450,289 428,074 459,322 Minority interest in consolidated subsidiaries 267,095 244,672 234,988 Stockholders' equity: Capital stock: Common stock, par value 4,854 4,832 4,355 Capital in excess of par value 3,921,786 3,869,620 2,710,168 Retained earnings 747,160 658,262 473,678 Accumulated other comprehensive income 178,790 177,207 163,636 Total stockholders' equity 4,852,590 4,709,921 3,351,837 Total Liabilities and Stockholders' Equity $ 8,061,895 $ 8,052,045 $ 7,287,779 *Derived from the December 25, 2005 audited financial statements of Advanced Micro Devices, Inc.
- 3. Advanced Micro Devices, Inc. SELECTED CORPORATE DATA (Unaudited) (Millions except headcount and percentages) Quarter Ended Six Months Ended Jul. 2, Mar. 26, Jun. 26, Jul. 2, Jun. 26, Segment Information (6) 2006 2006 2005 2006 2005 Computation Products (2) Net sales $ 1,172 $ 1,299 $ 767 $ 2,471 $ 1,517 Operating income 113 284 99 398 181 Embedded Products (3) Net sales 44 38 30 82 60 Operating loss (6) (11) (12) (17) (26) All Other (4) Net sales - (5) - (5) - Operating loss (5) (14) (4) (20) (8) Subtotal (excluding Memory Products segment) Net sales 1,216 1,332 797 2,548 1,577 Operating income 102 259 83 361 147 Memory Products (5) Net sales - - 462 - 910 Operating loss - - (90) - (199) Total AMD Net sales 1,216 1,332 1,260 2,548 2,487 Operating income (loss) 102 259 (7) 361 (53) Other Data (AMD excluding Memory Products segment) Gross margin % 56.8% 58.5% 58.0% 57.6% 55.4% Research and development expenses $ 279 $ 264 $ 199 $ 543 $ 382 Marketing, general and administrative expenses $ 310 $ 256 $ 181 $ 566 $ 345 Depreciation & amortization $ 193 $ 174 $ 174 $ 367 $ 361 Capital additions $ 455 $ 310 $ 232 $ 765 $ 682 Headcount 10,967 10,246 8,843 10,967 8,843 International sales % 70.2% 69.5% 68.6% 69.8% 69.5% EBITDA (1) $ 318 $ 417 $ 352 $ 735 $ 690 (1) RECONCILIATION OF NET INCOME (LOSS) TO EBITDA* Net income (loss) $ 89 $ 185 $ 11 $ 273 $ (6) Depreciation and amortization 193 174 318 367 651 Interest expense 18 23 26 41 50 Provision (benefit) for income taxes 18 35 (3) 54 (5) EBITDA $ 318 $ 417 $ 352 $ 735 $ 690 * Starting Q106, the Company defines EBITDA as net income (loss) adjusted for interest expense, tax, depreciation and amortization. Prior period information has been restated to conform to current period presentation. (2) Computation Products segment includes PC processors and Chipsets. (3) Embedded Products segment, formerly known as Personal Connectivity Solution Products, includes Embedded Processors and Products for global commercial and consumer markets. (4) The All Other category includes certain operating expenses and credits that are not allocated to the operating segments and, starting Q305, includes Personal Internet Communicator (PIC) products. (5) Memory Products segment included Flash memory products of AMD and Spansion. Spansion closed its IPO on Dec 21, 2005. Since that time, AMD uses the equity method of accounting to reflect its proportionate share of Spansion's net income (loss). (6) Starting Q405, the Company has allocated bonus and profit sharing expenses to the segments. Prior period information has been restated to conform to current period presentation. Note: Figures may not foot due to rounding