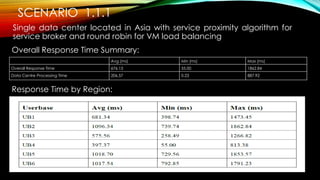
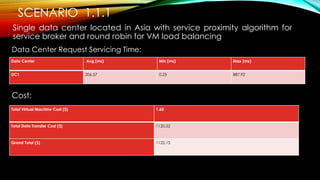
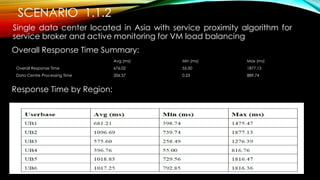
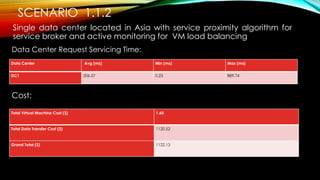
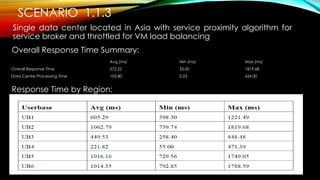
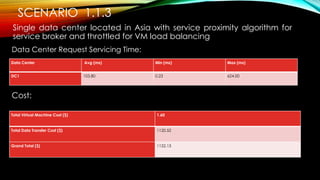
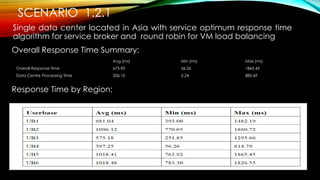
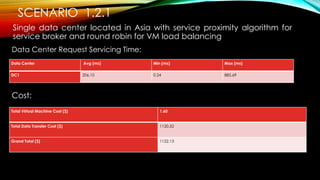
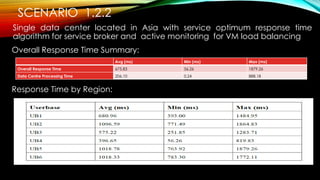
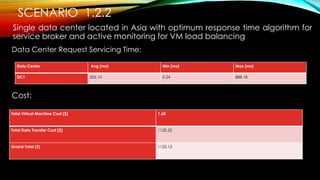
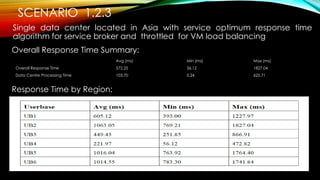
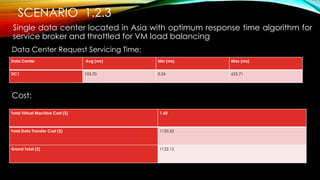
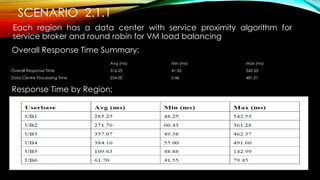
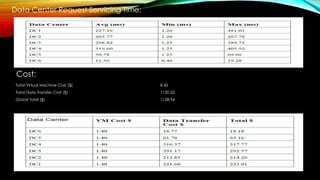
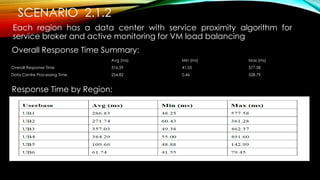
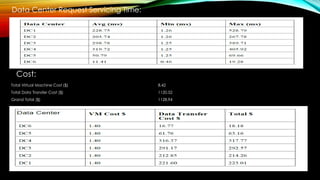
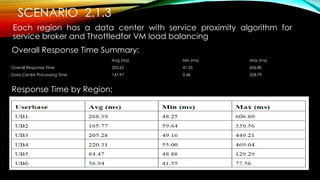
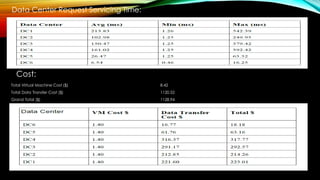
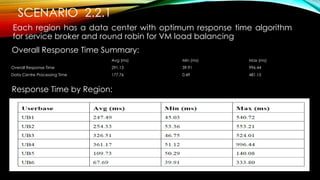
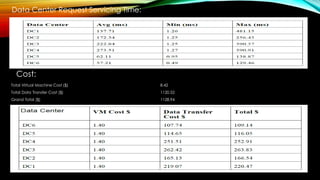
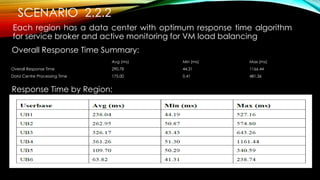
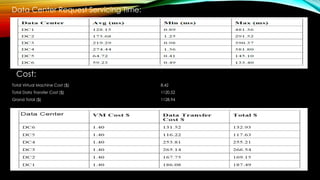
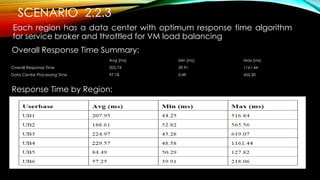
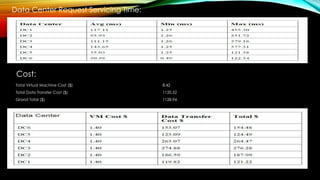
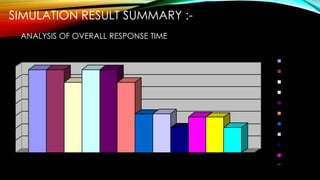
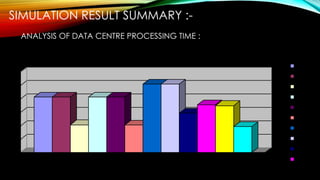
Call Girls In Model Towh Delhi 💯Call Us 🔝8264348440🔝
SIMULATION AND PERFORMANCE ANALYSIS OF A LARGE SCALED INTERNET APPLICATION (Facebook) ON CLOUD COMPUTING ENVIRONMENTS
1. SIMULATION AND PERFORMANCE ANALYSIS OF
A LARGE SCALED INTERNET APPLICATION
(Facebook)
ON CLOUD COMPUTING ENVIRONMENTS
2. CLOUD COMPPUTING
“…a style of computing in which dynamically scalable and often virtualized resources
are provided as a service over the Internet.”
Deployment Models:
• Public
• Private
• Community
• Hybrid
Delivery Models:
• IaaS
• PaaS
• SaaS
3. ABOUT THE PROJECT
In this project we introduce a novel tool, CloudAnalyst, along with a new approach to
simulate a large-scaled applications on the Cloud with the purpose of studying the
behavior of such applications under various deployment configurations. Such a study
would benefit the application designers greatly in identifying the optimal
configuration for their application. But more importantly such a study will generate
valuable insights in to designing Cloud infrastructure services in areas such as
coordination between Data Centers, load balancing algorithms andpossible value
added services such as Service Brokers to coordinate between Data Centers to
optimize the application performance and cost to the owners.
4. CLOUD ANALYST
The CloudAnalyst is built on top of CloudSim tool kit, by extending CloudSim
functionality with the introduction of concepts that model Internet and Internet
Application behaviors .
CloudSim toolkit covers most of the activities taking place within a Data Center in detail. This
includes:
• Simulating Data Center hardware definition in terms of physical machines composed of
processors, storage devices, memory and internal bandwidth
• Simulating virtual machine specification, creation and destruction
• The management of virtual machines, allocation of physical hardware resources for the
operation of virtual machines based on different policies (e.g. time-shared and space-
shared)
• Simulating the execution of user programs or requests (Cloudlet/Gridlet) on the virtual
machines
5. SIMULATION OUTPUT/WHAT IS BEING MEASURED
• Response time of the simulated application
• The usage patterns of the application
• The time taken by data centers to service a user request
• The cost of operation
7. TERMINOLOGY USED
• Region
• Internet
• Service Broker Request
• User Base
• Internet Cloudlet
• Data Center Controller
• VM Load Balancer
8. SERVICE BROKER ALGORITHM
• Service proximity based routing
• Performance based routing
• Dynamically Reconfigurable Routing
9. VM LOAD BALANCING ALGORITHM
• Round Robin
• Active Monitoring
• Throttled
10. SCENARIO 1.1.1
Single data center located in Asia with service proximity algorithm for
service broker and round robin for VM load balancing
Avg (ms) Min (ms) Max (ms)
Overall Response Time 676.13 55.00 1862.84
Data Centre Processing Time 206.57 0.23 887.92
Overall Response Time Summary:
Response Time by Region:
11. SCENARIO 1.1.1
Single data center located in Asia with service proximity algorithm for
service broker and round robin for VM load balancing
Data Center Request Servicing Time:
Cost:
Data Center Avg (ms) Min (ms) Max (ms)
DC1 206.57 0.23 887.92
Total Virtual Machine Cost ($) 1.60
Total Data Transfer Cost ($) 1120.52
Grand Total ($) 1122.13
12. SCENARIO 1.1.2
Single data center located in Asia with service proximity algorithm for
service broker and active monitoring for VM load balancing
Overall Response Time Summary:
Response Time by Region:
Avg (ms) Min (ms) Max (ms)
Overall Response Time 676.02 55.00 1877.13
Data Centre Processing Time 206.57 0.23 889.74
13. SCENARIO 1.1.2
Single data center located in Asia with service proximity algorithm for
service broker and active monitoring for VM load balancing
Data Center Request Servicing Time:
Cost:
Data Center Avg (ms) Min (ms) Max (ms)
DC1 206.57 0.23 889.74
Total Virtual Machine Cost ($) 1.60
Total Data Transfer Cost ($) 1120.52
Grand Total ($) 1122.13
14. SCENARIO 1.1.3
Single data center located in Asia with service proximity algorithm for
service broker and throttled for VM load balancing
Overall Response Time Summary:
Response Time by Region:
Avg (ms) Min (ms) Max (ms)
Overall Response Time 572.22 55.00 1819.68
Data Centre Processing Time 103.80 0.23 624.00
15. SCENARIO 1.1.3
Single data center located in Asia with service proximity algorithm for
service broker and throttled for VM load balancing
Data Center Request Servicing Time:
Cost:
Data Center Avg (ms) Min (ms) Max (ms)
DC1 103.80 0.23 624.00
Total Virtual Machine Cost ($) 1.60
Total Data Transfer Cost ($) 1120.52
Grand Total ($) 1122.13
16. SCENARIO 1.2.1
Single data center located in Asia with service optimum response time
algorithm for service broker and round robin for VM load balancing
Overall Response Time Summary:
Response Time by Region:
Avg (ms) Min (ms) Max (ms)
Overall Response Time 675.90 56.26 1865.45
Data Centre Processing Time 206.10 0.24 885.69
17. SCENARIO 1.2.1
Single data center located in Asia with service proximity algorithm for
service broker and round robin for VM load balancing
Data Center Request Servicing Time:
Cost:
Data Center Avg (ms) Min (ms) Max (ms)
DC1 206.10 0.24 885.69
Total Virtual Machine Cost ($) 1.60
Total Data Transfer Cost ($) 1120.52
Grand Total ($) 1122.13
18. SCENARIO 1.2.2
Single data center located in Asia with service optimum response time
algorithm for service broker and active monitoring for VM load balancing
Overall Response Time Summary:
Response Time by Region:
Avg (ms) Min (ms) Max (ms)
Overall Response Time 675.83 56.26 1879.26
Data Centre Processing Time 206.10 0.24 888.18
19. SCENARIO 1.2.2
Single data center located in Asia with optimum response time algorithm for
service broker and active monitoring for VM load balancing
Data Center Request Servicing Time:
Cost:
Data Center Avg (ms) Min (ms) Max (ms)
DC1 206.10 0.24 888.18
Total Virtual Machine Cost ($) 1.60
Total Data Transfer Cost ($) 1120.52
Grand Total ($) 1122.13
20. SCENARIO 1.2.3
Single data center located in Asia with service optimum response time
algorithm for service broker and throttled for VM load balancing
Overall Response Time Summary:
Response Time by Region:
Avg (ms) Min (ms) Max (ms)
Overall Response Time 572.25 56.12 1827.04
Data Centre Processing Time 103.70 0.24 625.71
21. SCENARIO 1.2.3
Single data center located in Asia with optimum response time algorithm for
service broker and throttled for VM load balancing
Data Center Request Servicing Time:
Cost:
Data Center Avg (ms) Min (ms) Max (ms)
DC1 103.70 0.24 625.71
Total Virtual Machine Cost ($) 1.60
Total Data Transfer Cost ($) 1120.52
Grand Total ($) 1122.13
22. SCENARIO 2.1.1
Each region has a data center with service proximity algorithm for
service broker and round robin for VM load balancing
Overall Response Time Summary:
Response Time by Region:
Avg (ms) Min (ms) Max (ms)
Overall Response Time 316.25 41.55 542.53
Data Centre Processing Time 254.00 0.46 481.01
23. Data Center Request Servicing Time:
Cost:
Total Virtual Machine Cost ($) 8.42
Total Data Transfer Cost ($) 1120.52
Grand Total ($) 1128.94
24. SCENARIO 2.1.2
Each region has a data center with service proximity algorithm for
service broker and active monitoring for VM load balancing
Overall Response Time Summary:
Response Time by Region:
Avg (ms) Min (ms) Max (ms)
Overall Response Time 316.59 41.55 577.58
Data Centre Processing Time 254.82 0.46 528.79
25. Data Center Request Servicing Time:
Cost:
Total Virtual Machine Cost ($) 8.42
Total Data Transfer Cost ($) 1120.52
Grand Total ($) 1128.94
26. SCENARIO 2.1.3
Each region has a data center with service proximity algorithm for
service broker and Throttledfor VM load balancing
Overall Response Time Summary:
Response Time by Region:
Avg (ms) Min (ms) Max (ms)
Overall Response Time 205.62 41.55 606.80
Data Centre Processing Time 147.97 0.46 528.79
27. Data Center Request Servicing Time:
Cost:
Total Virtual Machine Cost ($) 8.42
Total Data Transfer Cost ($) 1120.52
Grand Total ($) 1128.94
28. SCENARIO 2.2.1
Each region has a data center with optimum response time algorithm
for service broker and round robin for VM load balancing
Overall Response Time Summary:
Response Time by Region:
Avg (ms) Min (ms) Max (ms)
Overall Response Time 291.13 39.91 996.44
Data Centre Processing Time 177.76 0.49 481.15
29. Data Center Request Servicing Time:
Cost:
Total Virtual Machine Cost ($) 8.42
Total Data Transfer Cost ($) 1120.52
Grand Total ($) 1128.94
30. SCENARIO 2.2.2
Each region has a data center with optimum response time algorithm
for service broker and active monitoring for VM load balancing
Overall Response Time Summary:
Response Time by Region:
Avg (ms) Min (ms) Max (ms)
Overall Response Time 290.78 44.31 1166.44
Data Centre Processing Time 175.00 0.41 481.36
31. Data Center Request Servicing Time:
Cost:
Total Virtual Machine Cost ($) 8.42
Total Data Transfer Cost ($) 1120.52
Grand Total ($) 1128.94
32. SCENARIO 2.2.3
Each region has a data center with optimum response time algorithm
for service broker and throttled for VM load balancing
Overall Response Time Summary:
Response Time by Region:
Avg (ms) Min (ms) Max (ms)
Overall Response Time 205.74 39.91 1161.44
Data Centre Processing Time 97.18 0.49 455.30
33. Data Center Request Servicing Time:
Cost:
Total Virtual Machine Cost ($) 8.42
Total Data Transfer Cost ($) 1120.52
Grand Total ($) 1128.94
34. SIMULATION RESULT SUMMARY :-
ANALYSIS OF OVERALL RESPONSE TIME
0
100
200
300
400
500
600
700
5.2.1.1
5.2.1.2
5.2.1.3
5.2.2.1
5.2.2.2
5.2.2.3
5.3.1.1
5.3.1.2
5.3.1.3
5.3.2.1
5.3.2.2
5.3.2.3
35. SIMULATION RESULT SUMMARY :-
ANALYSIS OF DATA CENTRE PROCESSING TIME :
0
50
100
150
200
250
300
5.2.1.1
5.2.1.2
5.2.1.3
5.2.2.1
5.2.2.2
5.2.2.3
5.3.1.1
5.3.1.2
5.3.1.3
5.3.2.1
5.3.2.2