
Recommended
More Related Content
Viewers also liked
Viewers also liked (14)
Recently uploaded
Recently uploaded (20)
Ai report
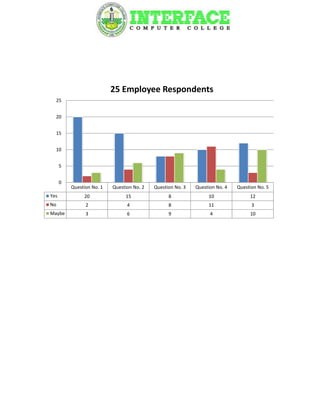
- 1. 25 Employee Respondents 25 20 15 10 5 0 Question No. 1 Question No. 2 Question No. 3 Question No. 4 Question No. 5 Yes 20 15 8 10 12 No 2 4 8 11 3 Maybe 3 6 9 4 10
- 2. Tally/Frequency percentage Question No. 1 Question No. 2 Question No. 3 Yes No Maybe Yes No Maybe Yes No Maybe 12% 24% 8% 36% 32% 16% 60% 80% 32% Question No. 4 Question No. 5 Yes No Maybe Yes No Maybe 16% 40% 40% 48% 44% 12%
- 3. 30 25 Client/Customer Respondents 25 20 15 10 5 0 Question No. 1 Question No. 2 Question No. 3 Question No. 4 Question No. 5 Yes 24 15 3 9 15 No 0 1 17 15 1 Maybe 1 9 5 1 9
- 4. Tally/Frequency percentage Question No. 1 Question No. 2 Question No. 3 Yes No Maybe Yes No Maybe Yes No Maybe 0% 11% 12% 20% 36% 60% 4% 89% 68% Question No. 4 Question No. 5 Yes No Maybe Yes No Maybe 4% 36% 36% 60% 60% 4%
- 5. 50 respondents (Employee and Client/Customer) 50 45 40 35 30 25 20 15 10 5 0 Question No. 1 Question No. 2 Question No. 3 Question No. 4 Question No. 5 Yes 44 30 11 19 27 No 2 5 25 26 4 Maybe 4 15 14 5 19
- 6. Tally/Frequency percentage Question No. 1 Question No. 2 Question No. 3 Yes No Maybe Yes No Maybe Yes No Maybe 4% 8% 22% 30% 28% 60% 10% 88% 50% Question No. 4 Question No. 5 Yes No Maybe Yes No Maybe 10% 38% 38% 54% 52% 8%
- 7. Formula: R=No. of respondent R=? N=No. of people N=100 e=Margin of error e=10 %( 0.1)
- 8. Formula: 50 respondents from Employee & Client/Customer QUESTION NO.1 Yes No Maybe Classes Tally/Frequency Degree p) f) Yes 44 88 316.8 No 2 4 14.4 Maybe 4 8 28.8 R= 50 respondent 100 =360
- 9. QUESTION NO.2 Yes No Maybe Classes Tally/Frequency Degree p) f) Yes 30 60 216 No 5 10 36 Maybe 15 30 108 R= 50 respondent 100 =360
- 10. QUESTION NO.3 Yes No Maybe Classes Tally/Frequency Degree p) f) Yes 11 22 79.2 No 25 50 180 Maybe 14 28 100.8 R= 50 respondent 100 =360
- 11. QUESTION NO.4 Yes No Maybe Classes Tally/Frequency Degree p) f) Yes 19 38 136.8 No 26 52 187.2 Maybe 5 10 36 R= 50 respondent 100 =360
- 12. QUESTION NO.5 Yes No Maybe Classes Tally/Frequency Degree p) f) Yes 27 54 194.4 No 4 8 28.8 Maybe 19 38 136.8 R= 50 respondent 100 =360
- 13. 25 respondents from Employee QUESTION NO.1 Yes No Maybe Classes Tally/Frequency Degree p) f) Yes 20 80 288 No 2 8 28.8 Maybe 3 12 43.2 R= 25 respondent 100 =360
- 14. QUESTION NO.2 Yes No Maybe Classes Tally/Frequency Degree p) f) Yes 15 60 216 No 4 16 57.6 Maybe 6 24 86.4 R= 25 respondent 100 =360
- 15. QUESTION NO.3 Yes No Maybe Classes Tally/Frequency Degree p) f) Yes 8 32 115.2 No 8 32 115.2 Maybe 9 36 129.6 R= 25 respondent 100 =360
- 16. QUESTION NO.4 Yes No Maybe Classes Tally/Frequency Degree p) f) Yes 10 40 144 No 11 44 158.4 Maybe 4 16 57.6 R= 25 respondent 100 =360
- 17. QUESTION NO.5 Yes No Maybe Classes Tally/Frequency Degree p) f) Yes 12 48 172.8 No 3 12 43.2 Maybe 10 40 144 R= 25 respondent 100 =360
- 18. 25 respondents from Client/Customer QUESTION NO.1 Yes No Maybe Classes Tally/Frequency Degree p) f) Yes No Maybe R= 25 respondent 100 =360
- 19. QUESTION NO.2 Yes No Maybe Classes Tally/Frequency Degree p) f) Yes No Maybe R= 25 respondent 100 =360
- 20. QUESTION NO.3 Yes No Maybe Classes Tally/Frequency Degree p) f) Yes 3 No 17 Maybe 5 R= 25 respondent 100 =360
- 21. QUESTION NO.4 Yes No Maybe Classes Tally/Frequency Degree p) f) Yes 9 No 15 Maybe 1 R= 25 respondent 100 =360
- 22. QUESTION NO.5 Yes No Maybe Classes Tally/Frequency Degree p) f) Yes 15 No 1 Maybe 9 R= 25 respondent 100 =360
- 23. Formula used: ITS= Individual Total Score A= Number of persons who mark Yes B= Number of persons who mark No C= Number of persons who mark Maybe X= Total number of respondents 50 respondents (Employee and Client/Customer) = 4.84 Yes = 4.5 Yes
- 24. = 3.72 No = 3.86 No = 4.46 Yes
- 25. 25 respondents (Employee) = 4.72 Yes = 4.44 Yes = 4.00 Yes
- 26. = 3.96 No = 4.36 Yes
- 27. 25 respondents (Client/Customer) = 4.96 Yes = 4.56 Yes = 3.44 No
- 28. = 3.76 No = 4.56 Yes Scale Table SCALE INTERPRETATION 5.00-4.00 Yes 3.99-2.51 No 2.50-1.00 Maybe