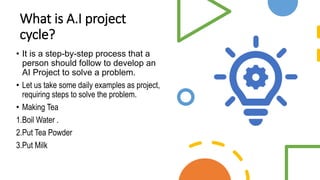
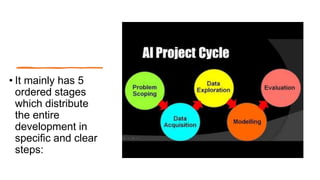
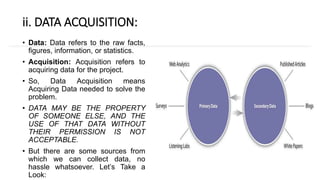
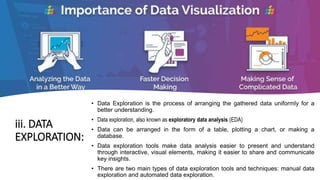
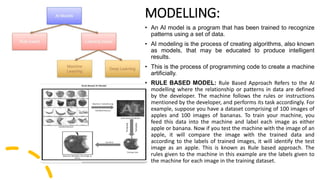
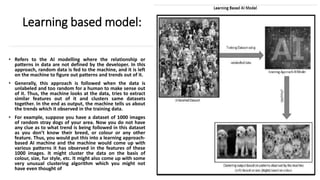
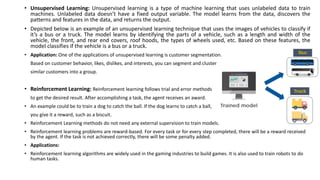
Learning Analytics Primer: Getting Started with Learning and Performance Anal...Watershed
Navigating the scope of disruptive analytics solutions to deliver maximum impact. Learn more about the importance of scalable learning in organizations that want to embrace an environment of continuous improvement. Mike Rustici provides a workshop on the five steps to get started with learning and performance analytics. Ranging from gathering your data using methods like experience API, to setting metrics and evaluating impact of learning programs.
Homeless assistance increasingly relies on data, performance measurement, and management information systems. This workshop will describe elementary concepts in data and performance management, as well as practical strategies for using data systems to support a performance-based homeless assistance system. This workshop is designed to prepare those inexperienced with data and performance measurement for the HEARTH Data and Performance Measurement workshop.
6.6 Family and Youth Program Measurement Simplified
Speaker: Iain DeJong
Effective homeless assistance systems rely on quality data and performance measurement. This workshop will describe simple steps to evaluate program outcomes as well as practical strategies for using data systems to support a performance-based homeless assistance system.
UX Field Research Toolkit - Updated for Big Design 2018Kelly Moran
Looking for practice with in-depth UXR fieldwork methods? You may have read about these techniques in the past, but methods must be practiced to be understood. projekt202 has been employing the experience research craft with great success since 2003. This workshop is your opportunity to try these tools of the trade in a structured environment without pressing deadlines or looming stakeholders. Our experienced research and design professionals will share industry tips and tricks that will help you put theory to practice.
The workshop will be hands-on and interactive; instructional elements will be reinforced with stories of impact to real projects. We will not only cover methods of gathering user data, but the importance of spending time internalizing and analyzing the data through activities such as affinity diagramming, persona building, and journey mapping. Participants will gain exposure to these important practices in a low-pressure atmosphere and with the guidance of experienced professionals.
This 21 slide presentation Needs Analysis is Module 2 of a nine (9) module online course for adult education policy makers and practitioners to complement an innovative toolkit to guide adult education policy and practice.
Participation in adult education varies significantly across states and regions of Europe! Why? Evidence and literature suggests a wide disparity in policy making, programming and implementation skills in the adult education sector across Europe. It is imperative that policy makers and programme managers address this disparity to foster life-long learning for a smart-sustainable Europe (see EU2020 https://ec.europa.eu/info/business-economy-euro/economic-and-fiscal-policy-coordination/eu-economic-governance-monitoring-prevention-correction/european-semester/framework/europe-2020-strategy_en) and to achieve a European target of 15% of the adult population engaged in learning.
In response to this challenge, the ERASMUS+ DIMA project (See https://dima-project.eu/index.php/en/, 2015 to 2017) developed a practical 9 module online course to complement an innovative toolkit to guide adult education policy and practice. The DIMA toolkit (See https://dima-project.eu/index.php/en/toolkit) introduces tools for developing, implementing, and monitoring adult education policies, strategies, and practices.
Author: Michael Kenny and DIMA Project partners (https://dima-project.eu/index.php/en/partners)
Storytelling with Data (Global Engagement Summit at Northwestern University 2...Sara Hooker
Delta Analytics facilitated a workshop aimed at nonprofits in the initial stages of data collection. This workshop was hosted at the 2017 Global Engagement Summit at Northwestern.
The goal of the workshop is to equip social impact organizations with the tools necessary to start telling their story using data. This workshop was led by Sara Hooker and Jonathan Wang.
Delta Analytics is a 501(c)3 nonprofit that collaborates with non-profits all over the to generate positive social impact through key data insights and management services. Driven by a passion for numbers and dedication to community engagement, we help public service organizations with all their data-driven needs. Our mission, quite simply, is data for change.
UX Field Research Toolkit - A Workshop at Big Design - 2017Kelly Moran
Workshop Description:
Looking for practice with in-depth user-experience research methods? You may have read about techniques in the past, but methods must be practiced to be understood. projekt202 has been employing these methodologies with great success since 2003. This workshop is your opportunity to try these tools in a structured environment without pressing deadlines or looming stakeholders. Our experienced research and design professionals will share industry tips and tricks that will help you put theory to practice.
The workshop will be hands-on and interactive; instructional elements will be reinforced with stories of impact to real projects. We will not only cover methods of gathering user data, but the importance of spending time internalizing and analyzing the data through activities such as affinity diagramming. Participants will gain exposure to these important practices in a low-pressure atmosphere and with the guidance of experienced professionals.
PROBLEMS ARE THE GOLDEN EGGS
problems??? day by day in our proffessional life we faces so many problems, but didn't recognize about the problem. Because we are habituate to facing to problems, if we want to solve the problems, first we can feel YES am facing a problem then you have a chance to solve it... after that we should find is it REPEATATIVE problem or New problem, on the bases of the issue we can take further steps, how to break it. how to analyse, how to find countermeasure, how to check is it suitable or not, how to make standard.... if you want to know gothrough my presentations..
This is my first presentation posted in Slideshare
Evaluating community projects
These guidelines were initially developed as part of the JRF Neighbourhood Programme. This programme is made up of 20 community or voluntary organisations all wanting to exercise a more strategic influence in their neighbourhood. The guidelines were originally written to help these organisations evaluate their work. They provide step-by-step advice on how to evaluate a community project which will be of interest to a wider audience.
What is evaluation?
Put simply, evaluation by members of a project or organisation will help people to learn from their day-to-day work. It can be used by a group of people, or by individuals working alone. It assesses the effectiveness of a piece of work, a project or a programme. It can also highlight whether your project is moving steadily and successfully towards achieving what it set out to do, or whether it is moving in a different direction. You can then celebrate and build on successes as well as learn from what has not worked so well.
Why evaluate?
Although evaluation may seem like an unnecessary additional task if you are already short of time and resources, it can save you both time and resources by keeping participants focused on, and working towards, the ultimate goal of the project. If necessary, it can refocus activity away from unproductive or unnecessary work.
The art of problem solving --> ensure you right the right business requiremen...Chris Lamoureux
This presentation was initially developed a couple of years ago and presented to the leadership team of a business banking area in a Global Financial Institution. It's focus was to give the practitioner some philosophical guidance on thinking through problems in the context of writing better business requirements. The goal here was to foster thinking about what problem you are solving for first before jumping into writing business requirements for project related activities
Threats to mobile devices are more prevalent and increasing in scope and complexity. Users of mobile devices desire to take full advantage of the features
available on those devices, but many of the features provide convenience and capability but sacrifice security. This best practices guide outlines steps the users can take to better protect personal devices and information.
A tale of scale & speed: How the US Navy is enabling software delivery from l...sonjaschweigert1
Rapid and secure feature delivery is a goal across every application team and every branch of the DoD. The Navy’s DevSecOps platform, Party Barge, has achieved:
- Reduction in onboarding time from 5 weeks to 1 day
- Improved developer experience and productivity through actionable findings and reduction of false positives
- Maintenance of superior security standards and inherent policy enforcement with Authorization to Operate (ATO)
Development teams can ship efficiently and ensure applications are cyber ready for Navy Authorizing Officials (AOs). In this webinar, Sigma Defense and Anchore will give attendees a look behind the scenes and demo secure pipeline automation and security artifacts that speed up application ATO and time to production.
We will cover:
- How to remove silos in DevSecOps
- How to build efficient development pipeline roles and component templates
- How to deliver security artifacts that matter for ATO’s (SBOMs, vulnerability reports, and policy evidence)
- How to streamline operations with automated policy checks on container images
zkStudyClub - Reef: Fast Succinct Non-Interactive Zero-Knowledge Regex ProofsAlex Pruden
This paper presents Reef, a system for generating publicly verifiable succinct non-interactive zero-knowledge proofs that a committed document matches or does not match a regular expression. We describe applications such as proving the strength of passwords, the provenance of email despite redactions, the validity of oblivious DNS queries, and the existence of mutations in DNA. Reef supports the Perl Compatible Regular Expression syntax, including wildcards, alternation, ranges, capture groups, Kleene star, negations, and lookarounds. Reef introduces a new type of automata, Skipping Alternating Finite Automata (SAFA), that skips irrelevant parts of a document when producing proofs without undermining soundness, and instantiates SAFA with a lookup argument. Our experimental evaluation confirms that Reef can generate proofs for documents with 32M characters; the proofs are small and cheap to verify (under a second).
Paper: https://eprint.iacr.org/2023/1886
How to Get CNIC Information System with Paksim Ga.pptxdanishmna97
Pakdata Cf is a groundbreaking system designed to streamline and facilitate access to CNIC information. This innovative platform leverages advanced technology to provide users with efficient and secure access to their CNIC details.
Securing your Kubernetes cluster_ a step-by-step guide to success !KatiaHIMEUR1
Today, after several years of existence, an extremely active community and an ultra-dynamic ecosystem, Kubernetes has established itself as the de facto standard in container orchestration. Thanks to a wide range of managed services, it has never been so easy to set up a ready-to-use Kubernetes cluster.
However, this ease of use means that the subject of security in Kubernetes is often left for later, or even neglected. This exposes companies to significant risks.
In this talk, I'll show you step-by-step how to secure your Kubernetes cluster for greater peace of mind and reliability.
Maruthi Prithivirajan, Head of ASEAN & IN Solution Architecture, Neo4j
Get an inside look at the latest Neo4j innovations that enable relationship-driven intelligence at scale. Learn more about the newest cloud integrations and product enhancements that make Neo4j an essential choice for developers building apps with interconnected data and generative AI.
Generative AI Deep Dive: Advancing from Proof of Concept to ProductionAggregage
Join Maher Hanafi, VP of Engineering at Betterworks, in this new session where he'll share a practical framework to transform Gen AI prototypes into impactful products! He'll delve into the complexities of data collection and management, model selection and optimization, and ensuring security, scalability, and responsible use.
UiPath Test Automation using UiPath Test Suite series, part 6DianaGray10
Welcome to UiPath Test Automation using UiPath Test Suite series part 6. In this session, we will cover Test Automation with generative AI and Open AI.
UiPath Test Automation with generative AI and Open AI webinar offers an in-depth exploration of leveraging cutting-edge technologies for test automation within the UiPath platform. Attendees will delve into the integration of generative AI, a test automation solution, with Open AI advanced natural language processing capabilities.
Throughout the session, participants will discover how this synergy empowers testers to automate repetitive tasks, enhance testing accuracy, and expedite the software testing life cycle. Topics covered include the seamless integration process, practical use cases, and the benefits of harnessing AI-driven automation for UiPath testing initiatives. By attending this webinar, testers, and automation professionals can gain valuable insights into harnessing the power of AI to optimize their test automation workflows within the UiPath ecosystem, ultimately driving efficiency and quality in software development processes.
What will you get from this session?
1. Insights into integrating generative AI.
2. Understanding how this integration enhances test automation within the UiPath platform
3. Practical demonstrations
4. Exploration of real-world use cases illustrating the benefits of AI-driven test automation for UiPath
Topics covered:
What is generative AI
Test Automation with generative AI and Open AI.
UiPath integration with generative AI
Speaker:
Deepak Rai, Automation Practice Lead, Boundaryless Group and UiPath MVP
Unlocking Productivity: Leveraging the Potential of Copilot in Microsoft 365, a presentation by Christoforos Vlachos, Senior Solutions Manager – Modern Workplace, Uni Systems
GraphSummit Singapore | The Future of Agility: Supercharging Digital Transfor...Neo4j
Leonard Jayamohan, Partner & Generative AI Lead, Deloitte
This keynote will reveal how Deloitte leverages Neo4j’s graph power for groundbreaking digital twin solutions, achieving a staggering 100x performance boost. Discover the essential role knowledge graphs play in successful generative AI implementations. Plus, get an exclusive look at an innovative Neo4j + Generative AI solution Deloitte is developing in-house.
GDG Cloud Southlake #33: Boule & Rebala: Effective AppSec in SDLC using Deplo...James Anderson
Effective Application Security in Software Delivery lifecycle using Deployment Firewall and DBOM
The modern software delivery process (or the CI/CD process) includes many tools, distributed teams, open-source code, and cloud platforms. Constant focus on speed to release software to market, along with the traditional slow and manual security checks has caused gaps in continuous security as an important piece in the software supply chain. Today organizations feel more susceptible to external and internal cyber threats due to the vast attack surface in their applications supply chain and the lack of end-to-end governance and risk management.
The software team must secure its software delivery process to avoid vulnerability and security breaches. This needs to be achieved with existing tool chains and without extensive rework of the delivery processes. This talk will present strategies and techniques for providing visibility into the true risk of the existing vulnerabilities, preventing the introduction of security issues in the software, resolving vulnerabilities in production environments quickly, and capturing the deployment bill of materials (DBOM).
Speakers:
Bob Boule
Robert Boule is a technology enthusiast with PASSION for technology and making things work along with a knack for helping others understand how things work. He comes with around 20 years of solution engineering experience in application security, software continuous delivery, and SaaS platforms. He is known for his dynamic presentations in CI/CD and application security integrated in software delivery lifecycle.
Gopinath Rebala
Gopinath Rebala is the CTO of OpsMx, where he has overall responsibility for the machine learning and data processing architectures for Secure Software Delivery. Gopi also has a strong connection with our customers, leading design and architecture for strategic implementations. Gopi is a frequent speaker and well-known leader in continuous delivery and integrating security into software delivery.
Communications Mining Series - Zero to Hero - Session 1DianaGray10
This session provides introduction to UiPath Communication Mining, importance and platform overview. You will acquire a good understand of the phases in Communication Mining as we go over the platform with you. Topics covered:
• Communication Mining Overview
• Why is it important?
• How can it help today’s business and the benefits
• Phases in Communication Mining
• Demo on Platform overview
• Q/A
Dr. Sean Tan, Head of Data Science, Changi Airport Group
Discover how Changi Airport Group (CAG) leverages graph technologies and generative AI to revolutionize their search capabilities. This session delves into the unique search needs of CAG’s diverse passengers and customers, showcasing how graph data structures enhance the accuracy and relevance of AI-generated search results, mitigating the risk of “hallucinations” and improving the overall customer journey.
2. What is A.I project
cycle?
• It is a step-by-step process that a
person should follow to develop an
AI Project to solve a problem.
• Let us take some daily examples as project,
requiring steps to solve the problem.
• Making Tea
1.Boil Water .
2.Put Tea Powder
3.Put Milk
3. • It mainly has 5
ordered stages
which distribute
the entire
development in
specific and clear
steps:
4. • PROBLEM SCOPING:
• Identifying a problem and having a vision to solve it, is called Problem Scoping. Scoping a problem is not that easy as
we need to have a deeper understanding so that the picture becomes clearer while we are working to solve it.
• Problem scoping is the process by which student designers “figure out” the problem that they need to solve. Students identify
the key elements or factors to which they need to attend, and also consider the context of the problem.
• DATA ACQUISITION:
• Data Acquisition is the process of collecting accurate and reliable data to work with. Data acquisition is the second step in the
project cycle, we should ensure the data collected is collected from authentic and reliable sources for effective Decision Making.
• It is the process of digitizing data from the world around us so it can be displayed, analyzed, and stored in a computer.
• DATA EXPLORATION:
• Data exploration is the first step of data analysis used to explore and visualize data to uncover insights from the start or
identify areas or patterns to dig into more. Data exploration is a critical step in Artificial Intelligence and Machine
Learning. With data exploration, analysts attempt to find patterns and details in large pools of data.
• MODELLING:
• Modelling is the fourth stage of the AI Project Cycle, which deals with creating models from the data. Modelling is the
process in which different models based on the visualized data can be created and even checked for the advantages
and disadvantages of the model.
• EVALUATION:
• Evaluation is the last stage of the AI project cycle123. It is the process of understanding the reliability and performance of
an AI model45. After a model has been created and trained, it must be thoroughly tested to determine its efficiency and
performance2. Evaluation is done by checking the performance of the AI model against testing data with the correct
outcome5
5.
6.
7.
8. Ques: Now, it’s your turn to describe
what you have learnt. Explain the
concept of AI project cycle with the
help of a suitable example.
9. i. Problem
Scoping:
• Problem Scoping is the first stage of the AI project cycle. In this
stage of AI development, problems will be identified.
• In AI project cycle everything will be failed if problem scoping is
failed or without appropriate problem scoping. Incorrect
problem scoping also leads to failure of the project as well.
The 4Ws of Problem Scoping:
The 4Ws are very helpful in problem scoping. They are:
1.Who? – Refers that who is facing a problem and who are the
stakeholders of the problem
2.What? – Refers to what is the problem and how you know
about the problem
3.Where? – It is related to the context or situation or location of
the problem
4.Why? – Refers to why we need to solve the problem and what
are the benefits to the stakeholders after solving the problem
• The outcome of problem scoping in ai is the problem
statement template.
10. The
problem
statement
template
• When the above 4Ws are completely filled you need to
prepare a summary of these 4Ws. This summary is known
as the problem statement template. This template
explains all the key points in a single template. So, if the
same problem arises in the future this statement helps to
resolve it easily.
• Who?
• The “Who” block helps you in analyzing the people getting
affected directly or indirectly due to it. Under this, you find out
who the ‘Stakeholders’ to this problem are and what you know
about them. Stakeholders are the people who face this
problem and would be benefitted with the solution. Let us fill
the “Who” canvas:
• Who are the stakeholders?
• What do you know about them?
11. • What?
• Under the “What” block, you need to look into what you have on hand. At this stage, you need to determine the nature of the problem.
What is the problem and how do you know that it is a problem? Under this block, you also gather evidence to prove that the problem
you have selected actually exists. Newspaper articles, Media, announcements, etc. are some examples.
• What is the problem?
• How do you know that it is a problem?
• Where?
• Now that you know who is associated with the problem and what the problem actually is; you need to focus on the
context/situation/location of the problem. This block will help you look into the situation in which the problem arises, the context of it,
and the locations where it is prominent.
• Let us fill the “Where” canvas!
• What is the context/ situation the stakeholders experience the problem?
• Where is the problem located?
• Why?
• You have finally listed down all the major elements that affect the problem directly. Now it is convenient to understand who the people
that would be benefitted by the solution are; what is to be solved; and where will the solution be deployed. These three canvases now
become the base of why you want to solve this problem. Thus, in the “Why” canvas, think about the benefits which the stakeholders
would get from the solution and how would it benefit them as well as the society.
• Let us fill the “Why” canvas!
• Why will this solution be of value to the stakeholders?
• How will the solution improve their situation?
12. Who Stakeholders
Farmers, Fertilizer Producers,
Labours, Tractor Companies
What The problem, Issue, Need
Determine what will a good
time for seeding or crop
harvesting?
When Context/Situation
Decide the mature age for the
crop and determine its time
Ideal Solution Benefits
Take the crop on time and
supply against market demand
on time
Suppose we have selected the theme
of Agriculture
13. ii. DATA ACQUISITION:
• Data: Data refers to the raw facts,
figures, information, or statistics.
• Acquisition: Acquisition refers to
acquiring data for the project.
• So, Data Acquisition means
Acquiring Data needed to solve the
problem.
• DATA MAY BE THE PROPERTY
OF SOMEONE ELSE, AND THE
USE OF THAT DATA WITHOUT
THEIR PERMISSION IS NOT
ACCEPTABLE.
• But there are some sources from
which we can collect data, no
hassle whatsoever. Let’s Take a
Look:
14. Types of data:
• Primary Data: Primary data is the
kind of data that is collected
directly from the data source. It is
real time data and is mostly
collected when needed and not
stored.
• Secondary Data: Secondary data
is the data that has been collected
in the past by someone else and
made available for others to use.
Secondary data is usually easily
accessible to researchers and
individuals because they are
15. • Data can be a piece of information or
facts and statistics collected together
for reference or analysis.
• Whenever we want an AI project to
be able to predict an output, we
need to train it first using data.
• For example, If you want to make an
Artificially Intelligent system which
can predict the salary of any
employee based on his previous
salaries, you would feed the data of
his previous salaries into the
machine. This is the data with which
the machine can be trained. Now,
once it is ready, it will predict his next
salary efficiently. The previous salary
data here is known as Training Data
while the next salary prediction data
set is known as the Testing Data.
16. • For better efficiency of an AI project,
the Training data needs to be relevant
and authentic.
• In the previous example, if the training
data was not of the previous salaries
but of his expenses, the machine would
not have predicted his next salary
correctly since the whole training went
wrong.
• Similarly, if the previous salary data was
not authentic, that is, it was not correct,
then too the prediction could have gone
wrong.
• Hence…. For any AI project to be
efficient, the training data should be
authentic and relevant to the problem
statement scoped.
17. • There could be various ways in which you collect data.
• Sometimes, you use the internet and try to acquire data for your project
from some random websites. Such data might not be authentic as its
accuracy cannot be proved. Due to this, it becomes necessary to find a
reliable source of data from where some authentic information can be
taken. At the same time, we should keep in mind that the data which we
collect is open-sourced and not someone’s property. Extracting private
data can be an offence. One of the most reliable and authentic sources of
information, are the open-sourced websites hosted by the government.
These government portals have general information collected in suitable
format which can be downloaded and used wisely. Some of the open-
sourced Govt. portals are: data.gov.in, india.gov.in
19. iii. DATA
EXPLORATION:
• Data Exploration is the process of arranging the gathered data uniformly for a
better understanding.
• Data exploration, also known as exploratory data analysis (EDA)
• Data can be arranged in the form of a table, plotting a chart, or making a
database.
• Data exploration tools make data analysis easier to present and understand
through interactive, visual elements, making it easier to share and communicate
key insights.
• There are two main types of data exploration tools and techniques: manual data
exploration and automated data exploration.
20. • Line Chart: Line charts are resoundingly popular for a range of business use cases
because they demonstrate an overall trend swiftly and concisely, in a way that’s
hard to misinterpret. In particular, they’re good for depicting trends for different
categories over the same period of time, to aid comparison.
• Bar & Column chart: Both the Bar and the Column charts display data using
rectangular bars where the length of the bar is proportional to the data value. Both
charts compare two or more values. However, the difference lies in their
orientation. A bar chart is oriented horizontally, whereas a column chart is oriented
vertically.
21. • Pie charts: A pie chart is a type of a chart that
visually displays data in a circular graph. Pie
charts can be helpful for showing the
relationship of parts to the whole when there
are a small number of levels.
• Tables: Tables are used to organize data that
is too detailed or complicated to be described
adequately in the text, allowing the reader to
quickly see the results.
• Infographics: An infographic example is a
visual representation of information.
Infographics examples include a variety of
elements, such as images, icons, text, charts,
and diagrams to convey messages at a
glance.
22. MODELLING:
• An AI model is a program that has been trained to recognize
patterns using a set of data.
• AI modeling is the process of creating algorithms, also known
as models, that may be educated to produce intelligent
results.
• This is the process of programming code to create a machine
artificially.
• RULE BASED MODEL: Rule Based Approach Refers to the AI
modelling where the relationship or patterns in data are defined
by the developer. The machine follows the rules or instructions
mentioned by the developer, and performs its task accordingly. For
example, suppose you have a dataset comprising of 100 images of
apples and 100 images of bananas. To train your machine, you
feed this data into the machine and label each image as either
apple or banana. Now if you test the machine with the image of an
apple, it will compare the image with the trained data and
according to the labels of trained images, it will identify the test
image as an apple. This is known as Rule based approach. The
rules given to the machine in this example are the labels given to
the machine for each image in the training dataset.
23. Learning based model:
• Refers to the AI modelling where the relationship or
patterns in data are not defined by the developer. In this
approach, random data is fed to the machine, and it is left
on the machine to figure out patterns and trends out of it.
• Generally, this approach is followed when the data is
unlabeled and too random for a human to make sense out
of it. Thus, the machine looks at the data, tries to extract
similar features out of it and clusters same datasets
together. In the end as output, the machine tells us about
the trends which it observed in the training data.
• For example, suppose you have a dataset of 1000 images
of random stray dogs of your area. Now you do not have
any clue as to what trend is being followed in this dataset
as you don’t know their breed, or colour or any other
feature. Thus, you would put this into a learning approach-
based AI machine and the machine would come up with
various patterns it has observed in the features of these
1000 images. It might cluster the data on the basis of
colour, size, fur style, etc. It might also come up with some
very unusual clustering algorithm which you might not
have even thought of
25. Decision Trees:
• A decision tree is a tree-like structure that represents a series of decisions
and their possible consequences.
• .They are an example of a rule based approach. The basic structure of a
Decision Tree starts from the root which the point where the decision tree
starts.
• From there, the tree diverges into multiple directions with the help of arrows
called branches. These branches depict the condition because of which the
tree diverges. In the end, the final decision is where the tree ends. These
decisions are termed as the leaves of the tree. You would realize that this
looks like an upside-down tree.
• A decision tree simply asks a question, and based on the answer (Yes/No), it
further split the tree into subtrees.
• In a Decision tree, there are two nodes, which are the Decision
Node and Leaf Node. Decision nodes are used to make any decision and have
multiple branches, whereas Leaf nodes are the output of those decisions and
do not contain any further branches.
• Why use decision trees?
• Decision Trees usually mimic human thinking ability while making a decision,
so it is easy to understand.
• The logic behind the decision tree can be easily understood because it shows
a tree-like structure.
26. Decision Tree Terminologies
•Root Node: Root node is from where the
decision tree starts. It represents the entire
dataset, which further gets divided into two
or more homogeneous sets.
•Leaf Node: Leaf nodes are the final output
node, and the tree cannot be segregated
further after getting a leaf node.
•Splitting: Splitting is the process of dividing
the decision node/root node into sub-
nodes according to the given conditions.
•Branch/Sub Tree: A tree formed by splitting
the tree.
•Pruning: Pruning is the process of removing
the unwanted branches from the tree.
•Parent/Child node: The root node of the tree
is called the parent node, and other nodes are
called the child nodes.
27. Machine Learning :
• Machine learning is an application of AI.
• Machine learning aims to teach a machine how to perform a specific
task and provide accurate results by identifying
patterns.
• This enables a computer system to continue learning and improving on
its own
based on experience.
• Types of Machine Learning:
• Supervised learning
• It is a type of machine learning that uses labeled data to train machine
learning models. In labeled data, the output is already known. The
model just needs to map the inputs to the respective outputs.
• An example of supervised learning is to train a system that identifies
the image of an animal.
• Example, you can see that we have our trained model that identifies
the picture of a cat.
• Application of Supervised Learning: Weather forecasting, Sales
forecasting
28. • Unsupervised Learning: Unsupervised learning is a type of machine learning that uses unlabeled data to train
machines. Unlabeled data doesn’t have a fixed output variable. The model learns from the data, discovers the
patterns and features in the data, and returns the output.
• Depicted below is an example of an unsupervised learning technique that uses the images of vehicles to classify if
it’s a bus or a truck. The model learns by identifying the parts of a vehicle, such as a length and width of the
vehicle, the front, and rear end covers, roof hoods, the types of wheels used, etc. Based on these features, the
model classifies if the vehicle is a bus or a truck.
• Application: One of the applications of unsupervised learning is customer segmentation.
Based on customer behavior, likes, dislikes, and interests, you can segment and cluster
similar customers into a group.
• Reinforcement Learning: Reinforcement learning follows trial and error methods
to get the desired result. After accomplishing a task, the agent receives an award.
• An example could be to train a dog to catch the ball. If the dog learns to catch a ball,
you give it a reward, such as a biscuit.
• Reinforcement Learning methods do not need any external supervision to train models.
• Reinforcement learning problems are reward-based. For every task or for every step completed, there will be a reward received
by the agent. If the task is not achieved correctly, there will be some penalty added.
• Applications:
• Reinforcement learning algorithms are widely used in the gaming industries to build games. It is also used to train robots to do
human tasks.
29. Deep Learning:
• Deep learning is part of a broader family of machine learning
methods, which is based on artificial neural networks with
representation learning.
• The adjective "deep" in deep learning refers to the use of multiple
layers in the network.
• Methods used can be either supervised, semi-supervised or
unsupervised.
• Using deep learning computers process data in a way that is
inspired by the human brain.
• Deep learning models can recognize complex patterns in pictures,
text, sounds, and other data to produce accurate insights and
predictions.