- Argan, Inc. is an engineering and construction company that specializes in natural gas-fired power plants and has a large contract backlog of $1.2 billion. It is currently undervalued given its strong financial position and growth opportunities.
- Argan has significant demand driven by growth in fracking and aging natural gas infrastructure, and its acquisitions help diversify revenue and add synergies.
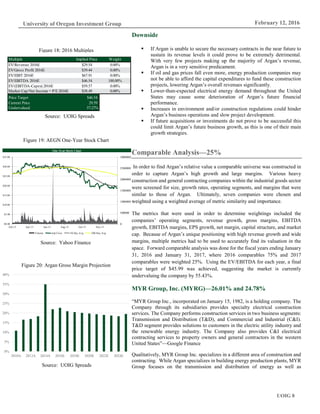
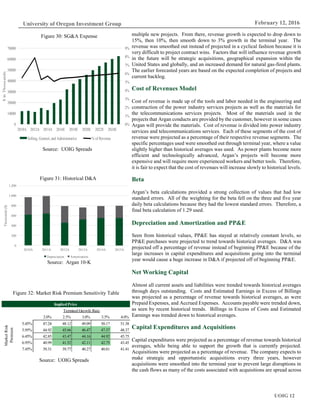
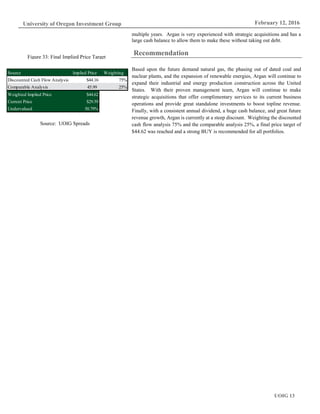
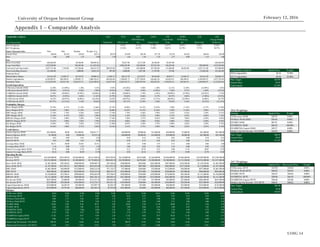
- The analyst recommends purchasing Argan shares which are currently trading below the $44.62 price target given the company's competitive advantages and growth potential.
This presentation discusses Ballard's progress towards providing smarter clean energy solutions using fuel cell technology. It outlines Ballard's leadership in proton exchange membrane fuel cells, recent commercial and market development progress, 2010 guidance targeting over 35% revenue growth, adequate liquidity with no need for additional capital, and an experienced management team. The presentation provides an overview of Ballard's transformation to focus on delivering commercial fuel cell products and systems.
March 2014 Edition of BEACON, A Monthly Newsletter by SIMCON.
Inside this issue:
INDUSTRY ANALYSIS : Power Sector
COMPANY ANALYSIS : Tata Power
Concept of the Month
Quiz
Did You Know?
Thor Power Corporation is a US-based company founded in 2002 that develops and markets efficient power systems between 0.3kW and 50kW. It has developed a multi-patented electric power system that can generate and motor power more efficiently, using over 50% less energy than traditional systems. The company currently seeks $5 million to fund the next phase of development and commercialization. It has applications in industries like wind, hydro, HVAC, tools, vehicles, aerospace, representing an $18 billion market.
This document brings together a set
of latest data points and publicly
available information relevant for
Energy Industry. We are very excited
to share this content and believe that
readers will benefit from this
periodic publication immensely.
The document discusses the development of a battery pack that can capture wasted energy generated during the lowering of a drilling rig's top drive. The battery pack would install in place of one of the rig's generators, allowing the captured energy to be reused and reducing fuel costs by up to 10% per rig. Recent advances in battery technology have enabled this solution, though no rig operators have adopted it yet. The company Powera plans to manufacture and sell these battery packs, which could save rig operators $800 per day in fuel costs.
Navigating the Energy Transformation: Creating Customer and Shareholder Value...Guidehouse
The document discusses the accelerating transformation of the energy industry driven by technology innovation, changing regulations and policies, and evolving customer demands. It describes how the traditional centralized power grid is evolving into a "Energy Cloud" that is cleaner, more distributed, intelligent and mobile. Key trends include the growth of distributed energy resources (DER) outpacing centralized generation, and the emergence of new business models and platforms in areas like energy-as-a-service, transportation electrification, smart cities and transactive energy markets. Utilities are encouraged to evolve their roles and business models to become orchestrators of these new decentralized systems and capture opportunities in the Energy Cloud.
This strategic audit document provides an overview of the Sewedy Electric Wind Group (SWEG) including its corporate structure, vision, mission, strengths, weaknesses, opportunities, threats, and recommendations. SWEG is the first wind energy components manufacturer in Egypt and the Middle East with a strong financial position backed by its parent company El Sewedy Group. The document analyzes SWEG's internal and external environments and provides recommendations to modify its organization structure to support scalability, ensure corporate governance is applied, focus on development in Egypt and the Middle East, focus on innovation management, and plan using a twofold gaze of perception and sightedness.
North America Utility Industry 2009 Top 10 PredictionsRick Nicholson
The document provides 10 predictions for the North American utility industry in 2009. It predicts that energy efficiency will become the top priority for utilities due to demand growth and policy mandates. Renewable energy growth will slow in 2009 but rebound in 2010 due to policy support. Utilities will emphasize distributed energy to support the grid. Intelligent grid technology spending will reach $70 billion by 2013. Web portals will be the fastest way for consumers to manage energy. Energy trading investment will decrease. Generators will focus on managing carbon exposure. Water scarcity and technology will impact the water market. Gas utilities will be hit harder than electric utilities by the recession. Overall US utility IT spending growth will decrease to 1.9% in 2009.
2018 Wall Street Week Stock Pitch, First PlaceJoe Braun
The document analyzes MasTec as an investment opportunity, noting that its Communications and Oil & Gas segments are poised for unexpected growth due to accelerating 5G rollouts and continued strength in oil and gas. It sets a 12-month price target of $66 per share, representing 45% upside, based on rapid expansion of AT&T's 5G network and enhanced top and bottom line growth from Communications and Oil & Gas. Valuation analyses find MasTec significantly undervalued relative to peers on forward P/E, EV/EBITDA, and EV/Revenue multiples.
A brief comprehensive handbook for developers
and investors to maximize their returns.
How much can you expect as returns from your investment into solar.
Choose the best alternative ,
Know your Policy
Know your Business Model
Know your Open Access state
The states covered in the report have their own pros and cons and will require in detail analysis for their viability
and priority for a particular project developers. For more information on the techno-commercialviability and future of Indian Solar market contact us at
info@indianpowersector.com.
Cytec Industries is positioned to benefit from growth in the aerospace, automotive and mining industries. The company has contracts with major aircraft manufacturers as production increases to meet rising air travel demand. US fuel efficiency standards will increase demand for lightweight composites in cars. Declining ore grades and emerging market demand are increasing mining output and the need for Cytec's separation chemicals. The presentation recommends Cytec as a buy with a 12-month price target of $70.50, representing 30.51% upside.
Capital Expenditure Survey 2003
Capital spending continues to decline in nearly all industries, continuing a
trend that began in the mid-1990s when manufacturing productivity began
to increase markedly. The continuing uncertainty in most economies has
put pressure on manufacturers to cut spending, resulting in a steady decline
for several years now despite increasing revenues. Helping to fuel the
cost-cutting fire are the mega-mergers between industrial giants that have
racked up billions in savings as companies increase their manufacturing
economies of scale and eliminate duplicate functions.
ARC’s CapEx index tracks capital expenditures, total revenue, total assets,
EBIT, and return on assets (ROA) for 56 companies in 10 target industries,
representing $2.4 trillion in annual revenue. Companies in the index
generate revenue from most global markets and many
spread their manufacturing around the globe. Of the 56
companies, 64 percent have their headquarters in North
America, 27 percent in Europe, and 9 percent in Asia.
Mobileye is a technological leader in autonomous driving poised to benefit from regulations requiring automatic emergency braking by 2022. It has substantial contracts with automakers like GM and technology like EyeQ that provides effective vision-based driver assistance. The analysts recommend Mobileye as a buy with a $60 price target, a 50% upside.
This document provides an analysis of the Canadian Pacific and Norfolk Southern railroad companies and the US railroad industry. It includes an industry analysis covering future growth potential, industry life cycle, barriers to entry, concentration, capacity changes, stability, technology investments, and government regulations. Company backgrounds and financials are presented for Canadian Pacific and Norfolk Southern. A merger recommendation and pro forma financials are provided showing the benefits of a merger between the two companies, with Canadian Pacific advised to continue pursuing a merger deal with Norfolk Southern.
Preparing for growth in shale gas in the marcellus and utica plays tech belt ...Jerry Paytas, Ph.D.
The document discusses opportunities for downstream development in the Marcellus and Utica shale plays. It outlines objectives to educate and address barriers like workforce, infrastructure, and development sites. The region has the 2nd largest unconventional gas play and potential for chemical and plastics growth. It highlights the existing supply chain, talent pool, and research institutions that could support new downstream investment and job creation through partnerships across the states.
For the complete report, get in touch with us at : info@netscribes.com
Abstract:
Netscribes’ latest market research report titled Wind Turbine Market in India 2014 mentions that renewable energy is gaining prominence within the country. Wind energy accounts for majority of the renewable energy generated in the country. With the country facing continuous shortfall in the supply of energy to meet the expanding demands through conventional sources, the focus is shifting from conventional sources of energy to renewable energy. As more and more wind projects are planned for this reason, the market for wind turbines is also expected to grow. Various other reasons such as the high prices and lack of easy availability of raw materials for generating electricity through thermal plants is also driving growth in the market. However, the government’s decision to withdraw various schemes which provided several incentives to wind energy producers is having a negative impact on the market’s growth. Off-shore wind energy generation, hybrid generators such as solar photovoltaic and wind and wind and diesel, as well as advent of small wind turbines are some of the trends that can be seen in the industry at present.
Several government and industry bodies are working towards the development of the market and various policy and regulatory incentives are being provided to wind energy producers. However, the market is import dependent. Majority of the players operating in the market are foreign companies and there is stiff competition among these players. The advancements in technology and the resultant reduction in costs will ensure that the market will grow steadily in the next few years.
Coverage
• Overview of the wind turbine market in India and historical and forecasted market size data over 2007 to 2018
• Segmentation of the wind turbine market and cost components of various types of generators
• Export-import overview of wind turbines, value of export-import over 2009-10 to 2012-13 and country-wise value of export-import for 2011-12 and 2012-13
• Qualitative analysis of market drivers, challenges, trends and regulatory measures taken by the government
• Overview of the various industry bodies and their responsibilities
• Analysis of the competitive landscape and detailed profiles of major players
The document summarizes the key findings of IRENA's 2019 report on renewable energy jobs. It finds that:
- The global renewable energy sector employed approximately 11 million people in 2018, up slightly from 10.3 million in 2017.
- China, Brazil, the US, India, and EU countries lead in renewable energy jobs. Asian countries account for 60% of the total.
- The solar PV industry remains the largest employer with around 3.6 million jobs globally. Biofuel and wind power industries each support over 1 million jobs. Hydropower employs around 2.1 million people directly.
- Factors shaping where renewable energy jobs are created include national policies, supply chain diversification,
Global Capital Confidence Barometer | How can you reshape your future before ...EY
The Global Capital Confidence Barometer gauges corporate confidence in the economic outlook, and identifies boardroom trends and practices in the way companies manage their Capital Agendas — EY framework for strategically managing capital. It is a regular survey of senior executives from large companies around the world, conducted by Thought Leadership Consulting, a Euromoney Institutional Investor company. Our panel comprises select global EY clients and contacts and regular Thought Leadership Consulting contributors.
2015 - Cleveland Research Company Stock Pitch Competition Runner UpMichael T. Loffredo
Cytec Industries is positioned to benefit from growth in the aerospace, automotive, and mining industries. It has substantial contracts with Boeing and Airbus to supply lightweight composite materials for commercial aircraft. Legislation requiring automakers to improve fuel efficiency will increase demand for composites. In mining, decreasing ore grades are driving increased production and use of Cytec's separation chemicals. The analyst recommends Cytec as a buy with a 12-month price target of $70.50, representing 30.51% upside.
The annual report discusses Alstom's performance in fiscal year 2012-2013. Key points include:
- Alstom booked €24 billion in orders despite an unfavorable economic context. Half of all orders and almost two-thirds of power generation orders came from emerging markets.
- All of Alstom's business lines (power generation, grid, rail infrastructure) performed well with record orders. Thermal power sold 12 gas turbines and renewable/grid won major contracts.
- Key figures for the year include a 10% rise in orders, 10% increase in net profit, and free cash flow turning positive at €400 million. Alstom is well positioned for future growth.
PowEra Feasibility Analysis 2
Prepared By:
Justin Charron
Diana Dang
Chris Hoang
Emilia Konoeva
Eric Salkauskas
Aditya Verma
Submitted to Kris Hans, Instructor of ENTI 401 (Entrepreneurship and Innovation 401) - Opportunity Identification for fulfillment of course requirements at the Haskayne School of Business, University of Calgary in Fall 2019.
Transformer oil market is anticipated to reach over usd 3 billion by 2024roshnicore
Transformer Oil Market Size By Product (Mineral Based {Naphthenic, Paraffinic} [Distribution Transformer, Power Transformer, Instrument Transformer, Others], Silicon Based [Distribution Transformer, Power Transformer, Instrument Transformer, Others], Bio Based [Distribution Transformer, Power Transformer, Instrument Transformer, Others]), By Application (Distribution Transformer, Power Transformer, Instrument Transformer, Others)
1. The presentation discusses the Capital Asset Pricing Model (CAPM) and Return on Capital Employed (ROCE) for assessing investment returns in forestry biomass projects.
2. Typical ROCE ranges are provided for different stages of biomass production and processing, from raw material extraction to conversion to fuels and chemicals.
3. The presentation aims to provide investors expectations for returns on investments in biomass production and conversion based on historical ROCE data from similar natural resource industries.
Markntel North America Hydrogen Fuel Cell Market Analysis, 2020ShivaKumar1833
North America is gaining traction in the hydrogen fuel cell market due to rapid commercialization, soaring government support, increasing adoption of distributed energy generation and rising public-private investment, etc. Large size organizations such as Facebook, Microsoft. For more detail visit us at marknteladvisors.com or call us at +1 (613) 707-5086
This document summarizes ten fast growing technologies from 2014-2019 based on increases in US pre-grant patent classifications. It provides an overview of the methodology used to identify these technologies and then summarizes each one in 1-2 paragraphs, including the classification, growth rate, leading organizations, and examples of relevant patents. The ten technologies summarized are: 1) Angiosperms characterized by botanic taxonomy, 2) Genome editing, 3) Medicinal preparations, 4) Arrangements or adaptations of instruments/dashboards, 5) Physical training - horizontal bars, 6) Computer systems based on computational models, 7) Additive manufacturing, 8) Aeroplanes and helicopters, 9) Systems for controlling non-electric variables, and 10
The Evolution of the Energy Manager: From Boiler Room to Board RoomKaryn Peacocke
The role of the Energy Manager is undergoing profound change. Over the past 20 years we have witnessed the emergence of a new breed; someone who is comfortable in the board room as well as the boiler room. And he - or increasingly she - is starting to have a material impact on
margins and revenues.
1. The document discusses corporate venture financing and how it allows corporations to influence complementarity between their products and venture products. Using specialized corporate inputs can help reduce venture marginal costs.
2. It provides an example of Mercom Capital Group, a consulting firm that advises clean energy companies. It summarizes Mercom's report on 2013 global solar funding trends, including a drop in venture capital but rise in overall financing, and discusses some large projects and M&A deals.
3. Mercom invested in India's solar sector despite delays and uncertainty due to the potential for strong growth with supportive policies addressing power needs.
SPI Energy (NASDAQ: SPI) is an established green energy player with global operations in key markets in Australia, Europe, Japan and the United States. It is leveraging its sizable solar platform and industry expertise to make strategic investment opportunities in green industries with significant growth and earnings potential and/or industries than can benefit from green power. Learn more at www.SpiGroupsInfo.com.
The Shaw Group Inc. achieved record financial results in 2001, with earnings increasing 101% to $61.2 million and sales up 102% to $1.5 billion. The company's backlog also grew substantially to $4.5 billion, driven primarily by strong demand in the domestic power generation market. Key accomplishments in 2001 included successfully integrating the acquisition of Stone & Webster and establishing new pricing models that aim to deliver projects at the lowest total installed cost through risk-sharing with customers. Looking ahead, Shaw expects continued growth driven by ongoing power market build-up and opportunities in related industries like petrochemical and refining.
Assessment of Risks in International EPC Projects Reference Current Global Ec...HIMADRI BANERJI
Assessment of Risks in the present global economic environment for projects and especially projects that deal with EPC contracting for large scale infrastructure. A review of some of the major projects that have changed the rues of the game for Project Risk Assessment, management and mitigation forms a significant part of the prentation
This document brings together a set of latest data points and publicly available information relevant for . We are very excited to share this content and believe that readers will benefit immensely from this periodic publication immensely.
• Mega opportunities in P2G and Hydrogen Battery are finally becoming a reality
• New fuel cell companies get spun-off, formed, and funded regularly
• Customers are showing greater comfort with technology through repeat purchases (Verizon and BMW)
• Industry still requires considerable support from regulators in the form of grants, project funding, etc.
• Partnerships and alliances seem to be key for smaller companies to gain global commercial traction
• Starting to see more “marriages” of “project management” companies with “fuel cell” OEMs
• Business models shifting to a service oriented “per unit” sale of hydrogen / power on a turnkey basis
• Requires deeper pockets and cheapest cost of financing
Global Renewables Transition Requires Dedicated ETRM CapabilitiesCTRM Center
Renewable energy resource development is accelerating around the globe as the push to reduce carbon emissions continues to gain momentum.
As the pace of renewable energy expansion quickens, market participants will continue to adjust to the commercial and financial implications as well as production variability and intermittency, reliability, and grid stability. In this white paper we will explore the changing nature of power markets, the complexities that will challenge utilities, power off-takers and traders, and the critical ETRM systems they rely on to ensure profitability.
This document brings together a set of latest data points and publicly available information relevant for Business Services Industry. We are very excited to share this content and believe that readers will benefit from this periodic publication immensely.
This document brings together a set
of latest data points and publicly
available information relevant for
Utilities Industry. We are very excited to share this content and believe that readers will benefit from this periodic publication immensely.
The document discusses procedures for developing challenge questions and concepts related to challenges. It focuses on ensuring challenges are aligned with organizational goals and have a clear process for implementing ideas generated from the challenge. It also discusses the importance of being able to transform concepts into real projects, products, or services to determine the program's return on investment.
Oil & Gas ICT Leader 2017 - Day 1 April 19th Ray Bugg
The industry is changing: against a challenging backdrop with a ‘lower for longer’ economic forecast, Oil & Gas companies are turning to technology to modernise and improve their operations. This transformation has seen IT repositioned as a core business technology, drawn from a background support function to a crucial centre of value creation and innovation. This tectonic shift places IT leaders in a vital position within their organisation, ensuring existing assets and emerging technology are effectively harnessed to deliver tangible business outcomes.
Cost reduction is still the primary mandate for most organisations, with ongoing efforts to strip back overheads and address key areas of inefficiency to cope with tightening budgetary restraints. But while the pursuit of ‘more for less’ has become a fundamental necessity, it is important that the strategy employs sufficient safeguards to avoid stifling long term progress. Organisations need to retain the personnel, the skills and the tools to ensure they still have the capacity to innovate.
One of the most prevalent trends of recent years has been a concerted move towards greater automation. Organisations are increasingly incorporating sensors, robotics and live data feeds to enhanced remote operations. But this digitisation of process is not just taking place in far flung fields; across the operation, digital technologies are being applied to enable improved visibility and insight. And data analytics is increasingly being used to evaluate asset performance, and enhance predictability, forecasting and decision making.
Whilst operators have made strides to address inefficiencies and create faster, more agile processes, there are still several barriers to progress. Organisations need to adapt their structure, break down internal silos and allow more cohesive and collaborative engagement. This collaboration also needs to extend to the wider supply chain and external partners across the industry. Skills and leadership is also a key barrier to progress, while cultural inertia still poses a problem for the industry and needs to be tackled head-on if digital transformation ambitions are to be achieved.
This conference will bring together IT leaders from across the world for knowledge exchange, thought leadership and collaboration. Now in its 4th year, the conference has established itself as the must-attend event for IT leaders working in Oil & Gas. The programme will explore the use of Information Technology in driving tangible business benefits, with topics spanning: data analytics, cloud, cyber security, automation, leadership and culture.
This document brings together a set
of latest data points and publicly
available information relevant for
IoT & AR Services Industry. We are
very excited to share this content and
believe that readers will benefit from
this periodic publication immensely.
- The stock has a market price of $72.81 per share and a market capitalization of $30.555 billion. Its return last year was 23.6% with sales and earnings growth of -0.03350%.
- Analysts recommend holding the stock due to its diversification between regulated and unregulated energy markets. The company is well-positioned for growth in renewable energy.
1. Impact Capital Advisors is an international investment firm that provides advisory services to small and medium enterprises, including private and public companies as well as private equity funds, with a focus on infrastructure projects.
2. Impact Capital currently has three client companies seeking financing: Greencredible Ventures, which is developing agri-energy and mobile technology projects in the Philippines; Boston Harbor Distillery, the first distillery to return to Boston in over a century; and Reality Mobile, which provides surveillance technology.
3. Greencredible Ventures is seeking $1.5 million in founder capital and $25 million in institutional funding for sugarcane and block farming projects in the Philippines, while Boston Harbor Distillery has
Jan Vrins, leader of Navigant's global energy practice, examines the state and future of the power industry, including megatrends, tipping points, future state, and the path forward.
- The document presents an investment thesis for Greenbrier Companies stock, arguing that its strong financial position and efforts to diversify will enable it to remain profitable despite challenges in the railroad industry.
- While depressed oil prices have hurt the industry, Greenbrier has maintained a strong balance sheet and is diversifying its product base and international revenue. Its backlog is mostly non-energy related.
- However, the company is still dependent on the US market and oil shipments by rail present risks if economic conditions change or international negotiations impact oil prices and production. Greenbrier must outperform its struggling industry to justify its higher valuation.
Nextera Energy University of Southern California Investment CTimothy O'Brien
This past spring Zane Laws, Quinn Peebles and I competed in the University of Southern California Spring 2018 Investment Competition at USC in Los Angeles. We pitched a long position in NextEra Energy Inc, ticker NEE.
Miami University 2018 Cleveland Research Company Stock Pitch CompetitionNhat Pham
MasTec Inc. is an infrastructure construction company that operates in communications, oil and gas, electrical transmission, and power generation industries. We recommend buying MasTec stock with a 12-month price target of $53, a 10.65% upside, driven by the $130-150 billion to be spent on US fiber infrastructure for 5G and MasTec's record $7.1 billion backlog and opportunities in Mexico and pipeline projects.
Power Distribution Component Market 2019 Regional Trend | Growth Projections ...Ashwin Avhad
The power distribution component market is expected to surpass $140 billion by 2025, driven by demand for more efficient transmission and distribution systems and development of electrical infrastructure. Circuit breakers and distribution panels have gained prominence due to their versatility across applications. Indoor power distribution component installations are predicted to grow over 10% annually to 2025 due to space constraints driving compact equipment. The market in Asia Pacific, Middle East, and Africa is growing due to investment in transmission and distribution systems. Major players in the power distribution component market include Eaton, Schneider, GE, ABB, and Siemens.
Silver Spring Networks is a leader in the Internet of Things space focused on smart metering and grid infrastructure. They have the leading smart grid networking platform due to their innovation. Their upcoming 5th generation platform will allow them to expand into new areas like smart cities and offer more services to drive recurring revenue. Recent large deals in India and with Con Edison show their ability to expand internationally where grid development is needed. They are rated Outperform with a price target above the current stock price, recommending investors buy the stock.
- The original investment thesis for Rentrak Corporation remains intact but revenue growth expectations were significantly higher than realized performance and management guidance.
- While Rentrak saw considerable revenue growth in key areas, it was well below projections, and further growth may not be sustainable at the levels expected.
- The stock price is highly sensitive to news about revenue and guidance, with large swings that could impact any holding in the company.
- A revised discounted cash flow valuation was performed using updated financial results and expense assumptions, but Rentrak's performance remains hard to predict accurately.
The document discusses Becton, Dickinson & Co.'s (BD) acquisition of CareFusion Corporation and how it will increase BD's position in the medication management industry. The acquisition will boost BD's revenues through increased presence in emerging markets and the US healthcare sector. The implementation of the Affordable Care Act and an aging population will increase demand for healthcare products. BD focuses on developing current products and new products planned through 2017 to ensure growth across all business segments.
This document analyzes Paychex, Inc. as an investment opportunity. It finds that increasing US economic growth and small business growth will drive Paychex's revenue growth from its payroll and HR outsourcing services. Paychex is also developing new products that capitalize on growing demand for outsourcing. The analyst recommends Paychex as an "outperform" investment and sets a price target above the current stock price due to Paychex's superior products and competitors facing difficulties.
Kroger is the largest supermarket chain in the US with a 15.4% market share. The document discusses Kroger's acquisition of Harris Teeter and Vitacost.com, which provides opportunities to expand into fast-growing online, southeast, and Mid-Atlantic markets. Successful expansion through Harris Teeter's locations and brand will result in additional market share and revenue diversification. The analyst recommends Kroger as an "Outperform" investment due to proven management, geographic diversification, clear growth strategies, and limited downside risk.
Medical Instrument and Supply Manufacturing Industry ReportCharles Pontrelli
The document provides an overview of the medical instrument and supply manufacturing industry. It discusses key factors such as an aging population driving increased demand, regulations from the FDA and PPACA, and consolidation in the industry with larger companies acquiring smaller innovative ones. While the industry faces pressures from regulations and increasing wages, overall growth is expected to continue due to demographic trends and the need for ongoing innovation in medical technology. The industry provides opportunities for Oregon companies if they maintain innovation and low costs.
Medical Instrument and Supply Manufacturing Industry Report
AGX-Final-Report
1. 1 University of Oregon Investment Group
Covering Analyst: Charles Pontrelli
cpp@uoregon.edu
February 12, 2016
IME
Investment Thesis
With oil prices falling significantly in the past couple months, investors have
overreacted. With a large cash balance and a huge contract backlog of $1.2
billion, Argan is poised for great top-line and bottom-line growth and is
currently at a steep discount
With technological advancements in fracking and an aging natural gas
production infrastructure, there is huge demand for the construction,
maintenance, and operation of natural gas-fired power plants, which Argan, Inc.
specializes in
Argan’s selective and opportunistic acquisitions, such as the recent acquisition of
The Roberts Company in December, will add synergies to its current operating
segments as well as diversify its revenue streams and assist in top-line growth
Argan, Inc.
Ticker: AGX
Current Price: $29.59
Recommendation: Outperform
Price Target: $44.62
Five-Year Stock Chart
0
500000
1000000
1500000
2000000
2500000
3000000
$0.00
$5.00
$10.00
$15.00
$20.00
$25.00
$30.00
$35.00
$40.00
$45.00
Feb-11 Aug-11 Feb-12 Aug-12 Feb-13 Aug-13 Feb-14 Aug-14 Feb-15 Aug-15
Volume Adj Close 50-Day Avg 200-Day Avg
Key Statistics
52 Week Price Range $28.03 - $42.50
50-Day Moving Average $30.71
Estimated Beta 1.29
Dividend Yield 2.30%
Market Capitalization (M) $443,846
3-Year Revenue CAGR 11.20%
Trading Statistics
Industry EV/EBITDA 2016E 6.07x
AGX EV/EBITDA 2016E 2.25x
Industry EV/EBITDA 2017E 5.50x
AGX EV/EBITDA 2017E 1.82x
Diluted Shares Outstanding (M) 15,495
Average Volume (3-Month) 170,252
Margins and Ratios
Gross Margin (2016E) 22.74%
EBITDA Margin (2016E) 17.34%
Net Margin (2016E) 11.84%
Debt to Enterprise Value -
2. UOIG 2
University of Oregon Investment Group February 12, 2016
Business Overview
Argan, Inc. (“Argan”) was incorporated in Delaware in May, 1961. They are a
holding company that conducts operations through its subsidiaries Gemma Power
Systems, LLC and affiliates (“GPS”) and Southern Maryland Cable, Inc. Argan
employees approximately 870 employees. They currently trade on the New York
Stock Exchange under the ticker AGX. Their headquarters are in Rockville, MD,
and conducts various projects across the United States. Management intends to
expand Argan through strategic acquisitions and/or investments in other
companies that work well with their current subsidiaries with great potential for
profitable growth.
Business Segments
Power Industry Services—98.32%
The majority of Argan’s business is composed of its Power Industry Services
segment. Gemma Power Systems, LLC (“GPS”) makes up almost all of this
segment, and is a full service engineering, procurement, and construction (“EPC”)
contractor which designs, builds, and commissions large-scale energy projects.
GPS has completed projects for more than 76 different facilities that represent
over 11,000 megawatts of power-generating capacity. The previously mentioned
projects include simple-cycle peaking plants, boiler plant construction and
renovation, and base-load combined-cycle facilities. Argan has also expanded into
the renewable energy industry by providing contracting services for biomass
plants, wind farms, and solar fields. Projects usually last between 1 and 3 years.
Additionally, Argan also procures materials for installation on their energy
projects.
In the past three years, Argan has completed six large energy projects, including
wind-energy farms in the states of Illinois and Pennsylvania, an 800 MW simple-
cycle quick start peaking power plant in Desert Hot Springs, CA, and two large
solar energy fields in Massachusetts including the installation of over 40,000
ground-mounted photovoltaic panels on capped and closed landfills. They also
completed a biomass-fired project for a 49.9 MW power plant in Woodville, TX
and currently have the contract for the operation and maintenance of the power
plant for 3 years.
Argan is currently working on two major projects in the Marcellus Shale region
of Pennsylvania and is building two natural gas-fired plants, each of which will
generate approximately 800 MW of power. Both are expected to complete around
the middle of 2016. Argan is also working on a natural gas-fired plant that began
in Late 2016 and is expected to finish in 2018. The plant will generate 1040 MW
of power on completion. They also have various other projects ongoing, many of
which will be finished in 2018. GPS receives revenues based on the percentage
completion of these projects, and then receives success fees when the projects are
completed. They currently have $1.2 billion of contract backlog.
Telecommunications Infrastructure Services—1.68%
Argan also conducts business through its subsidiary Southern Maryland Cable,
Inc. SMC provides technology wiring and utility construction solutions to
customers in the mid-Atlantic region. They perform structuring, cabling,
terminations, and connectivity for data, voice, video, and security networks inside
and outside plants.
Figure 3: Industry Market Share
Source: IBIS World
Figure 1: Argan Revenue Growth
Source: Argan 10-K and UOIG Spreads
0
200000
400000
600000
800000
1000000
1200000
2010A 2012A 2014A 2016E 2018E 2020E 2022E 2024E
Millions($)
Figure 2: US Industry Growth
Source: Yahoo Finance
Bechtel Group, Inc. 15.40%
URS Corp. 6.60%
Fluor Corp. 5.50%
Jacobs Engineering Group, Inc. 5.80%
Other 70.70%
3. UOIG 3
University of Oregon Investment Group February 12, 2016
For customers in need of services outside plants, SMC provides trench-less
directional boring and excavation for underground communication and power
networks, aerial cabling, services, and the installation of buried cables, electric
lines, and lighting systems. The range of inside plant and premises wiring services
include cable installation, AutoCAD design, equipment room buildout, data rack
installation, and cable system labelling and documentation.
In these telecommunications projects the customers supply most or all of the
materials required for the job while SMC provides the tools and personnel for the
services. Their contract backlog is currently valued at approximately $570,000.
Industry
Overview
Argan, Inc. operates in the Industrial, Materials, and Energy sector and the Heavy
Engineering Construction industry in the United States. Businesses in this
industry provide power plant construction, mass transit construction, marine
construction, tunnel construction, conservation and development construction,
harbor and port facilities construction, and other various development projects
and services. There are approximately 19,600 business in this industry. It is not
an enormous industry and competition is moderate. Currently, approximately a
quarter of the market share is held by 4 companies with Bechtel Group, Inc.
having 8.5%, URS Corp. holding 8.1%, Fluor Corp. 6.9%, and Jacobs
Engineering Group, Inc. with 5.8%. These companies operate both domestically
and internationally.
Competition is moderate in the industry due to much of the activity undertaken
by businesses being very complex. Competitive pressures are steady in the long
run due to many of the largest players in the space forming strategic alliances with
other businesses to complete projects on time within budgetary constraints,
procure the appropriate materials, and maintain a consistent share of the market.
Being able to complete a project within the time and budget constraints is of the
utmost importance, as contracts are usually awarded on the basis of a proven
reputation. Companies try to expand their market share through geographic
expansion, and acquisitions are very common in this space. Because most
competitors concentrate on very specialized segments, acquisitions are a very
common business strategy.
Market concentration in this industry is low due to how fragmented and
specialized the competition is. Many of these companies only have about 5
employees because they only focus on the repair and maintenance of facilities,
while larger operators secure the majority of construction projects. Many of these
larger operators use subcontractors to complete projects in different regions and
varying sizes. In the past couple years industry concentration has increased
slightly as the frequency of acquisitions has picked up in order to obtain market
share in high growth areas.
Capital intensity in the Heavy Engineering Construction industry is relatively low,
with it being estimated that for every $1.00 spent on wages $0.12 is spent on
capital investments. Even though the cost of purchases is high (industry average
is about 32% of revenue) most of these costs are largely related to materials,
components, and supplies that are used in the construction of facilities. Labor
costs make up on average 34.9% of revenue in the industry.
Figure 4: Industry Structure
Source: IBIS World
Figure 5: Sector vs. Industry Costs
Source: IBIS World
Life Cycle Stage Mature
Revenue Volatility Medium
Capital Intensity Low
Industry Assistance Low
Concentration Level Low
Regulation Level Heavy
Technology Change High
Barriers to Entry High
Industry Globalization Low
Competition Level Medium
22%
7%
3%
4%
32%
35%
35%
44%
2%
4%
1% 1%
4%
5%
0%
10%
20%
30%
40%
50%
60%
70%
80%
90%
100%
Sector Industry
Other Rent & Utilities Wages Purchases
Depreciation Marketing Profit
4. UOIG 4
University of Oregon Investment Group February 12, 2016
The Heavy Engineering Construction industry is subject to a high amount of
technological change because of the evolving technologies in downstream
markets, such as petrochemical manufacturing and electricity generation.
Downstream operators are constantly looking to maximize the efficiency of their
production through research and development, and much of these efficiency
improvements come from having newer infrastructure. To remain successful in
the industry, players try to obtain a good reputation for a specialized segment of
the market and try to stay up to date with the rapid technological changes.
However, many of these changes are generated in downstream markets and not
the Heavy Engineering Construction industry. Technological advancements in
the materials and the components used in construction projects make a large
impact on the ease of construction and how quick these projects can be completed,
so many companies try to stay as up to date as possible with the components they
use.
Regulation in this space is very high and is expected to stay high in the near future.
Regulation is very complex and involves many different levels of government.
There are many planning guidelines and construction standards that guide
construction activity. Compliance with state licensing, building codes, pollution
controls, and occupational health and safety regulations can add many costs, but
these are usually insignificant in the long run compared to litigation costs
associated with not following said regulations.
Macro factors
United States Economic Growth
US economic growth plays a huge factor in this industry as many businesses only
hire construction companies and undertake large projects when they know there
will be future growth in their operations. Many indicators, such as unemployment
rates, corporate profits, and private and public spending reflect economic health.
Currently, many people are uncertain on global economic health, but the US is
currently doing well and is expected to maintain its health, which is very good for
Argan who does almost all of their business in the US.
Natural Gas Demand
While Argan completes many different projects, they have a large exposure to
natural gas prices as many of their projects pertain to the construction and
procurement of natural gas-fired plants. Natural gas prices have declined in the
past year due to an overall fall in prices across the broad energy market. However,
more and more electric utilities are turning to natural gas for fuel, and exports
have picked up as investments in export terminals and shipping infrastructure has
increased. Additionally, many natural gas-fired plants are quite old, and many
need to be replaced or renovated, which provides ample opportunity for Argan.
Similarly, many coal-fired facilities are being retired because of their inefficiency
and are being replaced with new gas-fired facilities. This, coupled with new
standards under the Clean Power Plan which require reduced carbon emission
power generation options (which natural gas is one), we should see increased
demand going forward, which would be very beneficial for Argan.
US Electrical Energy Consumption
US electrical energy consumption plays an important role in Argan’s operations.
Electricity demand can drive a lot of the contract supply. When the recession
occurred, energy consumption retreated, but has been steadily climbing since
2012. Energy consumption is expected to steadily climb as the economy expands
and manufacturers and industrial producers increase the productivity of their
Figure 6: Industry Segmentation
Source: IBIS World
Figure 7: US Natural Gas Consumption
Source: US Energy Information Administration
25.3%
22.0%
16.4%
10.5%
10.4%
8.7%
6.7%
Mass Transit Construction Power Plant Construction
Marine Construction Other
Tunnel Construction Conservation and Development Construction
Harbor and Port Facilities Construction
1000000
1500000
2000000
2500000
3000000
Jan-01 Jan-03 Jan-05 Jan-07 Jan-09 Jan-11 Jan-13 Jan-15
U.S. Natural Gas Total Consumption (MMcf)
Figure 8: Business Concentration Heat Map
Source: IBIS World
5. UOIG 5
University of Oregon Investment Group February 12, 2016
operations. Additionally, households are starting to relax their restrictions on
energy usage as consumers become more confident in the overall economic
conditions in the US.
Competition
As mentioned above, competition in the Heavy Engineering Construction industry
is relatively moderate due to the fragmentation of the industry. Even though
Argan faces some large competitors, there is a large room for specialization in the
industry and many successful players depend on joint ventures to maintain market
share. Most of the competitors in Argan’s space are much larger than Argan.
However, Argan and its competitors can both provide services to the same client
due to the different services that are required by customers. If Argan is going to
be successful, they must win long term contracts that not only entail the
construction of the energy production plants, but also the operation and
maintenance of the plants when the construction projects are finished.
The companies that are able to succeed in the space either specialize in a certain
area of the industry, or are highly adaptable and scalable. These companies must
be able to complete their projects on time and within the budget constraints given
to them in the contracts, as reputation plays a huge part in successfully obtaining
contracts. They must also have highly skilled engineers and contractors in order
to plan the complex projects and make sure they are carried out efficiently.
Argan faces stiff competition in both of its segments. In its power industry
services segment, GPS faces competes with many large and well capitalized firms,
such as Bechtel Corp., Fluor Corp., SNC-Lavalin Group Inc., Chicago Bridge &
Iron Company N.V., Skanska AB, and Kiewet Corp. Argan is able to compete
with these companies because of its cost-effective choice for the design, build and
commissioning of natural gas-fired and alternative power energy systems. With
extensive experience, efficiency, and robust product offerings make it extremely
successful in the space, regardless of competition. The same can be said for
Argan’s telecommunications infrastructure segment, which has a proven track
record, great customer retention, and a highly-motivated workforce. Additionally,
Argan invests annually in new vehicles and equipment.
Strategic Positioning
Over the past couple years, Argan has been focusing on developing its power
industry services business through aggressively pursuing new contracts and
projects. Additionally, they have been acquiring smaller companies that either
provide synergies and fill gaps in its current business operations or provide strong
standalone investments. Additionally, they have been divesting from its business
operations that do not fall in line with their business plan (i.e. the divestiture from
its vitamin supplement segment a few years earlier). Argan has also been
diversifying its geographical locations through various acquisitions, such as its
recent acquisition of The Roberts Company which is based in Ireland and should
provide some synergies to its GPS subsidiary. Even with the large amount of
growth they have realized in the past few years, Argan has been able to keep its
margins high and reduce costs through its management’s effective leadership.
Argan has seen the shift in the energy markets to a greater utilization of natural
gas-fired power plants instead of coal, and is quickly demonstrating they can be a
competitive player in the space. However, they have also been expanding into
alternative energy plant construction with the recent push for a greater percentage
of energy come from renewable sources. Argan is uniquely positioned in the
Figure 9: Natural Gas Spot Prices
Source: US Energy Information Administration
Figure 10: Cost of Revenues
Source: Argan 10-K and UOIG Spreads
1
1.5
2
2.5
3
3.5
2/9/2015 4/9/2015 6/9/2015 8/9/2015 10/9/2015 12/9/2015
Natural Gas SpotPrices
$0.00
$100,000.00
$200,000.00
$300,000.00
$400,000.00
$500,000.00
$600,000.00
$700,000.00
$800,000.00
$900,000.00
2010A 2012A 2014A 2016E 2018E 2020E 2022E 2024E
Millions($)
Figure 11: Argan, Inc. Subsidiaries
Source: Argan Website
6. UOIG 6
University of Oregon Investment Group February 12, 2016
space as a specialist in the construction of natural gas-fired plants, is large enough
to outbid its competitors, and still small enough that it can achieve large growth.
Because of its proven track record of completing projects on time, staying at or
below its budget constraints, and providing high quality work, Argan has
established a large and very loyal customer base. Because of its relationship with
local governments, Argan is able to fully comply with all regulations without
delays. Additionally, its positive reputation has allowed it to secure many
contracts recently. Argan currently has $1.2 billion in backlog, which solidifies
many future revenue streams for Argan and proves its ability to win significant
contracts.
Business Growth Strategies
Being a holding company, one of Argan’s main growth strategies is acquiring
businesses that either add to their current business operations and help improve
the business or act as good standalone investments. For example, Argan’s recent
acquisition of The Roberts Company, which is a fabricator and construction
company, will diversify Argan’s current portfolio and add some synergies to its
GPS subsidiary. Management is committed to making strategic and opportunistic
acquisitions every couple years in order to progress the business. On top of that,
their enormous cash balance gives them the purchasing power of a large firm even
though they are a small-cap company.
Argan’s power industry services is poised for huge growth in the next couple years
with its expansion from the east coast into other areas of the US and its backlog
of $1.2 billion. This is perfect since two of Argan’s major projects will be
wrapping up in the next couple months. With new projects consisting of not only
natural gas-fired plants, but all so biomass-fired plants, Argan is diversifying its
operations and reducing risk. With the increase of energy consumption, aging
coal and nuclear power plants, and the movement to cleaner energy alternatives.
Argan has set itself up for success in the next few years to come.
Additionally, Argan’s expansion into other areas of the US, and the possibility
that they will expand their international work, would be extremely beneficial in
driving revenue growth. Argan will be able to capitalize on the long-term
relationships they have established throughout the industry to aggressively build
their backlog of projects in the US, as well as around the globe.
Management and Employee Relations
Rainer Bosselmann – Chairman and CEO
Rainer Bosselmann is the current Chairman and CEO of Argan, Inc. Mr.
Bosselmann has been the Chairman since May 2009 and CEO since October 2003.
Previously, Mr. Bosselmann served as the Chairman and CEO of Arguss
Communications, Inc. from 1996 through 2002. From 1991 through 1995, Mr.
Bosselmann was Vice Chairman and President of Jupiter National, Inc.
David Watson—CFO and Senior Vice President
David Watson is the current CFO and Senior Vice President of Argan, Inc. Mr.
Watson was most recently the CFO and Treasurer of Gladstone Investment
Corporation and Gladstone Capital Corporation. Mr. Watson received his MBA
from the University of Maryland Robert H. Smith School of Business and is also
Figure 12: Capital Expenditures Projections
Source: Argan 10-K and UOIG Spreads
Figure 13: EBITDA Projections
Source: Argan 10-K and UOIG Spreads
0
1000
2000
3000
4000
5000
6000
7000
8000
9000
10000
2010A 2012A 2014A 2016E 2018E 2020E 2022E 2024E
CapitalExpenditures
-50%
0%
50%
100%
150%
200%
0
20000
40000
60000
80000
100000
120000
140000
160000
2010A 2012A 2014A 2016E 2018E 2020E 2022E 2024E
EBITDA EBITDA Growth
0
100,000
200,000
300,000
400,000
500,000
600,000
700,000
800,000
900,000
2010A 2011A 2012A 2013A 2014A 2015A
Thousands($)
Figure 14: Historical Gemma Backlog
Source: Argan 10-K and UOIG Spreads
7. UOIG 7
University of Oregon Investment Group February 12, 2016
a CPA. He has held many senior financial positions within public and private
companies for over 15 years.
Management Guidance
Management does not provide any guidance on their future financial performance.
They do provide current contractual backlog at the end of each financial period.
Portfolio Strategy
Argan is not currently held in any of the University of Oregon Investment Group’s
portfolios. At the moment, the Tall Firs portfolio is extremely underweight in
IME and in-line for small cap. While we are in-line small cap, Tall Firs currently
holds a lot of cash, which would be best deployed by adding Argan to its holdings.
The DADCO portfolio currently has a considerable amount of energy exposure
with its holdings of MasTec, Alcoa, and SolarCity, but all of these have been
performing very poorly on the year. Argan’s large undervaluation would provide
the positive return the portfolio so desperately needs. Finally, the Alumni
portfolio only has two holdings, which make up 8% of the portfolio with the rest
being cash/tracker. Because the Alumni portfolio is looking for small-cap
companies that are highly undervalued, Argan would be a great addition with its
high future revenue growth, its huge cash balance, and the current undervaluation
from the overall market decline.
Recent News
Argan, Inc. Reports Third Quarter Results – Business Wire–
December 10, 2015
Argan recently reported third quarter results for their fiscal year ending January
31, 2016. They posted revenues of $114 million, implying a growth of 17% from
the previous quarter. Gross profit decreased $2.2 million to $26.3 million
compared to the second quarter mostly due to lower margins on the four new GPS
projects. Management also announced a backlog of $1.2 billion.
Catalysts
Upside
Increased demand for cleaner energy production plants will lead to a
greater number of plant construction projects, driving Argan’s revenue
growth and contractual backlog levels.
An aging United States energy production infrastructure will call for the
renovation or phasing out of current energy production plants, which will
lead to many new and consistent project opportunities for the company
and its subsidiaries.
Argan will be able to continue its market position in the Marcellus Shale
Region and receive large revenue streams through the maintenance and
operation of finished projects, as well as the construction and
procurement of new facilities.
As oil and natural gas prices begin to rebound in the first half of the year
Argan will see a huge improvement in their already strong revenue
streams.
Figure 15: AGX One-Year Stock Chart
Source: Yahoo Finance
Figure 17: MYRG One-Year Stock Chart
Source: Yahoo Finance
One-Year Stock Chart
0
100000
200000
300000
400000
500000
600000
700000
800000
900000
$0.00
$5.00
$10.00
$15.00
$20.00
$25.00
$30.00
$35.00
$40.00
$45.00
Feb-15 Apr-15 Jun-15 Aug-15 Oct-15 Dec-15 Feb-16
Volume Adj Close 50-Day Avg 200-Day Avg
One-Year Stock Chart
0
500000
1000000
1500000
2000000
2500000
3000000
$0.00
$5.00
$10.00
$15.00
$20.00
$25.00
$30.00
$35.00
Feb-15 Apr-15 Jun-15 Aug-15 Oct-15 Dec-15
Volume Adj Close 50-Day Avg 200-Day Avg
Figure 16: Competitive Landscape
Source: Argan Website
8. UOIG 8
University of Oregon Investment Group February 12, 2016
Downside
If Argan is unable to secure the necessary contracts in the near future to
sustain its revenue levels it could prove to be extremely detrimental.
With very few projects making up the majority of Argan’s revenue,
Argan is in a very sensitive predicament.
If oil and gas prices fall even more, energy production companies may
not be able to afford the capital expenditures to fund these construction
projects, lowering Argan’s overall revenues significantly.
Lower-than-expected electrical energy demand throughout the United
States may cause some deterioration of Argan’s future financial
performance.
Increases in environment and/or construction regulations could hinder
Argan’s business operations and slow project development.
If future acquisitions or investments do not prove to be successful this
could limit Argan’s future business growth, as this is one of their main
growth strategies.
Comparable Analysis—25%
In order to find Argan’s relative value a comparable universe was constructed in
order to capture Argan’s high growth and large margins. Various heavy
construction and general contracting companies within the industrial goods sector
were screened for size, growth rates, operating segments, and margins that were
similar to those of Argan. Ultimately, seven companies were chosen and
weighted using a weighted average of metric similarity and importance.
The metrics that were used in order to determine weightings included the
companies’ operating segments, revenue growth, gross margins, EBITDA
growth, EBITDA margins, EPS growth, net margin, capital structure, and market
cap. Because of Argan’s unique positioning with high revenue growth and wide
margins, multiple metrics had to be used to accurately find its valuation in the
space. Forward comparable analysis was done for the fiscal years ending January
31, 2016 and January 31, 2017, where 2016 comparables 75% and 2017
comparables were weighted 25%. Using the EV/EBITDA for each year, a final
price target of $45.99 was achieved, suggesting the market is currently
undervaluing the company by 55.43%.
MYR Group, Inc. (MYRG)—26.01% and 24.78%
“MYR Group Inc., incorporated on January 15, 1982, is a holding company. The
Company through its subsidiaries provides specialty electrical construction
services. The Company performs construction services in two business segments:
Transmission and Distribution (T&D), and Commercial and Industrial (C&I).
T&D segment provides solutions to customers in the electric utility industry and
the renewable energy industry. The Company also provides C&I electrical
contracting services to property owners and general contractors in the western
United States”—Google Finance
Qualitatively, MYR Group Inc. specializes in a different area of construction and
contracting. While Argan specializes in building energy production plants, MYR
Group focuses on the transmission and distribution of energy as well as
Figure 20: Argan Gross Margin Projection
Source: UOIG Spreads
Figure 19: AEGN One-Year Stock Chart
Source: Yahoo Finance
One-Year Stock Chart
0
500000
1000000
1500000
2000000
2500000
3000000
$0.00
$5.00
$10.00
$15.00
$20.00
$25.00
$30.00
$35.00
Feb-15 Apr-15 Jun-15 Aug-15 Oct-15 Dec-15
Volume Adj Close 50-Day Avg 200-Day Avg
0%
5%
10%
15%
20%
25%
30%
35%
40%
2010A 2012A 2014A 2016E 2018E 2020E 2022E 2024E
Multiple Implied Price Weight
EV/Revenue 2016E $29.54 0.00%
EV/Gross Profit 2016E $39.44 0.00%
EV/EBIT 2016E $67.91 0.00%
EV/EBITDA 2016E $46.54 100.00%
EV/(EBITDA-Capex) 2016E $59.57 0.00%
Market Cap/Net Income = P/E 2016E $38.49 0.00%
Price Target $46.54
Current Price 29.59
Undervalued 57.27%
Figure 18: 2016 Multiples
Source: UOIG Spreads
9. UOIG 9
University of Oregon Investment Group February 12, 2016
commercial and industrial wiring. However, it is a holding company like Argan
and operates through its multiple subsidiaries.
Quantitatively, MYRG is of a similar size, has zero debt like Argan, and has
similar 2016 revenue expected growth rates. However, it has lower margins than
Argan. Still, it is the most comparable to Argan by the metric weightings, so it
was weighted 26.01% and 24.78% for 2016 and 2017, respectively.
Aegion Corp. (AEGN)—17.78% and 17.49%
“Aegion Corporation (Aegion), incorporated on August 17, 2011, is engaged in
providing infrastructure protection and maintenance. The Company operates
through three segments: Infrastructure Solutions, Corrosion Protection and
Energy Services. The Company is engaged in providing technologies and services
to protect against the corrosion of industrial pipelines; rehabilitate and strengthen
water, wastewater, energy and mining piping systems and buildings, bridges,
tunnels and waterfront structures, and utilize integrated professional services in
engineering, procurement, construction, maintenance, and turnaround services for
a range of energy related industries. The Company's business activities include
manufacturing, distribution, maintenance, construction, installation, coating and
insulation, cathodic protection, research and development and licensing.”—
Google Finance
Qualitatively, Aegion has an energy services segment that is very similar to
Argan’s power industry services segment, but Aegion’s operations only make up
about a third of their total revenue. Additionally, it operates in the same industry
as Argan and primarily operates in the United States, much like Argan.
Quantitatively, Aegion has similar gross margins, similar market cap, as well as
an almost identical beta. However, it has a much higher D/E ratio than Argan,
and has lower expected revenue growth. Still, because of its growth levels,
margins, and business operations, it was weighted 17.78% and 17.49% for 2016
and 2017, respectively, based on the metric weightings.
EMCOR Group, Inc. (EME)—14.33% and 13.67%
“EMCOR Group, Inc. (EMCOR), incorporated on March 31, 1987, is an electrical
and mechanical construction and facilities services firm in the United States. The
Company provides a number of building services and industrial services. Its
services are provided to a range of commercial, industrial, utility and institutional
customers through approximately 70 operating subsidiaries and joint venture
entities. It specializes in providing construction services relating to electrical and
mechanical systems in all types of non-residential and certain residential facilities
and in providing various services relating to the operation, maintenance and
management of facilities, including refineries and petrochemical plants. The
Company operates in segments: United States electrical construction and facilities
services; United States mechanical construction and facilities services; United
States building services; United States industrial services, and United Kingdom
building services.”—Google Finance
EMCOR Group, Inc. (EME) was chosen as a comparable to Argan because of its
gross margin size, a relatively similar beta, and similar net income growth.
However, it has more exposure the distribution and transmission of electrical
power instead of the generation of power. However, they also have exposure to
the procurement of lighting systems, much like Argan’s telecommunications
segment run by SMC. The majority of their business occurs in the United States.
They used to have operations within the United Kingdom, but recently withdrew
Figure 22: EME One-Year Stock Chart
Source: Yahoo Finance
One-Year Stock Chart
0
200000
400000
600000
800000
1000000
1200000
$0.00
$10.00
$20.00
$30.00
$40.00
$50.00
$60.00
Feb-15 Apr-15 Jun-15 Aug-15 Oct-15 Dec-15
Volume Adj Close 50-Day Avg 200-Day Avg
Figure 23: CBI One-Year Stock Chart
One-Year Stock Chart
0
2000000
4000000
6000000
8000000
10000000
12000000
$0.00
$10.00
$20.00
$30.00
$40.00
$50.00
$60.00
$70.00
Feb-15 Apr-15 Jun-15 Aug-15 Oct-15 Dec-15
Volume Adj Close 50-Day Avg 200-Day Avg
Source: Yahoo Finance
Multiple Implied Price Discounted Price Weight
EV/Revenue 2017E $33.90 $30.08 0.00%
EV/Gross Profit 2017E $44.02 $39.05 0.00%
EV/EBIT 2017E $56.87 $50.46 0.00%
EV/EBITDA 2017E $50.00 $44.36 100.00%
EV/(EBITDA-Capex) 2017E $58.68 $52.06 0.00%
Market Cap/Net Income = P/E 2017E $46.01 $40.82 0.00%
Price Target $44.36
Current Price 29.59
Undervalued 49.92%
Figure 21: 2017 Multiples
Source: UOIG Spreads
10. UOIG 10
University of Oregon Investment Group February 12, 2016
from the area due to poor profitability. Because of the above reasons, EMCOR
Group, Inc. was weighted 14.33% and 13.67% based on the metric weightings.
Chicago Bridge & Iron Co. (CBI)—12.96% and 10.57%
Chicago Bridge & Iron Company N.V. (CB&I), incorporated in 1889, provides a
range of services to customers in the energy infrastructure market across the
world. The Company provides various services, such as conceptual design,
technology, engineering, procurement, fabrication, modularization, construction,
commissioning, maintenance, program management and environmental services,
and also various Government services. The Company operates through four
segments: Engineering, Construction and Maintenance, which provides
engineering, procurement and construction (EPC) services for energy
infrastructure facilities, as well as integrated maintenance services; Fabrication
Services, Technology, and Environmental Solutions.”—Google Finance
Chicago Bridge & Iron Co. (CBI) was added as a comparable company because
it is one of Argan’s largest competitors. Additionally, about 50% of its business
is made up of the planning, engineering, and construction of nuclear, fossil, and
renewable energy plant project services. Like Argan, they also do the
maintenance and operation of the plants once the project is done. However, their
margins are about half of those of Argan’s, and it has negative growth rates in
2017. Finally, it has a D/E of .41, which is much higher than Argan’s D/E of 0.
Therefore, from the metric weightings Chicago Bridge & Iron Co. was given
weightings of 12.96% and 10.57% for 2016 and 2017, respectively.
Tutor Perini Corp. (TPC)—12.07% and 10.61%
“Tutor Perini Corporation, incorporated on January 5, 1918, is a construction
company engaged in providing general contracting, construction management and
design-build services to private customers and public agencies around the world.
The Company offers general contracting, pre-construction planning and project
management services, including the planning and scheduling of the manpower,
equipment, materials and subcontractors required for a project. It also offers self-
performed construction services, including site work, concrete forming and
placement, steel erection, electrical, mechanical, plumbing, and heating,
ventilation and air conditioning (HVAC). The Company operates through three
segments: Civil, Building, and Specialty Contractors.”—Google Finance
Tutor Perini Corp. (TPC) was added from the comparable universe because of its
similar market cap and revenue growth, as well as it being in the same industry as
Argan. However, it has a very high level of debt with a D/E ratio of .63, and its
beta is about 21% larger than Argan’s estimated beta. Additionally, it primarily
focuses on the construction and engineering of roads, bridges, and water treatment
facilities. Much of their work comes from government contracts. Because of this,
Tutor Perini Corp. was given a weighting of 12.07% and 10.61%.
MasTec, Inc. (MTZ)—8.83% and 13.16%
“The Company builds infrastructure projects for customers across a range of
industries. It specializes in building natural gas, crude oil and refined product
transport pipelines; underground and overhead distribution systems, including
trenches, conduits, cable and power lines, which provide wireless and wireline
communications; electrical power generation, transmission and distribution
systems; renewable energy infrastructure, including wind and solar farms, and
Figure 25: TPC One-Year Stock Chart
Source: Yahoo Finance
One-Year Stock Chart
0
500000
1000000
1500000
2000000
2500000
$0.00
$5.00
$10.00
$15.00
$20.00
$25.00
$30.00
Feb-15 Apr-15 Jun-15 Aug-15 Oct-15 Dec-15
Volume Adj Close 50-Day Avg 200-Day Avg
Figure 26: MTZ One-Year Stock Chart
Source: Yahoo Finance
One-Year Stock Chart
0
1000000
2000000
3000000
4000000
5000000
6000000
7000000
8000000
$0.00
$5.00
$10.00
$15.00
$20.00
$25.00
Feb-15 Apr-15 Jun-15 Aug-15 Oct-15 Dec-15
Volume Adj Close 50-Day Avg 200-Day Avg
Comparables Analysis Implied Price Weight
2016 Comparables 46.54 75.00%
2017 Comparables 44.36 25.00%
Price Target $45.99
Current Price 29.59
Undervalued 55.43%
Figure 24: Comparable Analysis Implied Price
Source: UOIG Spreads
11. UOIG 11
University of Oregon Investment Group February 12, 2016
compressor and pump stations and treatment plants and heavy industrial plants.
The Company installs buried and aerial fiber optic cables, coaxial cables, copper
lines, electrical and other energy distribution systems, transmission systems and
satellite dishes in a variety of environments for its customers. In connection with
its installation work, it deploys and manages network connections that involve its
customers’ hardware, software and network equipment.”—Google Finance
MasTec, Inc. (MTZ) was used as a comparable to Argan primarily to reflect the
combined exposure to oil and natural gas as well as telecommunications.
However, most of their exposure comes from the construct of oil and gas pipelines
instead of power generation. While it has somewhat similar gross margins, it has
much low er EBIT, EBITDA, and net margins. Additionally, it has much lower
growth rates for 2016E because of the fall in gas prices. Finally, it has a large
debt level and a much higher beta. From the metric weightings, MasTec was
given weightings of 8.83% and 13.16% for 2016 and 2017, respectively.
Fluor Corp. (FLR)—8.02% and 9.73%
“Fluor Corporation (Fluor), incorporated on September 11, 2000, is a holding
company. The Company, through its subsidiaries, provides professional services.
The Company provides engineering, procurement, construction, fabrication and
modularization, commissioning and maintenance, as well as project management
services. The Company is an integrated solutions provider for various industries,
including oil and gas, chemicals and petrochemicals, transportation, mining and
metals, power, life sciences and manufacturing. The Company is also a service
provider to the United States Federal Government, and it performs operations and
maintenance activities around the world for its industrial clients. The Company
operates its business in five segments: Oil & Gas, Industrial & Infrastructure,
Government, Global Services and Power.”—Google Finance
Qualitatively, Fluor Corp. was used because it is another of Argan’s main
competitors, it is in the same industry, and about 50% of its revenue comes from
oil and gas construction and maintenance services. Quantitatively, it has a similar
beta, but it has different growth rates, lower margins, and a D/E ratio of .18.
Additionally, it is much larger than Argan. For this and the reasons stated above,
Fluor Corp. was given a weighting of 8.02% and 9.73%.
Discounted Cash Flow Analysis—75%
Revenue Model
Argan, Inc. breaks their revenue out into their two segments, Power Industry
Services and Telecommunications Infrastructure. Much of their historical revenue
is very sporadic due to the contractual nature of their business operations. Argan
does not provide any color on their future operations, but does provide the current
backlog at the end of each financial term for their Power Industry Services
segment. This provides a little help on how to project their revenue streams. The
fourth quarter of 2016E was based off of the performance of the prior three
quarters, as well as some analyst expectations. 2017E was based off of the huge
backlog that Argan currently has, as well as the expected completion of two of
Argan’s major projects in the first half of 2017E, as well as the initiation of
Figure 28: Beta Table
Source: UOIG Spreads
Figure 27: FLR One-Year Stock Chart
Source: UOIG Spreads
One-Year Stock Chart
0
1000000
2000000
3000000
4000000
5000000
6000000
$0.00
$10.00
$20.00
$30.00
$40.00
$50.00
$60.00
$70.00
Feb-15 Apr-15 Jun-15 Aug-15 Oct-15 Dec-15
Volume Adj Close 50-Day Avg 200-Day Avg
Beta SE Weighting
1-Year Daily 0.89 0.13 0.00%
3-Year Daily 1.11 0.10 50.00%
5-Year Daily 1.46 0.07 50.00%
3 Year Weekly 1.18 0.19 0.00%
5 Year Weekly 1.17 0.15 0.00%
3 Year Monthly 1.04 0.57 0.00%
5 Year Monthly 1.27 0.36 0.00%
Vasicek - Comps 0.70 0.00%
Vasicek - ETF 0.57 0.00%
Hamada - Comps 0.48 0.00%
Hamada - ETF 0.37 0.00%
Argan, Inc. Beta 1.29
ImpliedPrice Undervalued/(Overvalued)
Terminal Growth Rate Terminal Growth Rate
44 2.3% 2.8% 3.3% 3.8% 4.3%
1.25 43.99 44.69 45.47 46.32 47.26
1.27 43.57 44.25 45.00 45.82 46.74
1.29 43.17 43.82 44.55 45.34 46.22
1.31 42.77 43.40 44.10 44.87 45.72
1.33 42.38 42.99 43.67 44.41 45.23
AdjustedBeta
Figure 29: Beta Sensitivity Table
Source: UOIG Spreads
12. UOIG 12
University of Oregon Investment Group February 12, 2016
multiple new projects. From there, revenue growth is expected to drop down to
15%, then 10%, then smooth down to 3% growth in the terminal year. The
revenue was smoothed out instead of projected in a cyclical fashion because it is
very difficult to project contract wins. Factors that will influence revenue growth
in the future will be strategic acquisitions, geographical expansion within the
United States and globally, and an increased demand for natural gas-fired plants.
The earlier forecasted years are based on the expected completion of projects and
current backlog.
Cost of Revenues Model
Cost of revenue is made up of the tools and labor needed in the engineering and
construction of the power industry services projects as well as the materials for
the telecommunications services projects. Most of the materials used in the
projects that Argan conducts are provided by the customer, however in some cases
Argan will provide the materials. Cost of revenue is divided into power industry
services and telecommunications services. Each of these segments of the cost of
revenue were projected as a percentage of their respective revenue segments. The
specific percentages used were smoothed out through terminal year, where a value
slightly higher than historical averages was used. As power plants become more
efficient and technologically advanced, Argan’s projects will become more
expensive and will require more experienced workers and better tools. Therefore,
it is fair to expect that the cost of revenues will increase slowly to historical levels.
Beta
Argan’s beta calculations provided a strong collection of values that had low
standard errors. All of the weighting for the beta fell on the three and five year
daily beta calculations because they had the lowest standard errors. Therefore, a
final beta calculation of 1.29 used.
Depreciation and Amortization and PP&E
Seen from historical values, PP&E has stayed at relatively constant levels, so
PP&E purchases were projected to trend towards historical averages. D&A was
projected off a percentage of revenue instead of beginning PP&E because of the
large increases in capital expenditures and acquisitions going into the terminal
year would cause a huge increase in D&A if projected off of beginning PP&E.
Net Working Capital
Almost all current assets and liabilities were trended towards historical averages
through days outstanding. Costs and Estimated Earnings in Excess of Billings
was projected as a percentage of revenue towards historical averages, as were
Prepaid Expenses, and Accrued Expenses. Accounts payable were trended down,
as seen by recent historical trends. Billings in Excess of Costs and Estimated
Earnings was trended down to historical averages.
Capital Expenditures and Acquisitions
Capital expenditures were projected as a percentage of revenue towards historical
averages, while being able to support the growth that is currently projected.
Acquisitions were projected as a percentage of revenue. The company expects to
make strategic and opportunistic acquisitions every three years, however
acquisitions were smoothed into the terminal year to prevent large disruptions in
the cash flows as many of the costs associated with acquisitions are spread across
0%
1%
2%
3%
4%
5%
6%
7%
8%
9%
0
10000
20000
30000
40000
50000
60000
70000
2010A 2012A 2014A 2016E 2018E 2020E 2022E 2024E
$inThousands
Selling, General, and Administrative % of Revenue
Figure 30: SG&A Expense
Source: UOIG Spreads
0
200
400
600
800
1,000
1,200
2010A 2011A 2012A 2013A 2014A 2015A
Thousands($)
Depreciation Amortization
Figure 31: Historical D&A
Source: Argan 10-K
ImpliedPrice Undervalued/(Overvalued)
Terminal Growth Rate Terminal Growth Rate
44 2.0% 2.5% 3.0% 3.5% 4.0%
5.45% 47.24 48.12 49.09 50.17 51.38
5.95% 44.92 45.66 46.47 47.37 48.37
6.45% 42.85 43.47 44.16 44.92 45.75
6.95% 40.99 41.52 42.11 42.75 43.45
7.45% 39.31 39.77 40.27 40.81 41.41
MarketRisk
Premium
Figure 32: Market Risk Premium Sensitivity Table
Source: UOIG Spreads
13. UOIG 13
University of Oregon Investment Group February 12, 2016
multiple years. Argan is very experienced with strategic acquisitions and has a
large cash balance to allow them to make these without taking out debt.
Recommendation
Based upon the future demand natural gas, the phasing out of dated coal and
nuclear plants, and the expansion of renewable energies, Argan will continue to
expand their industrial and energy production construction across the United
States. With their proven management team, Argan will continue to make
strategic acquisitions that offer complimentary services to its current business
operations and provide great standalone investments to boost topline revenue.
Finally, with a consistent annual dividend, a huge cash balance, and great future
revenue growth, Argan is currently at a steep discount. Weighting the discounted
cash flow analysis 75% and the comparable analysis 25%, a final price target of
$44.62 was reached and a strong BUY is recommended for all portfolios.
Figure 33: Final Implied Price Target
Source: UOIG Spreads
Source Implied Price Weighting
Discounted Cash Flow Analysis $44.16 75%
Comparable Analysis 45.99 25%
Weighted Implied Price $44.62
Current Price $29.59
Undervalued 50.79%
25. UOIG 25
University of Oregon Investment Group February 12, 2016
Appendix 11 - Sources
Argan 10-K
Argan 10-K
Argan Q3 2016 Earnings Presentation
Argan Investor Relations
Argan Website
Business Wire
FactSet
Financial Visualizations Website
Google Finance
IBIS World
Morningstar
Seeking Alpha
US Energy Information Administration
United States Census Bureau
Wall Street Journal
Yahoo Finance