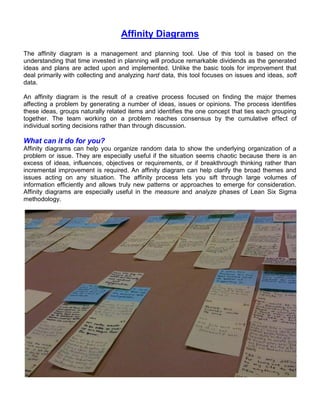
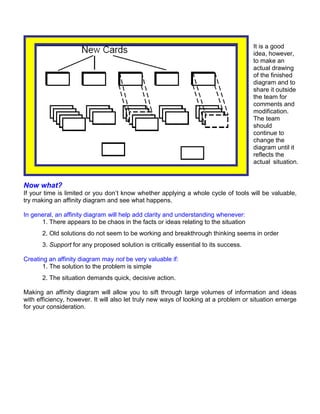
The affinity diagram is a management tool used to organize ideas and issues into groupings based on natural relationships. It involves generating ideas on individual cards, arranging the cards into groupings, and identifying a header card for each grouping that describes the central unifying theme. Affinity diagrams help make sense of complex problems by allowing patterns to emerge from large amounts of information. They are useful for planning, problem solving, and process improvement efforts.
Affinity Diagrams provides and overview of the Lean Six Sigma Tool. Lean Six Sigma Article by Master Black Belt, Steven Bonacorsi, Vice President at the AIT Group.
The document provides a template for a Project Action Team Charter that can be used to guide the creation of charters for process improvement teams. It includes sections for identifying the team and improvement opportunity, objectives, metrics, milestones, resources, boundaries, stakeholders, and a communication plan. The template is intended to clearly define the team's purpose and ensure agreement between the executive sponsor, team leader, and facilitator on what the team aims to accomplish.
The Project Charter template is an internal document created by the Project Manager in the initiation phase to recognize the project and begin planning. It captures high-level scope, deliverables, assumptions, and aims to provide foundational information for detailed planning in the definition phase. The charter is not intended as a formal customer contract, but rather serves to acknowledge the project and kick off the planning process required to achieve its goals.
This document provides a project management plan template for an economic development department. It includes sections on the project introduction and background, executive summary, scope, work breakdown structure, cost and staffing management plans, stakeholder analysis, implementation plan, risk management plan, procurement management plan, log frame, evaluation plan, and annexures including a target setting worksheet and reporting template. The template provides guidance on the key elements to include in each section to effectively plan and manage the project.
Cause-and-effect diagrams, also known as fishbone diagrams or Ishikawa diagrams, are tools used to explore and display the potential causes of quality problems or other effects. They involve drawing a diagram with the effect at the head of the fish and primary causes as bones extending from the backbone. Secondary and tertiary causes are drawn as smaller bones extending from the primary causes. The diagrams help identify, define, and display the major factors influencing a process and their relationships to better understand problems and their possible solutions.
Dot plots are a tool for visually representing variation in a process. They involve measuring a characteristic, recording the results, and plotting each data point as a dot along a scale. The shape that emerges can provide insights into the sources of variation. Common shapes include symmetrical, skewed, multi-modal, plateaued, and those with isolated peaks. Comparing dot plots over time can track process improvement.
This document advertises the 14th Annual PEX Week conference from January 21-25, 2013 in Orlando, Florida. Over 45 senior process leaders from major companies will speak, including executives from Citi, Kraft Foods, Nationwide, and Xerox. The event will focus on innovating business processes, reaching process excellence through various tools and industry forums, and benchmarking process improvement strategies. Attendees will gain new ideas and networking opportunities to further their process improvement programs.
The PEX Corporate Leaders Boardroom event brings together C-Suite executives to discuss key issues for driving process excellence and business transformation in 2013, including redefining quality, leadership engagement, change management, and strategic alignment. Through an exclusive boardroom-style discussion format, participants can engage with peers, develop leadership skills, and focus on operational challenges to formulate a forward vision and competitive strategy for their organizations. Previous attendees of the event include senior executives from major companies across various industries.
This document provides information about sponsoring an event called PEX Week hosted by PEX Network. It discusses the benefits of sponsorship, including access to senior decision makers from major companies. PEX Week is described as the largest annual gathering of process professionals and a chance for sponsors to meet prospects and current partners. Details are given about the audience breakdown by region, job function, company size and industry to help sponsors understand the potential customers that will be attending.
The document summarizes an invitation-only boardroom discussion event for senior process and technology executives called the IBM Corporate Leaders' Boardroom. It will be held alongside PEX Week 2013 in Orlando, Florida and hosted by IBM. The boardroom format allows an informal discussion of key issues facing executives in aligning people, processes, and technology to drive revenue growth and customer-centric strategies. Discussion topics will include leveraging innovation for global growth, enabling customer-centricity, and using insights to drive sustainable competitive advantages. Attendees in 2012 included executives from Thomson Reuters, UnitedHealth Group, and The McGraw-Hill Companies.
IQPC provides B2B inbound marketing services through their portals and business conferences. This case study details how they helped two clients, i-nexus and Villanova University, generate hundreds of qualified leads. For i-nexus, IQPC developed a content marketing strategy around webinars and whitepapers on their software that generated over 1,000 leads over six weeks. For Villanova University, IQPC promoted a whitepaper on Lean and Six Sigma concepts that was downloaded over 700 times, in addition to banner ads generating over 1,100 clicks.
Process Excellence At Credit Agricole Corporate & Investment Bank Case StudyNat Evans
Credit Agricole Corporate & Investment Bank launched a Lean Six Sigma initiative to improve efficiency. They identified the Cash Payments process as an opportunity, as it was high volume with low revenues. They applied Lean Six Sigma tools to redesign the front-to-back process and organizational structure, reducing non-value-added activities. This resulted in over 10% productivity gains through realigning roles, reducing manual work, and improving client focus. Key success factors included cross-functional participation and validating solutions with operational staff.
This document is the table of contents for a book titled "Outside-In. The Secret of the 21st Leading Companies" by Steve Towers. The table of contents lists 13 chapters in the book, including chapters on business transformation, process management, successful customer outcomes, and transforming processes. The final chapter is titled "Lord Nelson and Successful Customer Outcomes (SCO)".
Paul Nelson discusses trends in Lean Six Sigma (LSS) implementation in the pharmaceutical industry. While LSS tools remain the same, focus has shifted from cost savings to supporting innovation and speed to market. LSS is being applied to new areas like mergers and acquisitions. Common failures occur when initiatives lack senior leadership, focus on tools over culture change, or fail to deliver quick results. Adoption of practices for process understanding from mature industries shows promise. Nelson cites Failure Modes and Effects Analysis as a simple but effective tool for managing risk when driven by senior leaders.
A scatter diagram shows the correlation between two variables through data points plotted on a graph. Strong correlations are indicated when data points appear clustered along an imaginary line. The scatter diagram document provides guidance on constructing and analyzing scatter diagrams to understand relationships between process variables and determine if suspected cause-effect relationships exist. Key steps include collecting paired data, plotting it on a graph with the potential cause on the x-axis and effect on the y-axis, and using a sign test table to determine if correlations are statistically significant. Stratifying data and considering alternative variable ranges may provide additional insights into correlations.
Pareto charts are a tool used to identify the most significant problems in a process. They graphically display problem categories from highest to lowest value to show which few problems make up the majority of issues. To create a Pareto chart, problems are classified and tallied, then categories are arranged from highest to lowest occurrence and displayed as bars on a chart. The chart is used to target addressing the biggest issues first to produce the greatest improvements.
A histogram is a tool that uses a bar chart to visualize the variation in a process. It shows the central value and dispersion of data on either side. The shape and size of dispersion can identify hidden sources of variation. Different histogram shapes provide insights - a symmetrical bell shape occurs most often, while skewed, multi-modal, plateau, or twin peak shapes indicate non-normal distributions and opportunities to reduce variation. Examining histograms is useful for process improvement in Lean Six Sigma.
The document discusses the benefits of Lean Six Sigma for employees. It notes that while top-down support is important for deployment, sustained success also depends on employee commitment. To gain employee buy-in, companies should define "WIIFE - What's In It For Employees" and identify change leaders to communicate benefits. Recognition for generating results and linking Lean Six Sigma to performance reviews can further motivate employees. The document also addresses challenges with low mix production models and potential future applications of Lean Six Sigma such as in marketing, accounting, education and addressing social and environmental issues.
The Path To Operational Excellence 5 Components Of SuccessNat Evans
The document discusses operational excellence and provides a definition and framework. It argues that operational excellence must be strategically focused on areas where an organization can outperform competitors to provide competitive advantage. It emphasizes that leadership must select a tight focus area and guide implementation, and that operational excellence initiatives should align with strategic goals to ensure support and sustainability. The framework identifies five drivers of operational competitive advantage: safety, asset productivity, human capabilities, process excellence, and supply chain management.
Empowering Front Line Managers By Professionalizing Operations ManagementNat Evans
Front-line managers are critical to organizational performance but often too busy with non-managerial tasks. Empowering them through a professional operations management approach like Active Operations Management (AOM) can improve performance by giving managers more control and reducing workload. AOM has helped various organizations increase productivity by at least 30% by focusing on methods, skills, and tools to transform management style from top-down to collaborative.
Leadership Essentials For Process ProfessionalsNat Evans
This document discusses essential leadership skills for leading process improvement initiatives. It contains an introduction and four articles on leadership topics. The introduction provides an overview of the compilation and its goal of sharing practical leadership advice from experienced practitioners. The first article discusses five essential leadership qualities: perspective, respect, humility, active listening, and avoiding a "superhero" complex. It argues that success depends on creating an environment where teams can flourish through collaboration. The other articles provide advice on questions leaders should ask before starting improvement, interview leadership skills, and habits of effective leaders. The compilation aims to bridge the gap between theoretical leadership concepts and practical application in process improvement.
Creating Winning Businesses Deming’S System Of Profound KnowledgeNat Evans
This document discusses Deming's system of profound knowledge and systems thinking. It begins by introducing Deming's work identifying common management practices that can destroy companies, such as incentives and pay-for-performance targets. It then discusses the importance of systems thinking and having a clear organizational aim. Examples of effective aims from well-known companies are provided. The document argues that committed individuals and a shared vision are needed to enact systems thinking. It also discusses forces that can destroy a system, such as extrinsic motivation and competition between groups. Finally, it advocates using flow diagrams rather than traditional organizational charts to help individuals understand how their work fits within and impacts the larger organizational system.
Perspectives On Business Process ManagementNat Evans
The document discusses different perspectives on business process management (BPM) from four main groups: end users, IT, system providers, and risk/compliance officers. Each group has different needs from process models. End users need detailed instructions, IT needs to support the business, system providers need accurate configurations, and risk officers need governance. There is often confusion when these groups discuss processes without understanding each other's perspectives. The document proposes using colored hats - orange, white, blue, and red - to represent each group's view and needs. It argues for a shared process model that links to related systems and information to support all perspectives while using a common business-focused visualization.
The document discusses calculating the return on investment (ROI) for implementing Business Process Management (BPM). It identifies direct benefits like cost savings from improved efficiencies and indirect benefits like easier change management. The ROI is calculated by tracking cost savings from BPM over both the short term (1 year) and long term (5 years). An incremental approach to adopting BPM is recommended to start with a small scope that can demonstrate impact before broader rollout.
The document discusses how emphasizing the human/people side of process changes is important for success. It notes that people are the hardest part of business changes and that stakeholders need to play a role. It provides an example of a company that improved processes by focusing on the user experience and involving process participants in the change.
The New Frontier For Business Agility Intelligent BpmNat Evans
The document introduces Sequence Kinetics, an Intelligent Business Process Management Suite that goes beyond classic BPM suites. It incorporates capabilities like process optimizing analytics, dynamic process change, user experience tools, an app studio, case management and more using its unique HotChange technology. HotChange allows processes to be modified in the fastest way possible without halting processes. Sequence Kinetics enables more intelligent, agile and optimized business operations through features like runtime process analytics, dynamic task routing, real-time process and rule changes, and rich user experiences.
The New Frontier For Business Agility Intelligent Bpm
Affinity Diagrams
1. Affinity Diagrams
The affinity diagram is a management and planning tool. Use of this tool is based on the
understanding that time invested in planning will produce remarkable dividends as the generated
ideas and plans are acted upon and implemented. Unlike the basic tools for improvement that
deal primarily with collecting and analyzing hard data, this tool focuses on issues and ideas, soft
data.
An affinity diagram is the result of a creative process focused on finding the major themes
affecting a problem by generating a number of ideas, issues or opinions. The process identifies
these ideas, groups naturally related items and identifies the one concept that ties each grouping
together. The team working on a problem reaches consensus by the cumulative effect of
individual sorting decisions rather than through discussion.
What can it do for you?
Affinity diagrams can help you organize random data to show the underlying organization of a
problem or issue. They are especially useful if the situation seems chaotic because there is an
excess of ideas, influences, objectives or requirements, or if breakthrough thinking rather than
incremental improvement is required. An affinity diagram can help clarify the broad themes and
issues acting on any situation. The affinity process lets you sift through large volumes of
information efficiently and allows truly new patterns or approaches to emerge for consideration.
Affinity diagrams are especially useful in the measure and analyze phases of Lean Six Sigma
methodology.
2. How do you do it?
1. The first step is to assemble the right team.
The team should consist of five or six people who have knowledge about the situation to be
considered. They should be relatively familiar with each other and accustomed to working together
and should “speak the same language,” but care should be taken not to bring together the same
old people to work on the same old problem. Include people with valuable input who may not have
been included in the past. If the team needs specific information beyond the scope of the
members’ knowledge, the team should draw in resource people as temporary team members.
2. Phrase the issue to be considered.
The affinity process seems to be most effective if the issue is loosely or vaguely stated. The more
explanation or limitation in the issue statement, the more likely the thought process will be
constrained. The statement should be neutral to avoid limiting or directing responding ideas.
For example, “How are we going to fix our quality problems?” might produce a fuller and more
valuable collection of responses if rephrased “What are the issues affecting product quality?”
When you have decided the phrasing of the statement, write it on the top of a flipchart or board so
that it is visible to the group.
3. Generate and record ideas.
Traditional guidelines for brainstorming:
• No criticism or discussion of ideas
• Generate many ideas in a short time
• Everyone participates
• Record the ideas exactly as spoken and not as
interpreted by the recorder.
One technique is to have team members silently record their ideas on 3x5 cards or Post-it™ notes
for some amount of time. Members can then take turns offering ideas one-at-a-time for the
recorder to write on a flip-chart or board. As the ideas are recorded, other team members can use
those ideas to help generate additional ideas and additional cards.
To be most useful, idea statements should be:
• Concise, about five to seven words
• Unambiguous, at least one noun and one verb
• Legible, printed neatly, one idea to a card
Another technique is to generate ideas and have the recorder write them directly on a flip-chart or
board (without having team members first write them on cards). After all the ideas have been
recorded, the team would then transfer them to cards.
3. 4. Display the completed idea cards.
Randomly lay
out the cards so
that all the team
members can
see them.
5. Arrange the cards in natural groupings.
The purpose of this step is to collect ideas that go with each other. In silence, all team members
should simultaneously begin moving idea cards, collecting and arranging in columns the cards
that each person believes belong together.
All the cards
should remain
visible during
this process so
that everyone
can consider and
reconsider the
arrangement as
it emerges.
4. If cards are redundant, overlap them but in such a way that both can be read.
Team members should freely change cards between groupings or create new groupings as they
feel appropriate.
Team members are allowed to disagree with a placement by making a new placement or returning
to a previous one. Back and forth moves may occur for some time until the team settles on an
arrangement that is acceptable to everyone.
Some cards may be loners that do not seem to fit in any grouping. They should be left that way
rather than try to force-fit them into a grouping.
6. Create headers.
Look for a card in each grouping that describes the central idea that ties the whole group together.
In many cases that central idea will not exist yet on a card. If it does not, the team should decide
on the central idea and create a concise, usually three to five words, header card for that grouping.
While silence is important for sorting, discussion should be used for selecting or creating headers.
If one or more groupings are unusually large, look for sub-groupings within the larger groups. Sub-
groupings should also have headers. Resist the temptation to create endless groupings and sub-
groupings. Keep the number of headers between five and ten, if at all possible.
7. Draw the finished diagram.
Your finished diagram could simply be Post-it™ notes stuck to flip-chart paper with lines
containing and connecting the groupings or 3x5 cards pinned or taped to the wall.
5. It is a good
idea, however,
to make an
actual drawing
of the finished
diagram and to
share it outside
the team for
comments and
modification.
The team
should
continue to
change the
diagram until it
reflects the
actual situation.
Now what?
If your time is limited or you don’t know whether applying a whole cycle of tools will be valuable,
try making an affinity diagram and see what happens.
In general, an affinity diagram will help add clarity and understanding whenever:
1. There appears to be chaos in the facts or ideas relating to the situation
2. Old solutions do not seem to be working and breakthrough thinking seems in order
3. Support for any proposed solution is critically essential to its success.
Creating an affinity diagram may not be very valuable if:
1. The solution to the problem is simple
2. The situation demands quick, decisive action.
Making an affinity diagram will allow you to sift through large volumes of information and ideas
with efficiency, however. It will also let truly new ways of looking at a problem or situation emerge
for your consideration.
6. This is an example of how one team used the affinitization process. Their objective was to define a current
best practice. This diagram shows the main blocks and header cards they developed.
Steven Bonacorsi is the President of the International Standard for Lean Six
Sigma (ISLSS) and Certified Lean Six Sigma Master Black Belt instructor and
coach. Steven Bonacorsi has trained hundreds of Master Black Belts, Black Belts,
Green Belts, and Project Sponsors and Executive Leaders in Lean Six Sigma
DMAIC and Design for Lean Six Sigma process improvement methodologies.
Author for the Process Excellence Network (PEX Network
/ IQPC). FREE Lean Six Sigma and BPM content
International Standard for Lean Six Sigma
Steven Bonacorsi, President and Lean Six Sigma Master Black Belt
47 Seasons Lane, Londonderry, NH 03053, USA
Phone: + (1) 603-401-7047
Steven Bonacorsi e-mail
Steven Bonacorsi LinkedIn
Steven Bonacorsi Twitter
Lean Six Sigma Group