Download to read offline
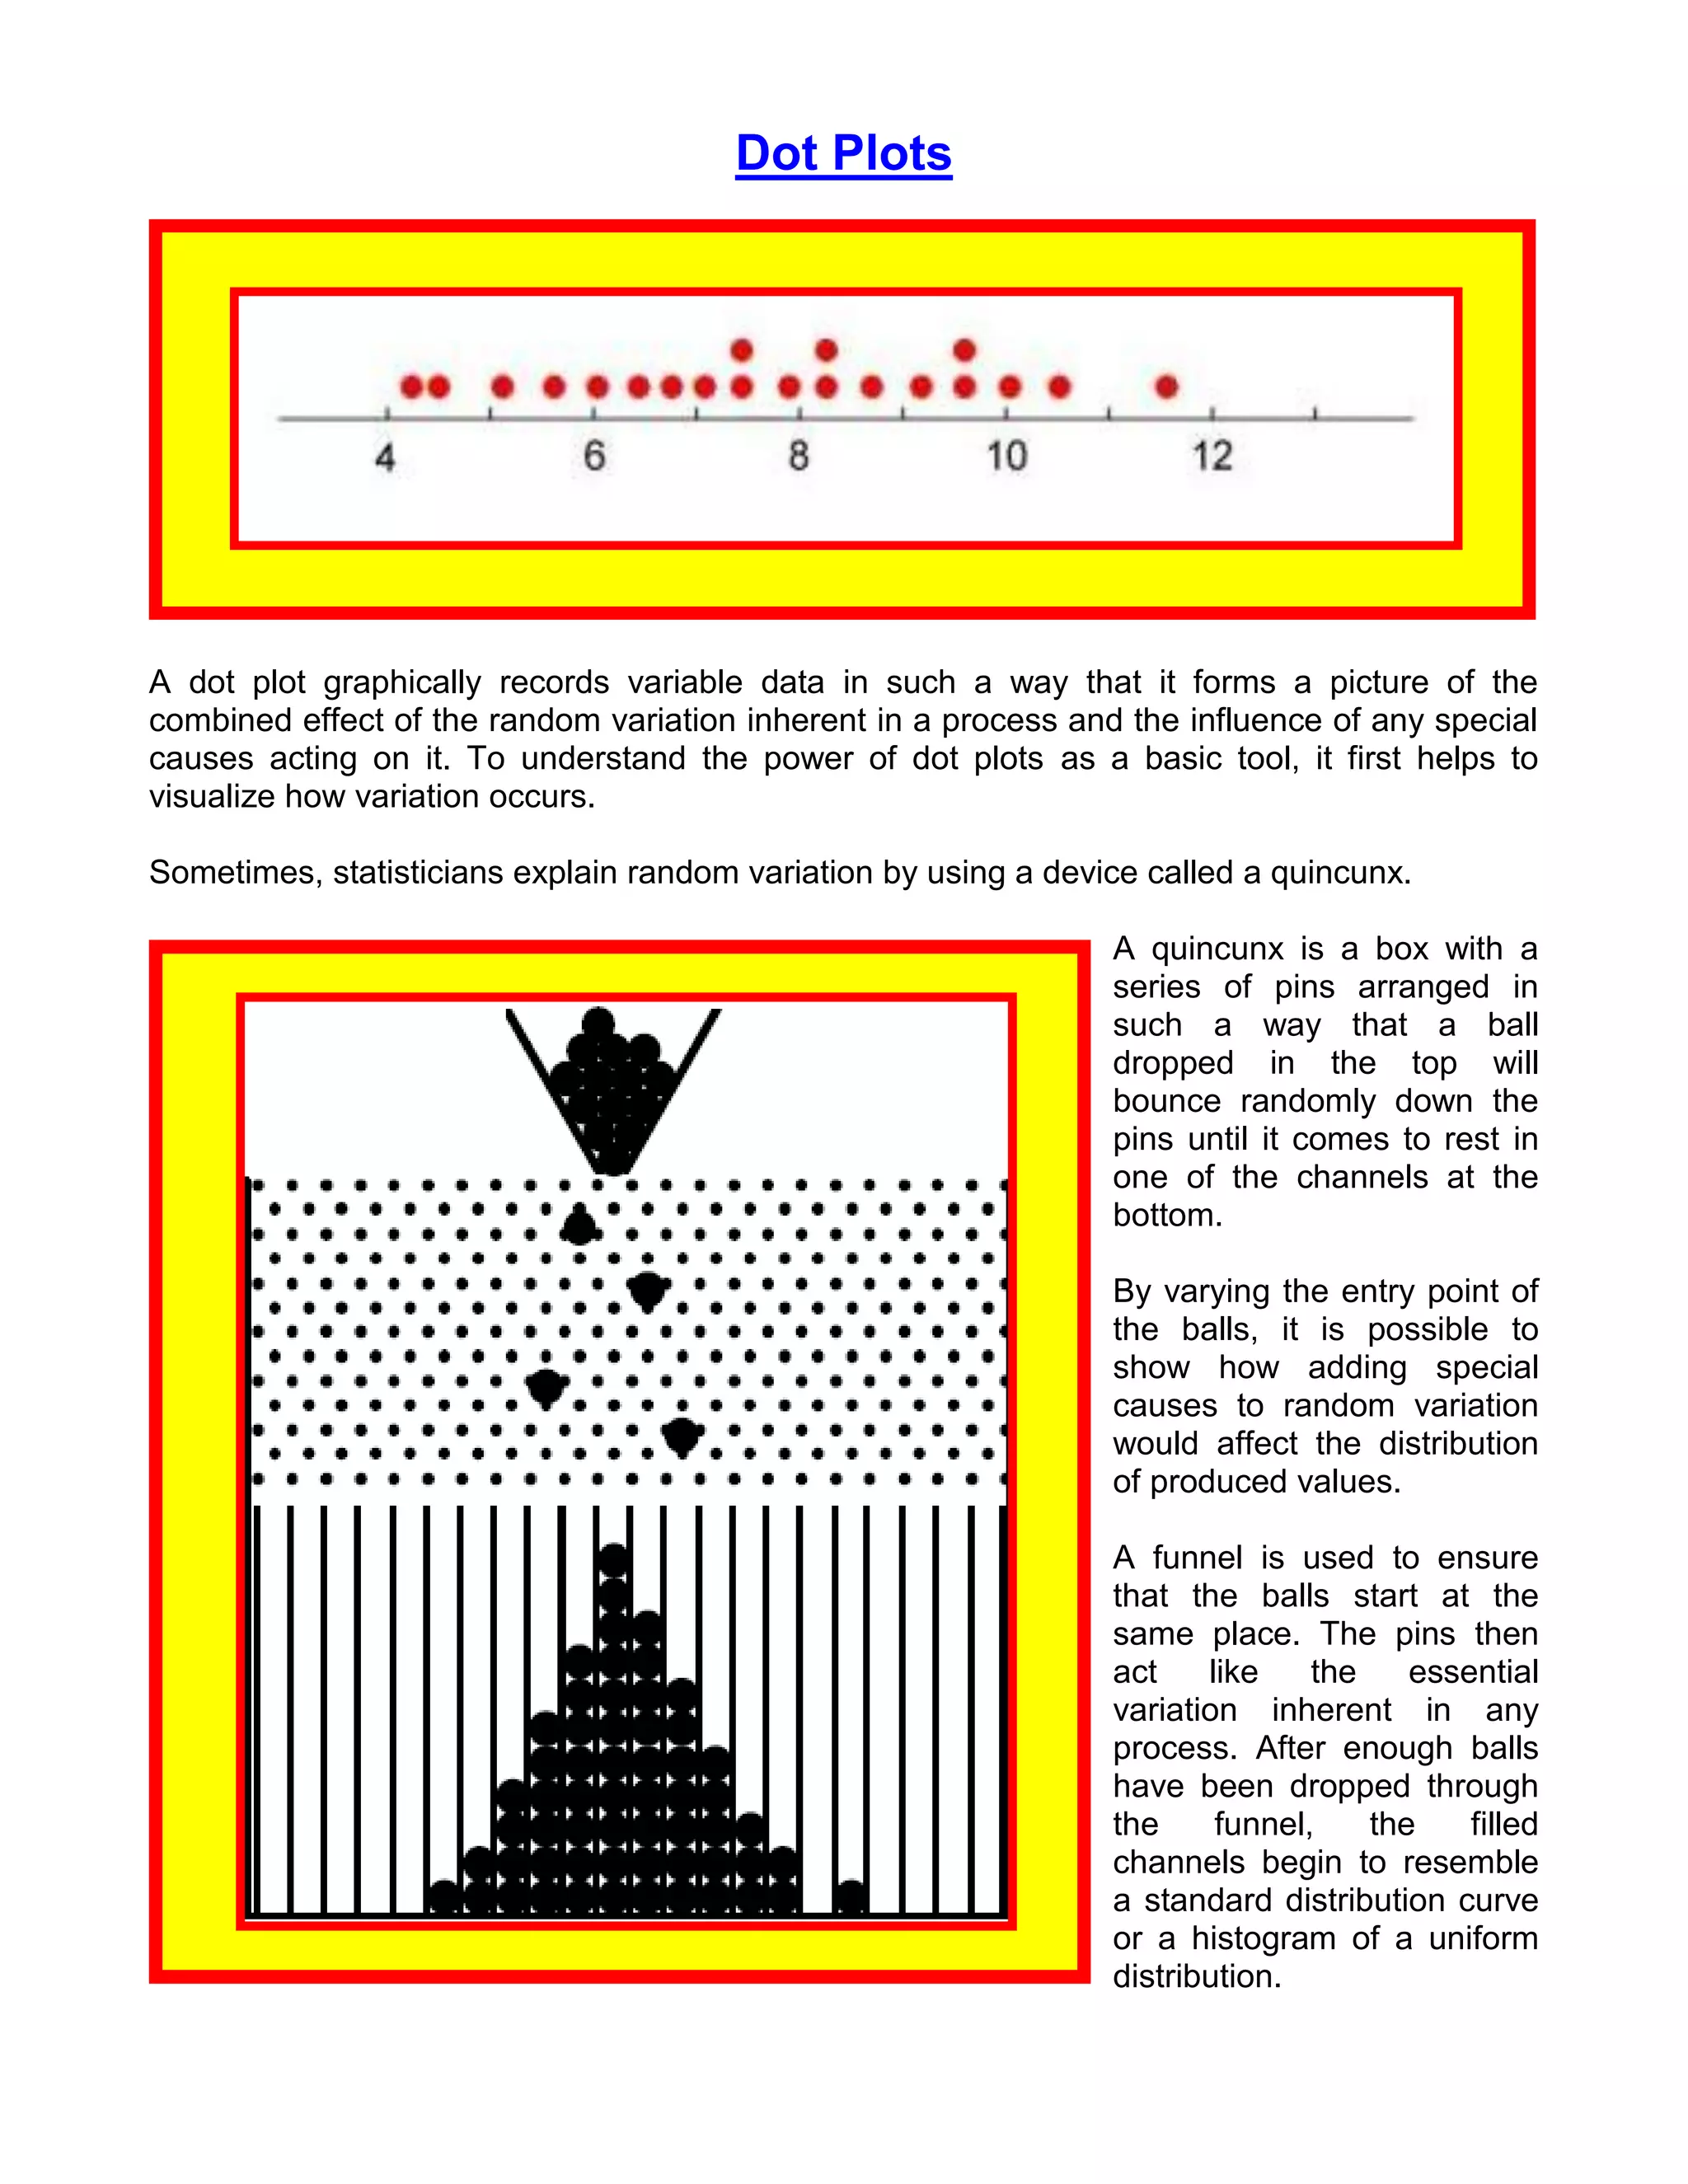
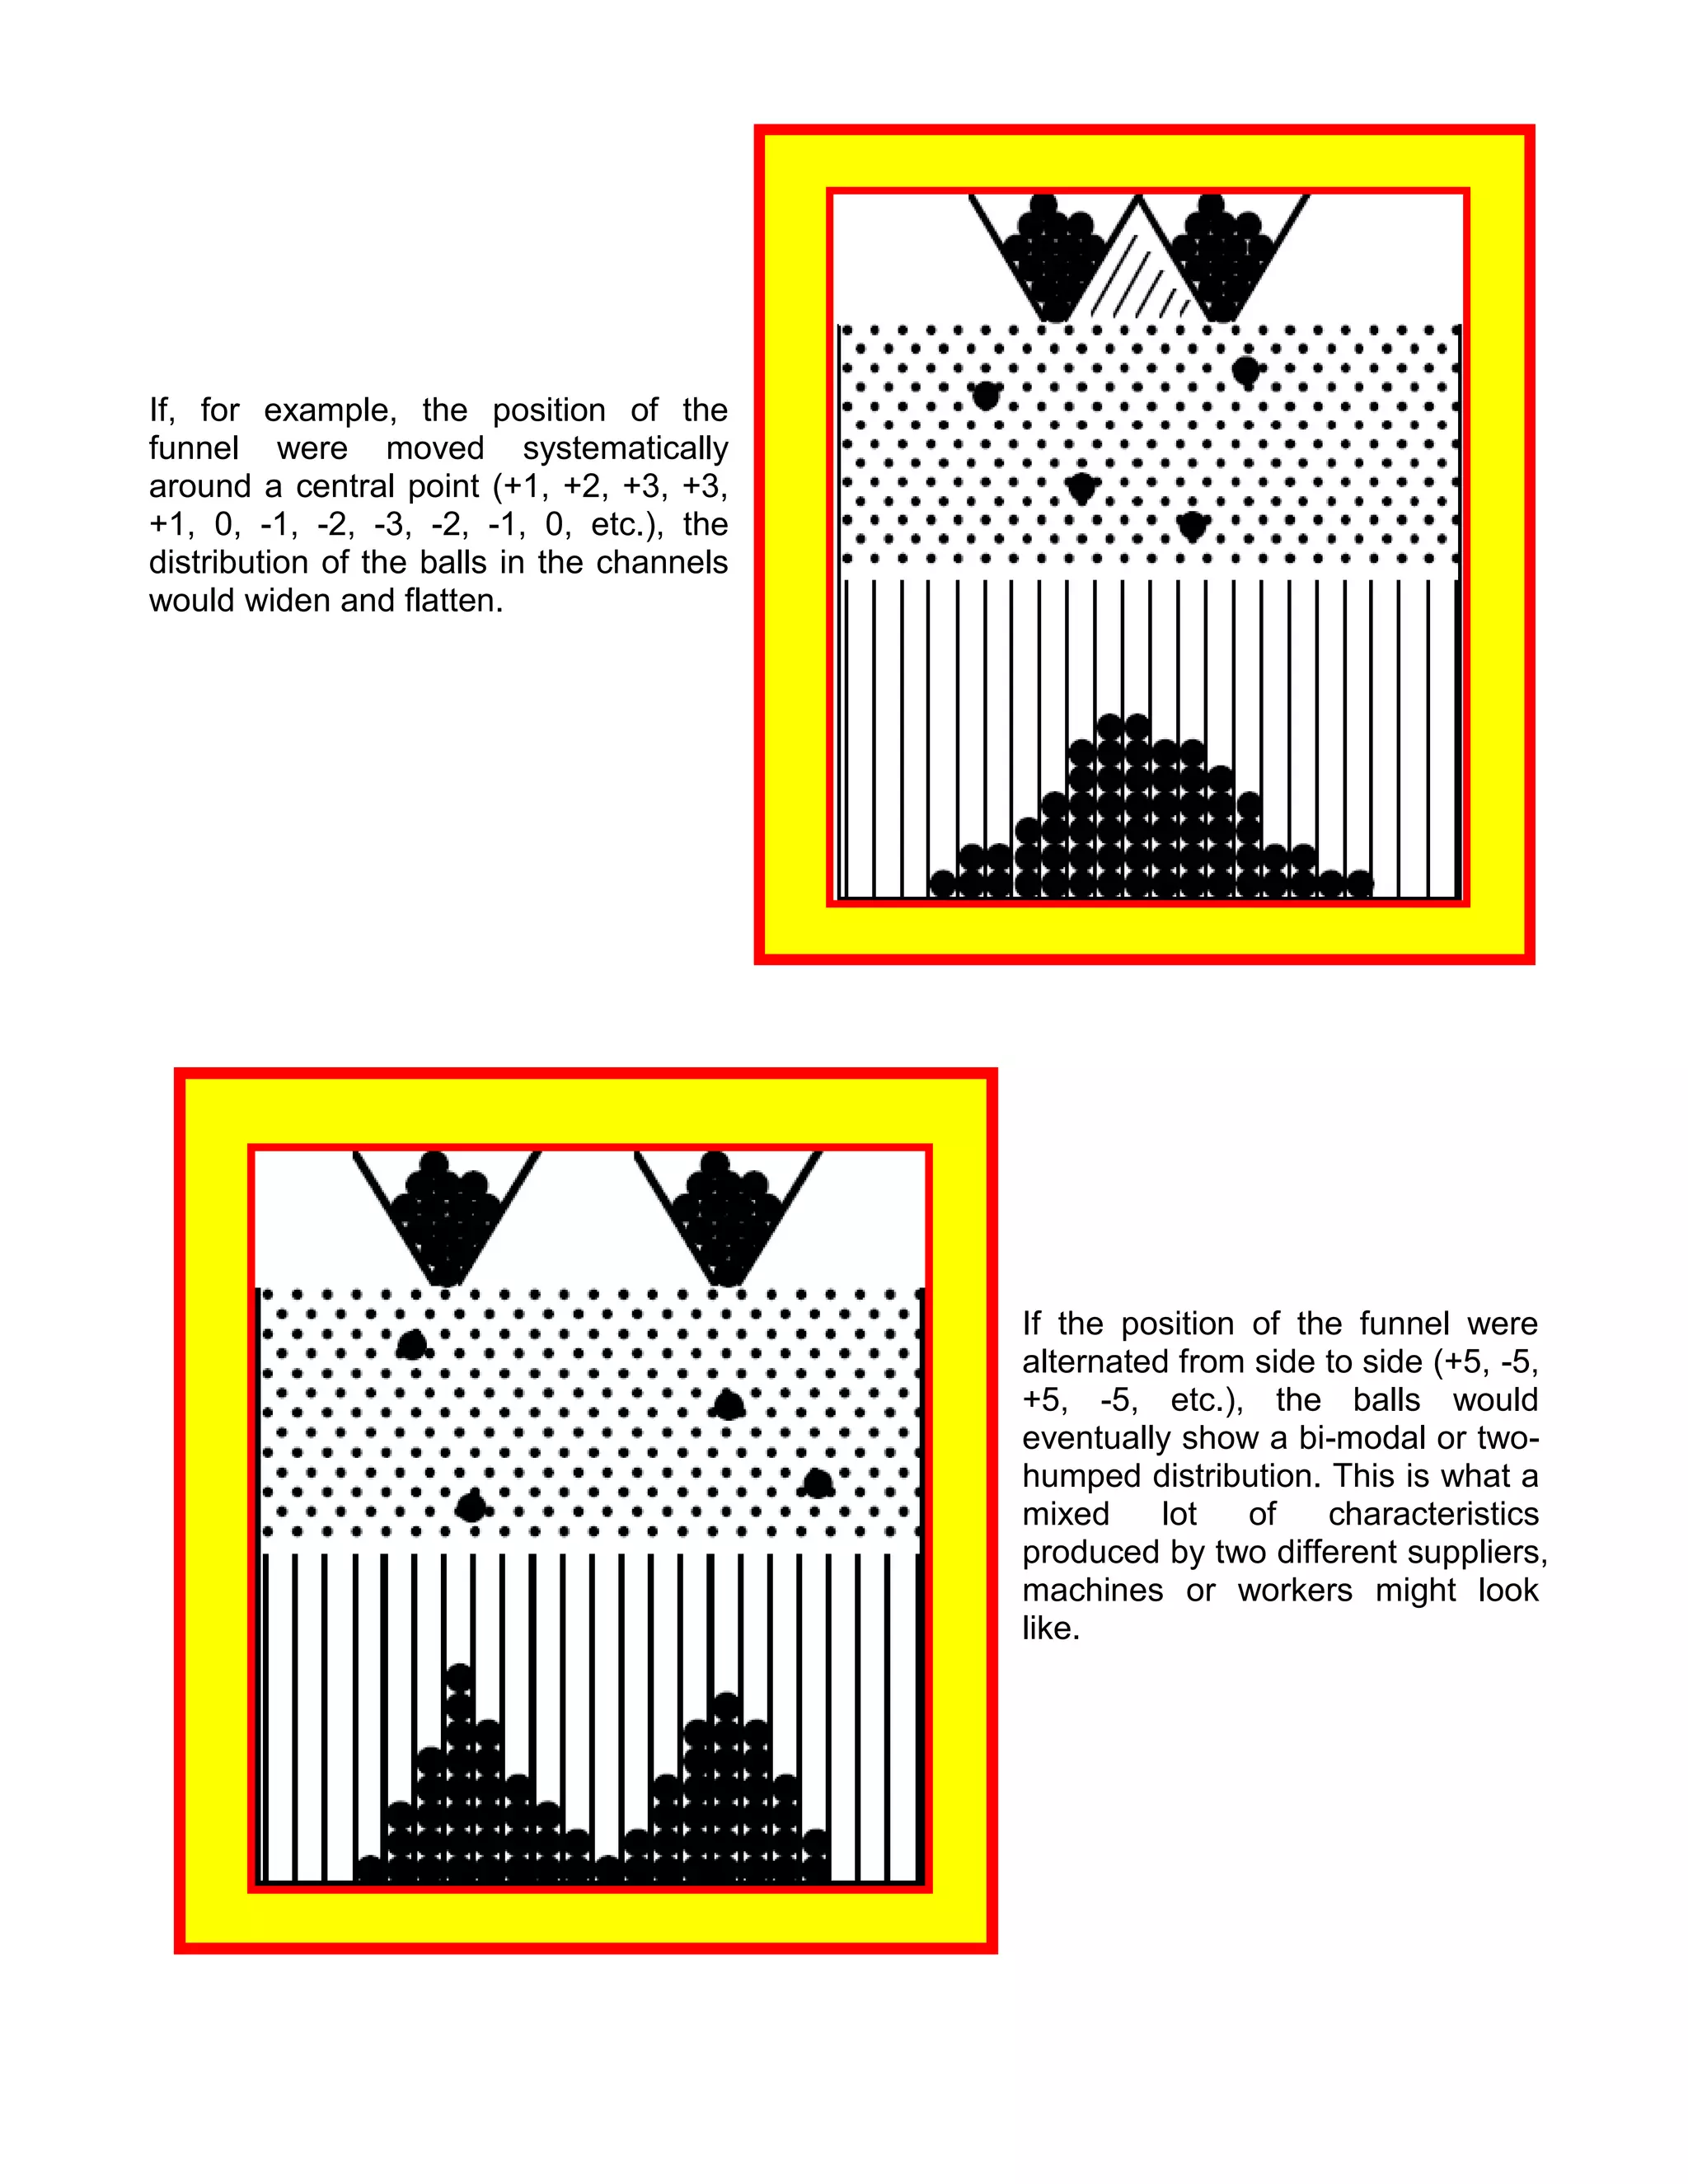
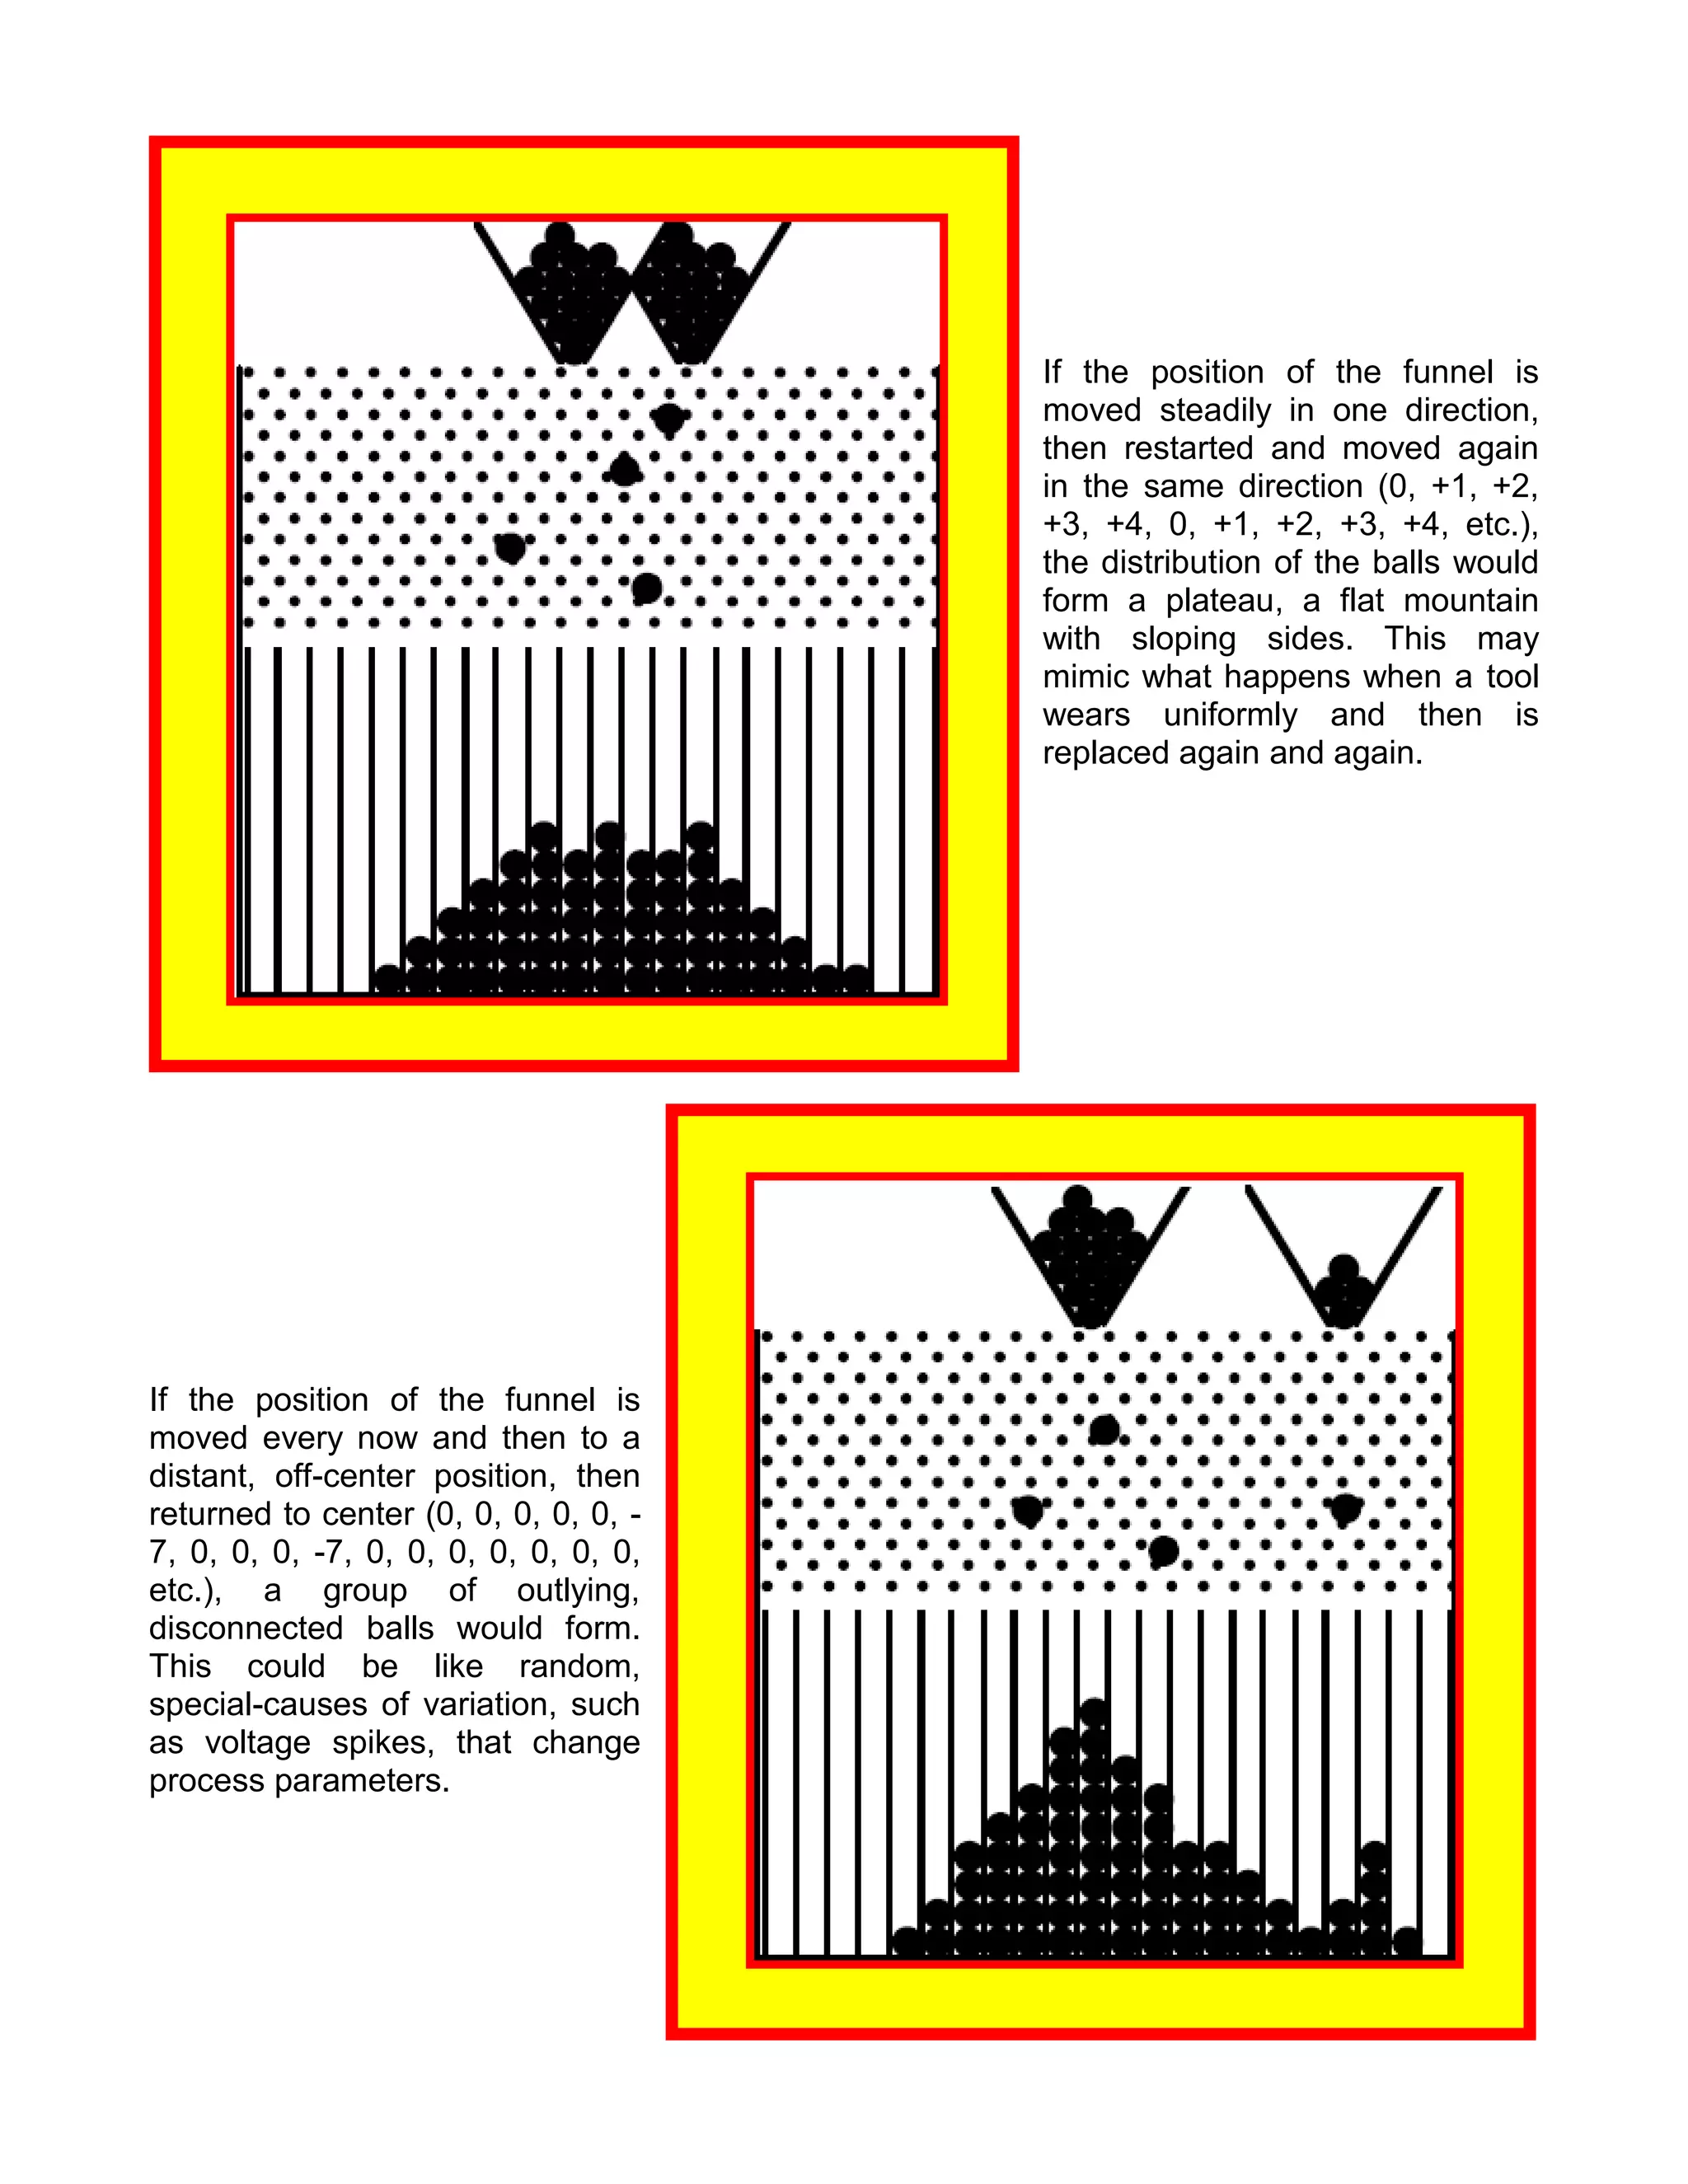
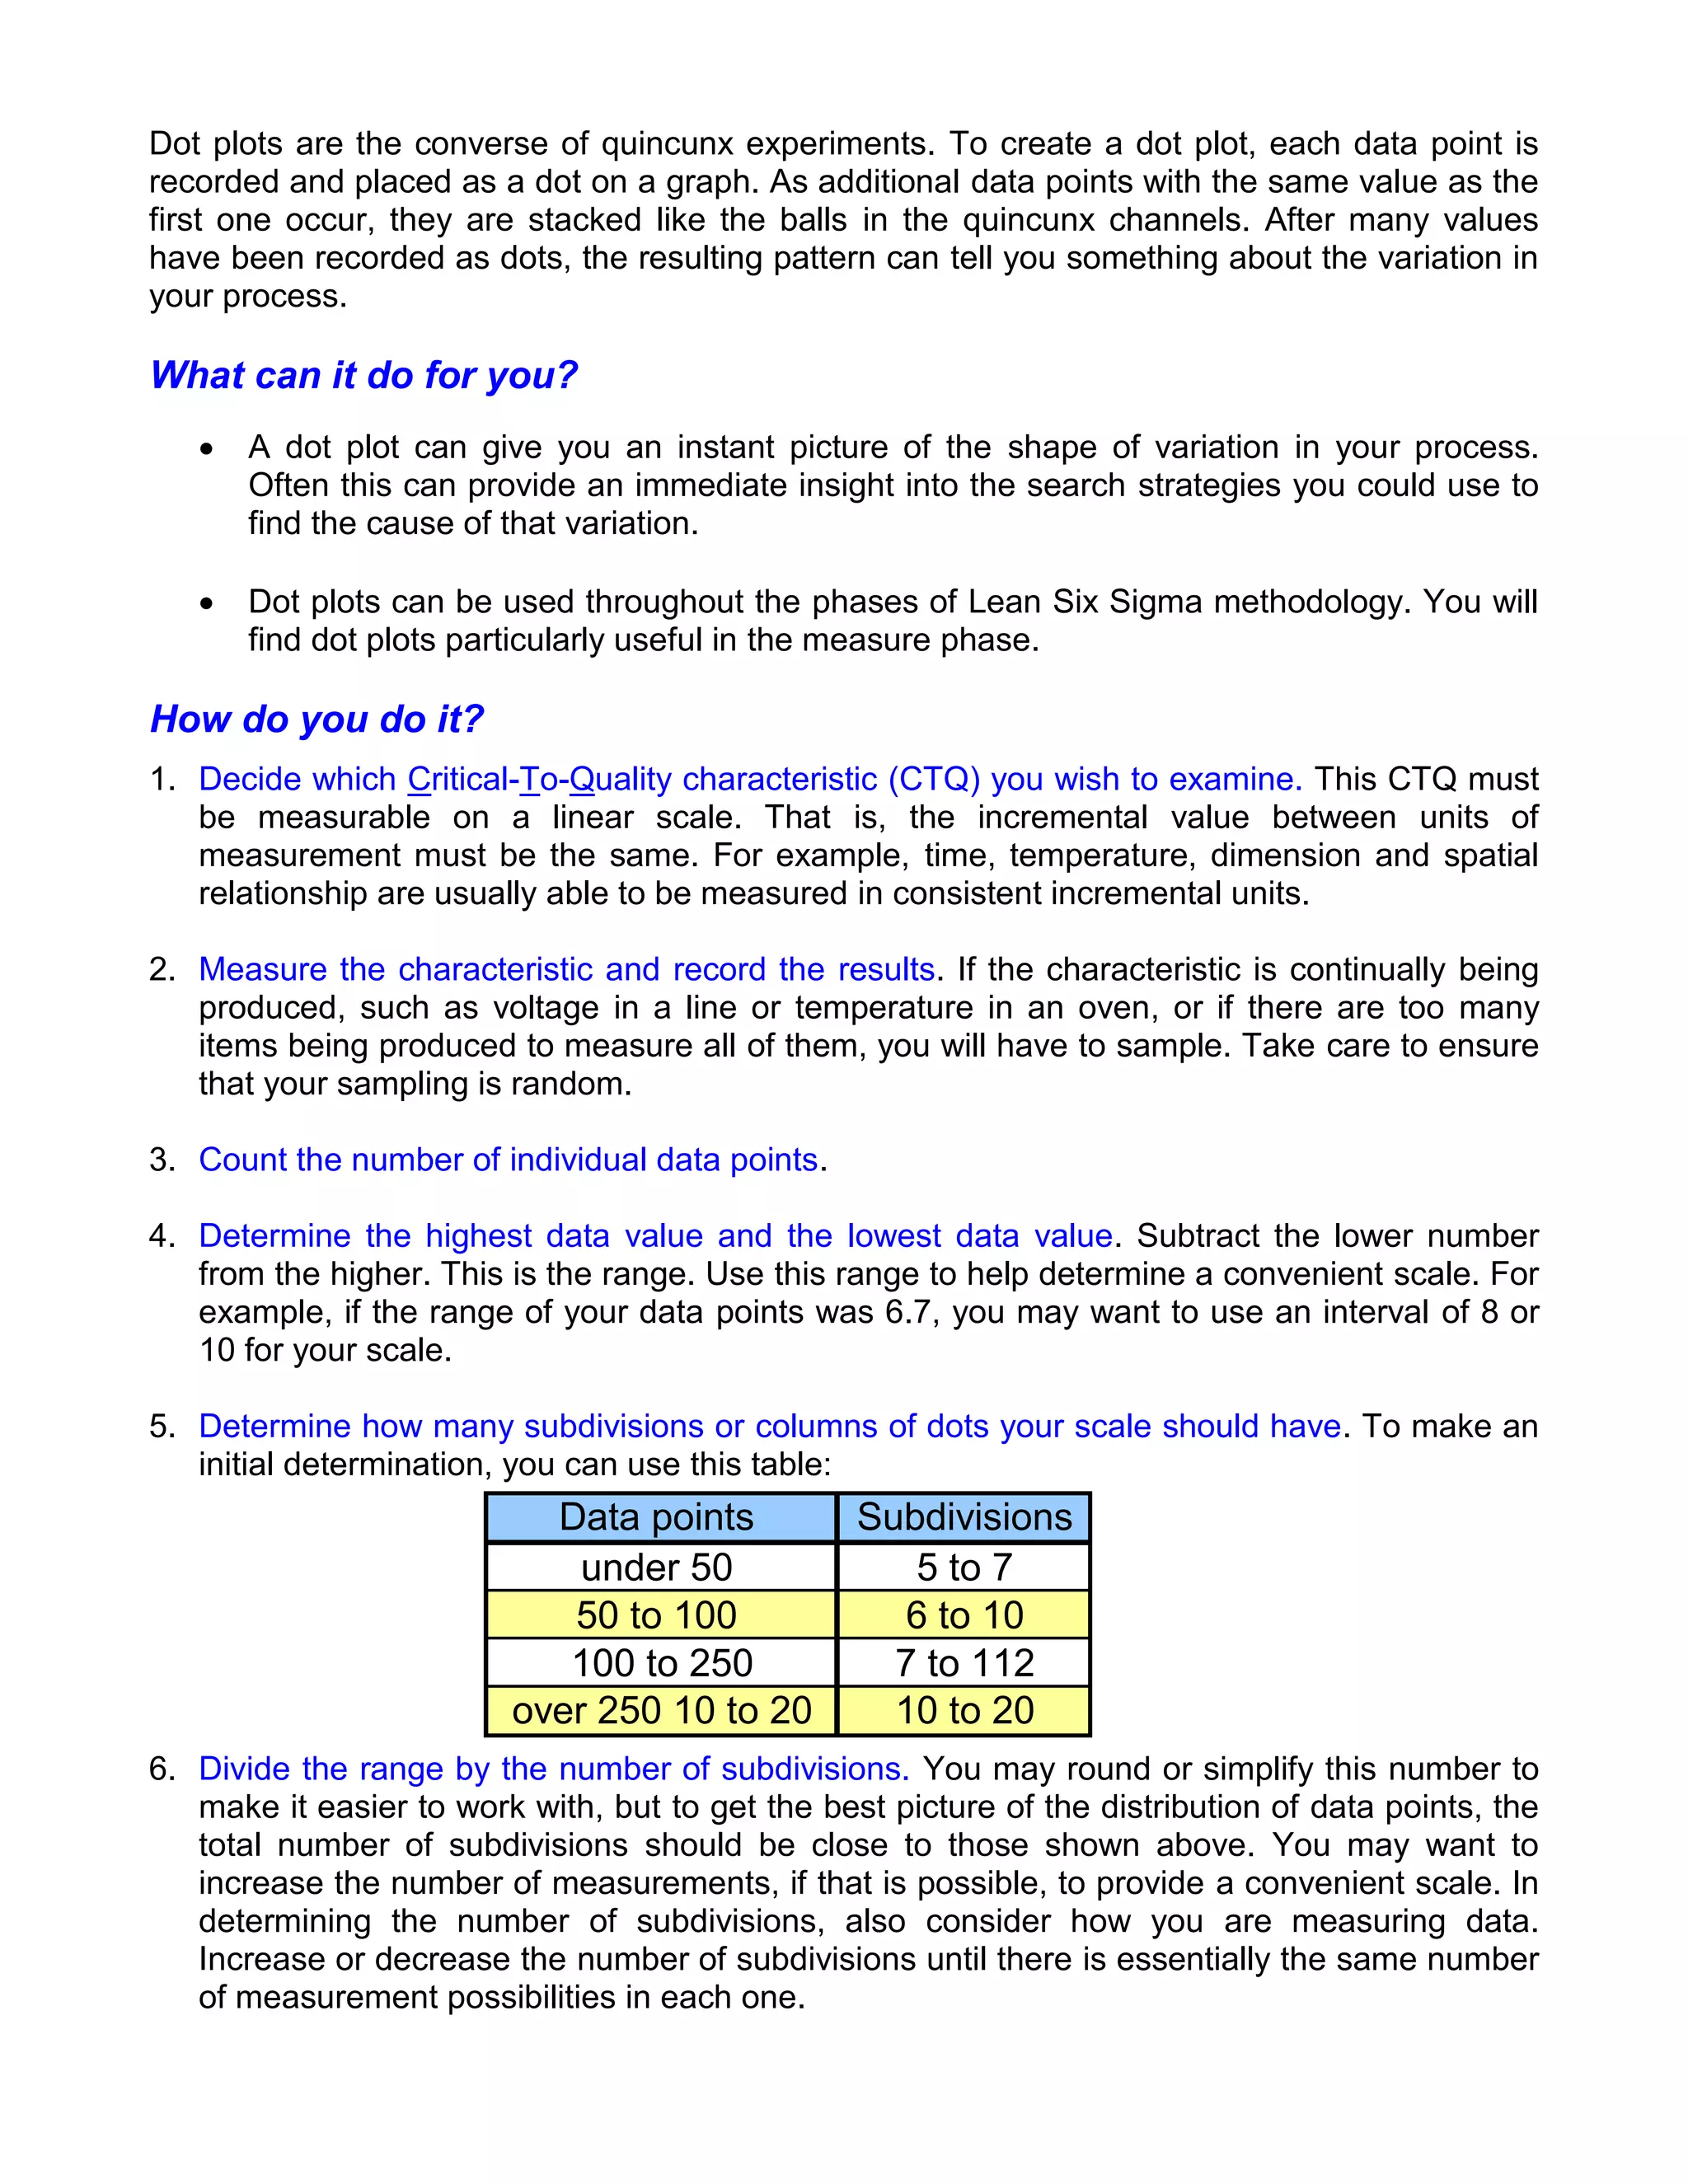
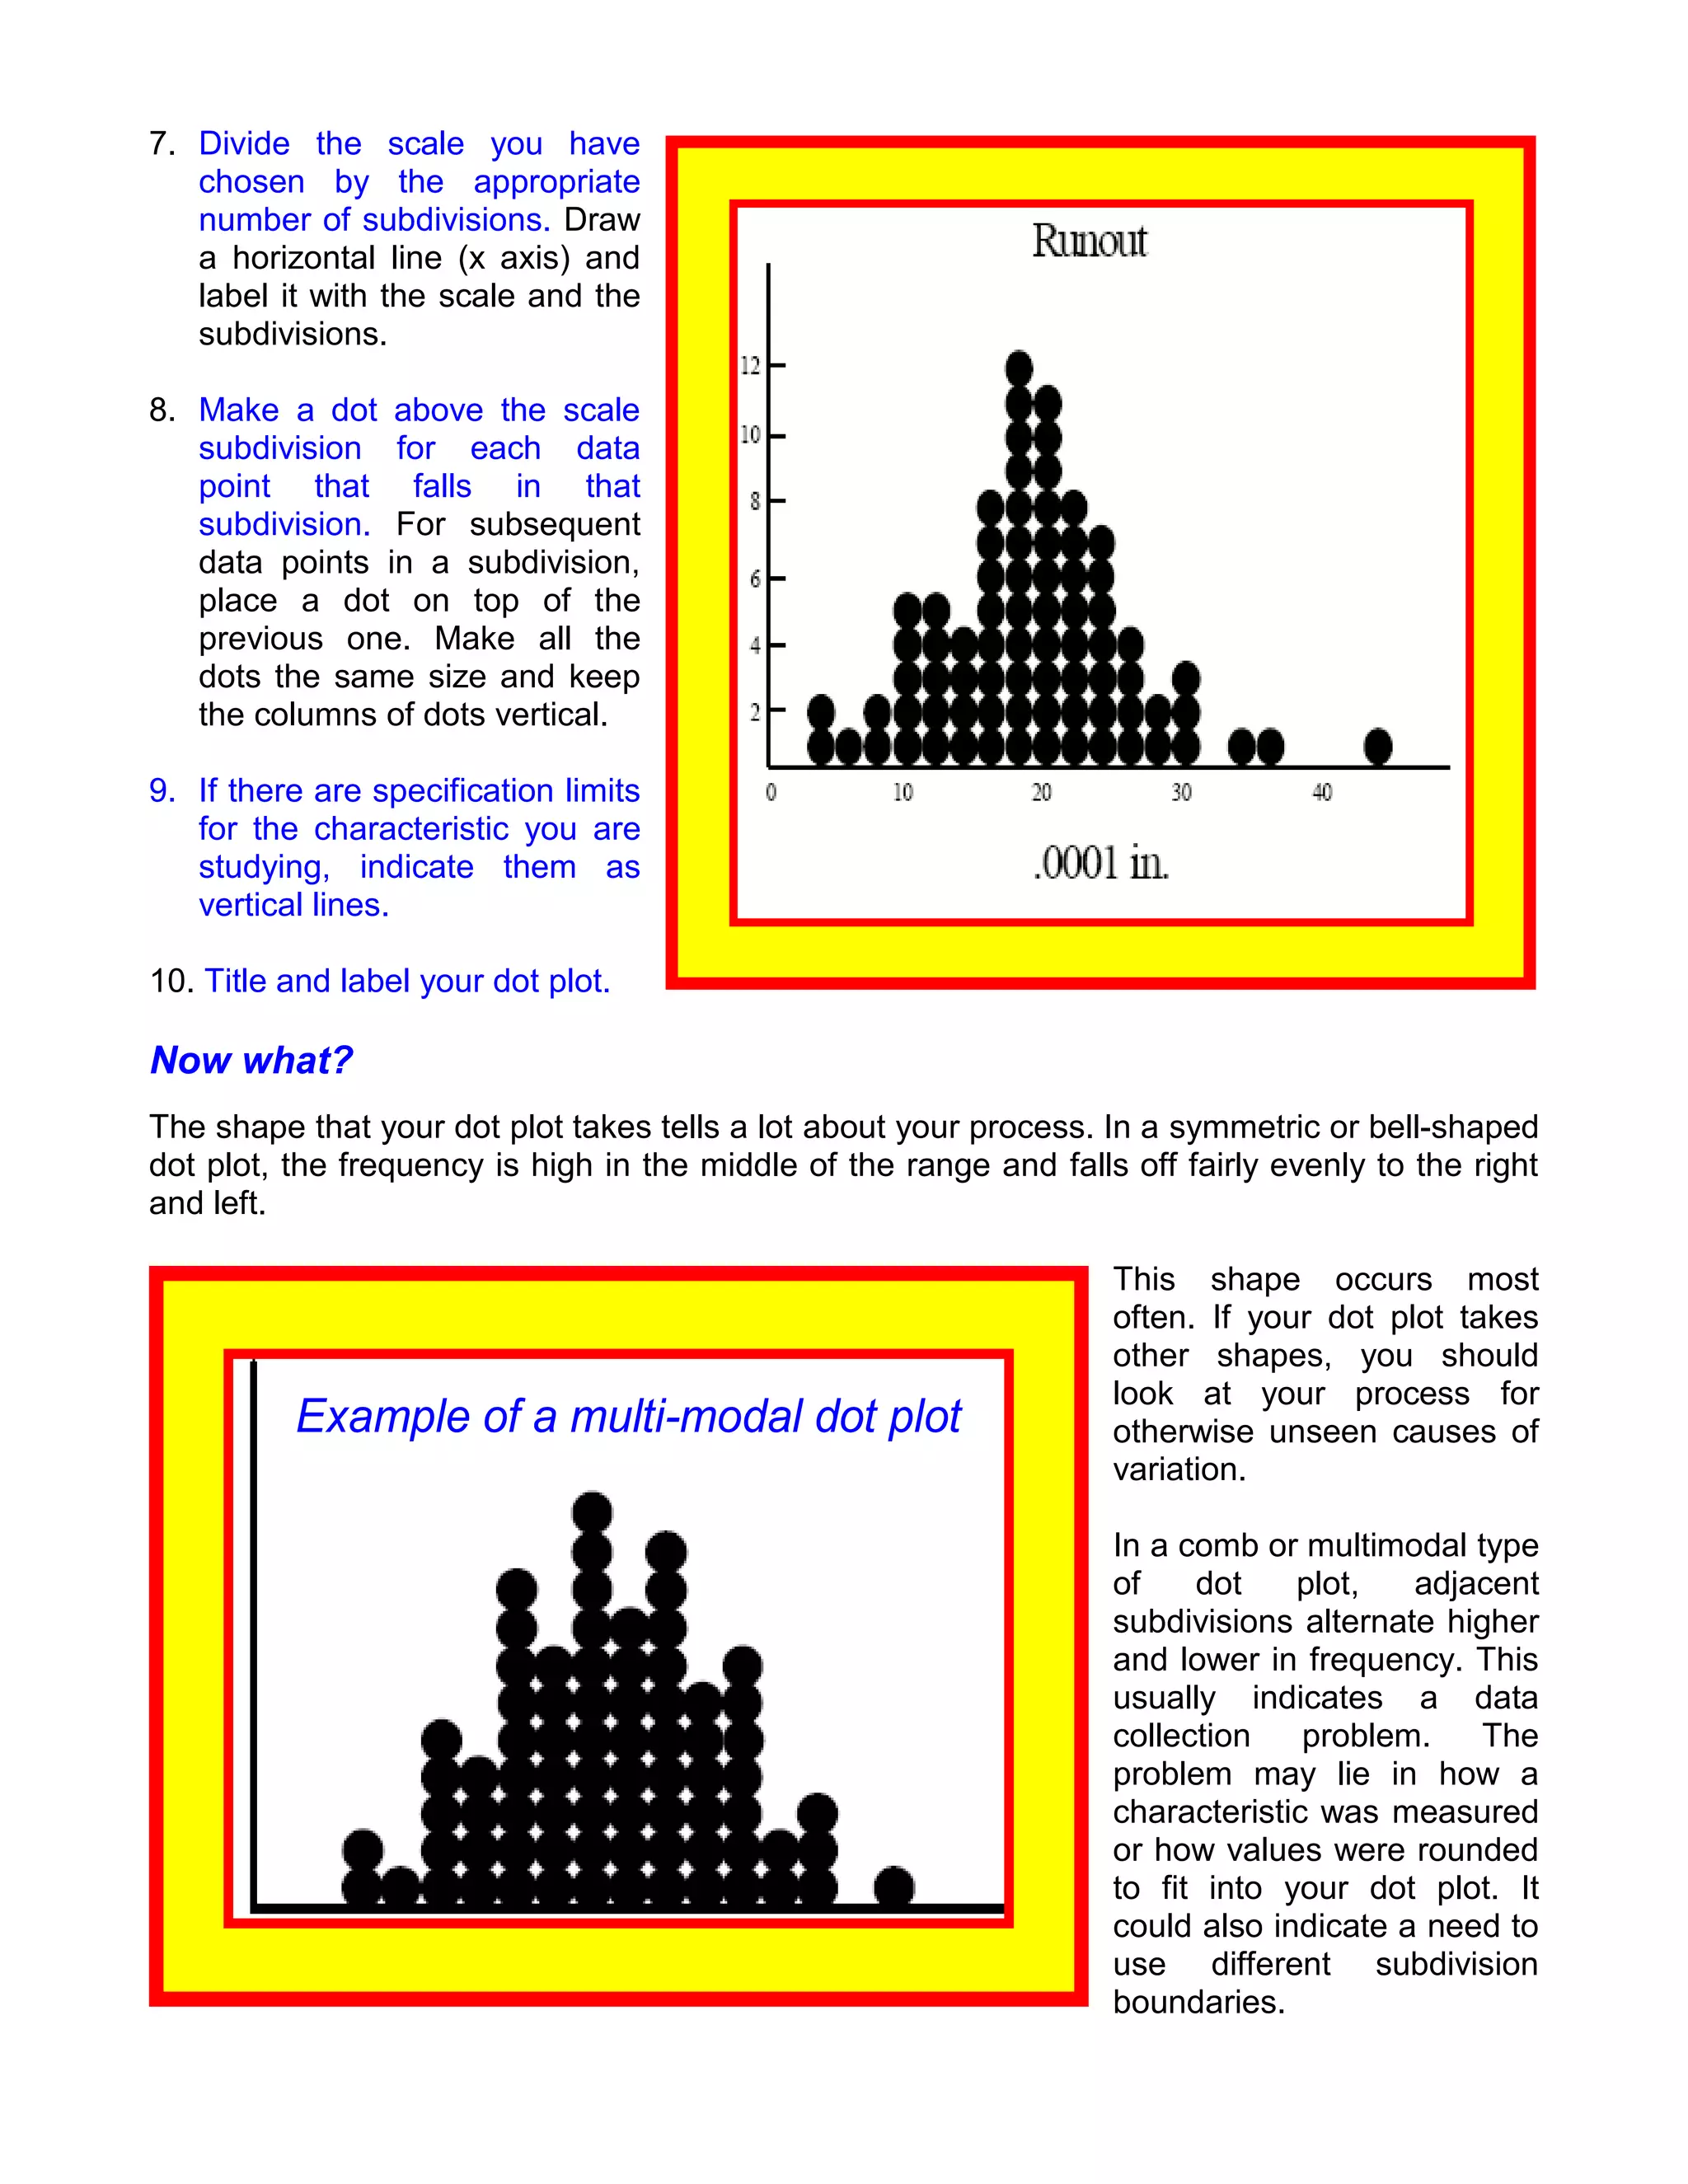
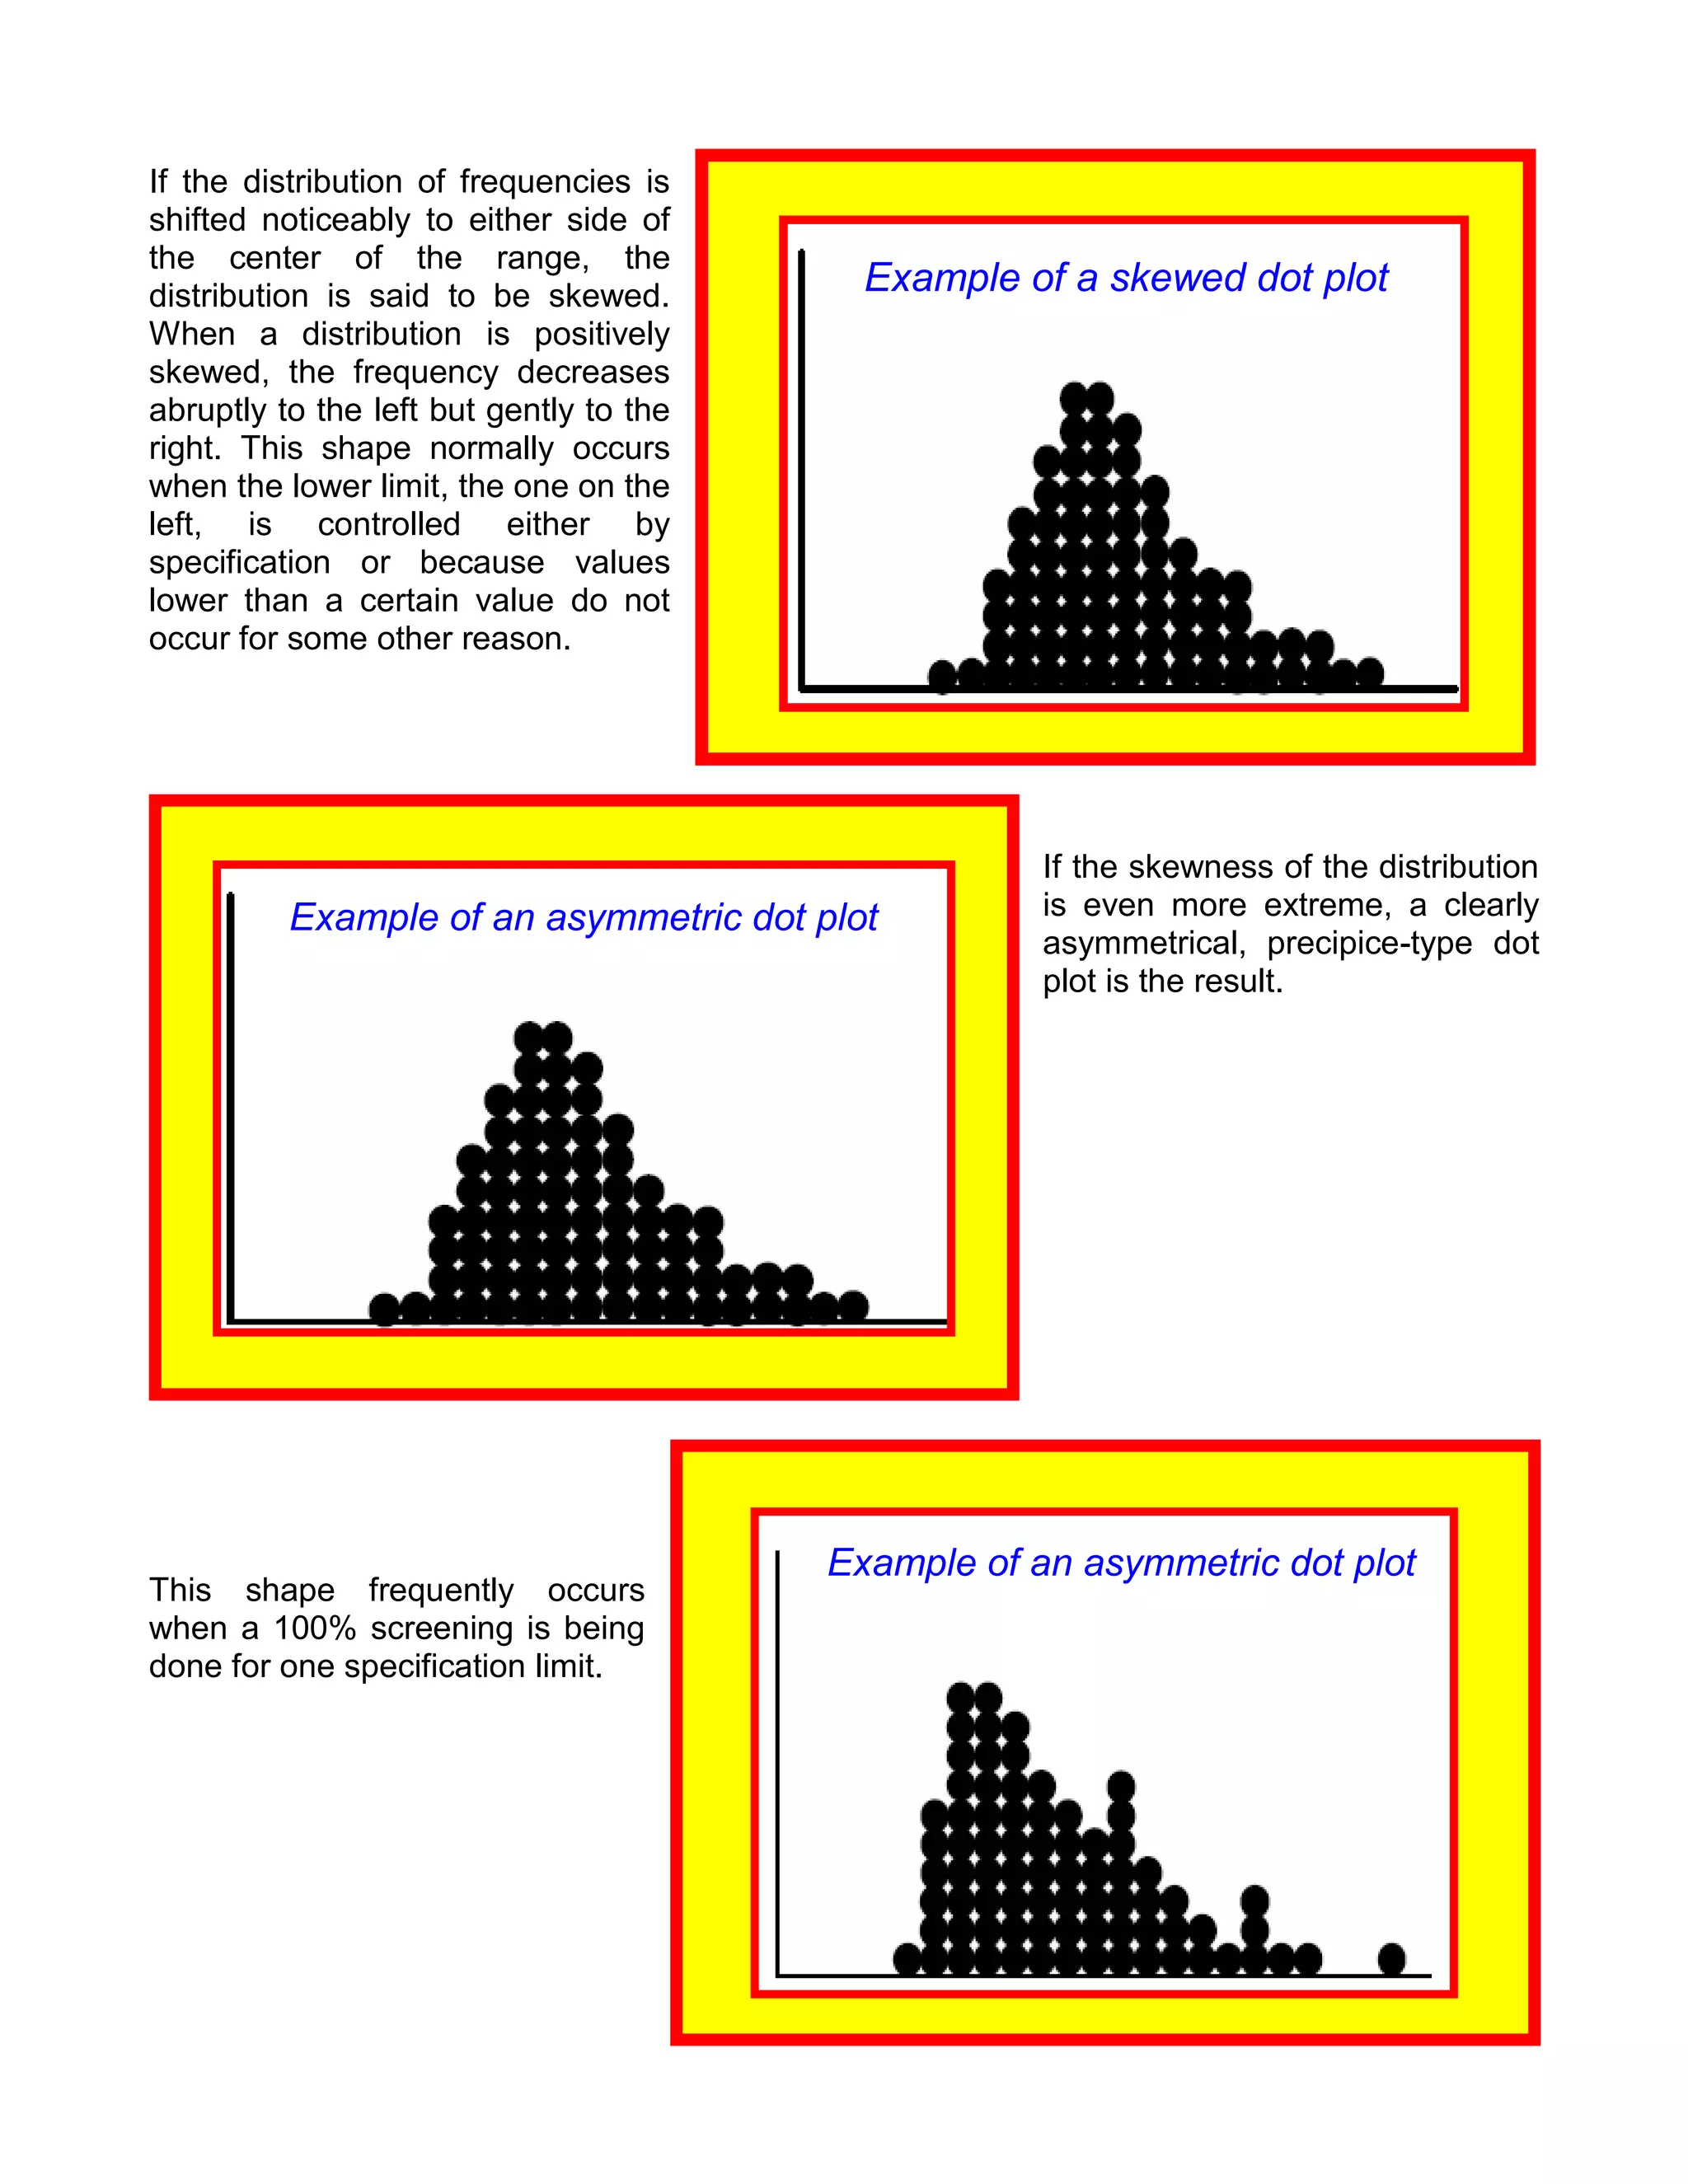
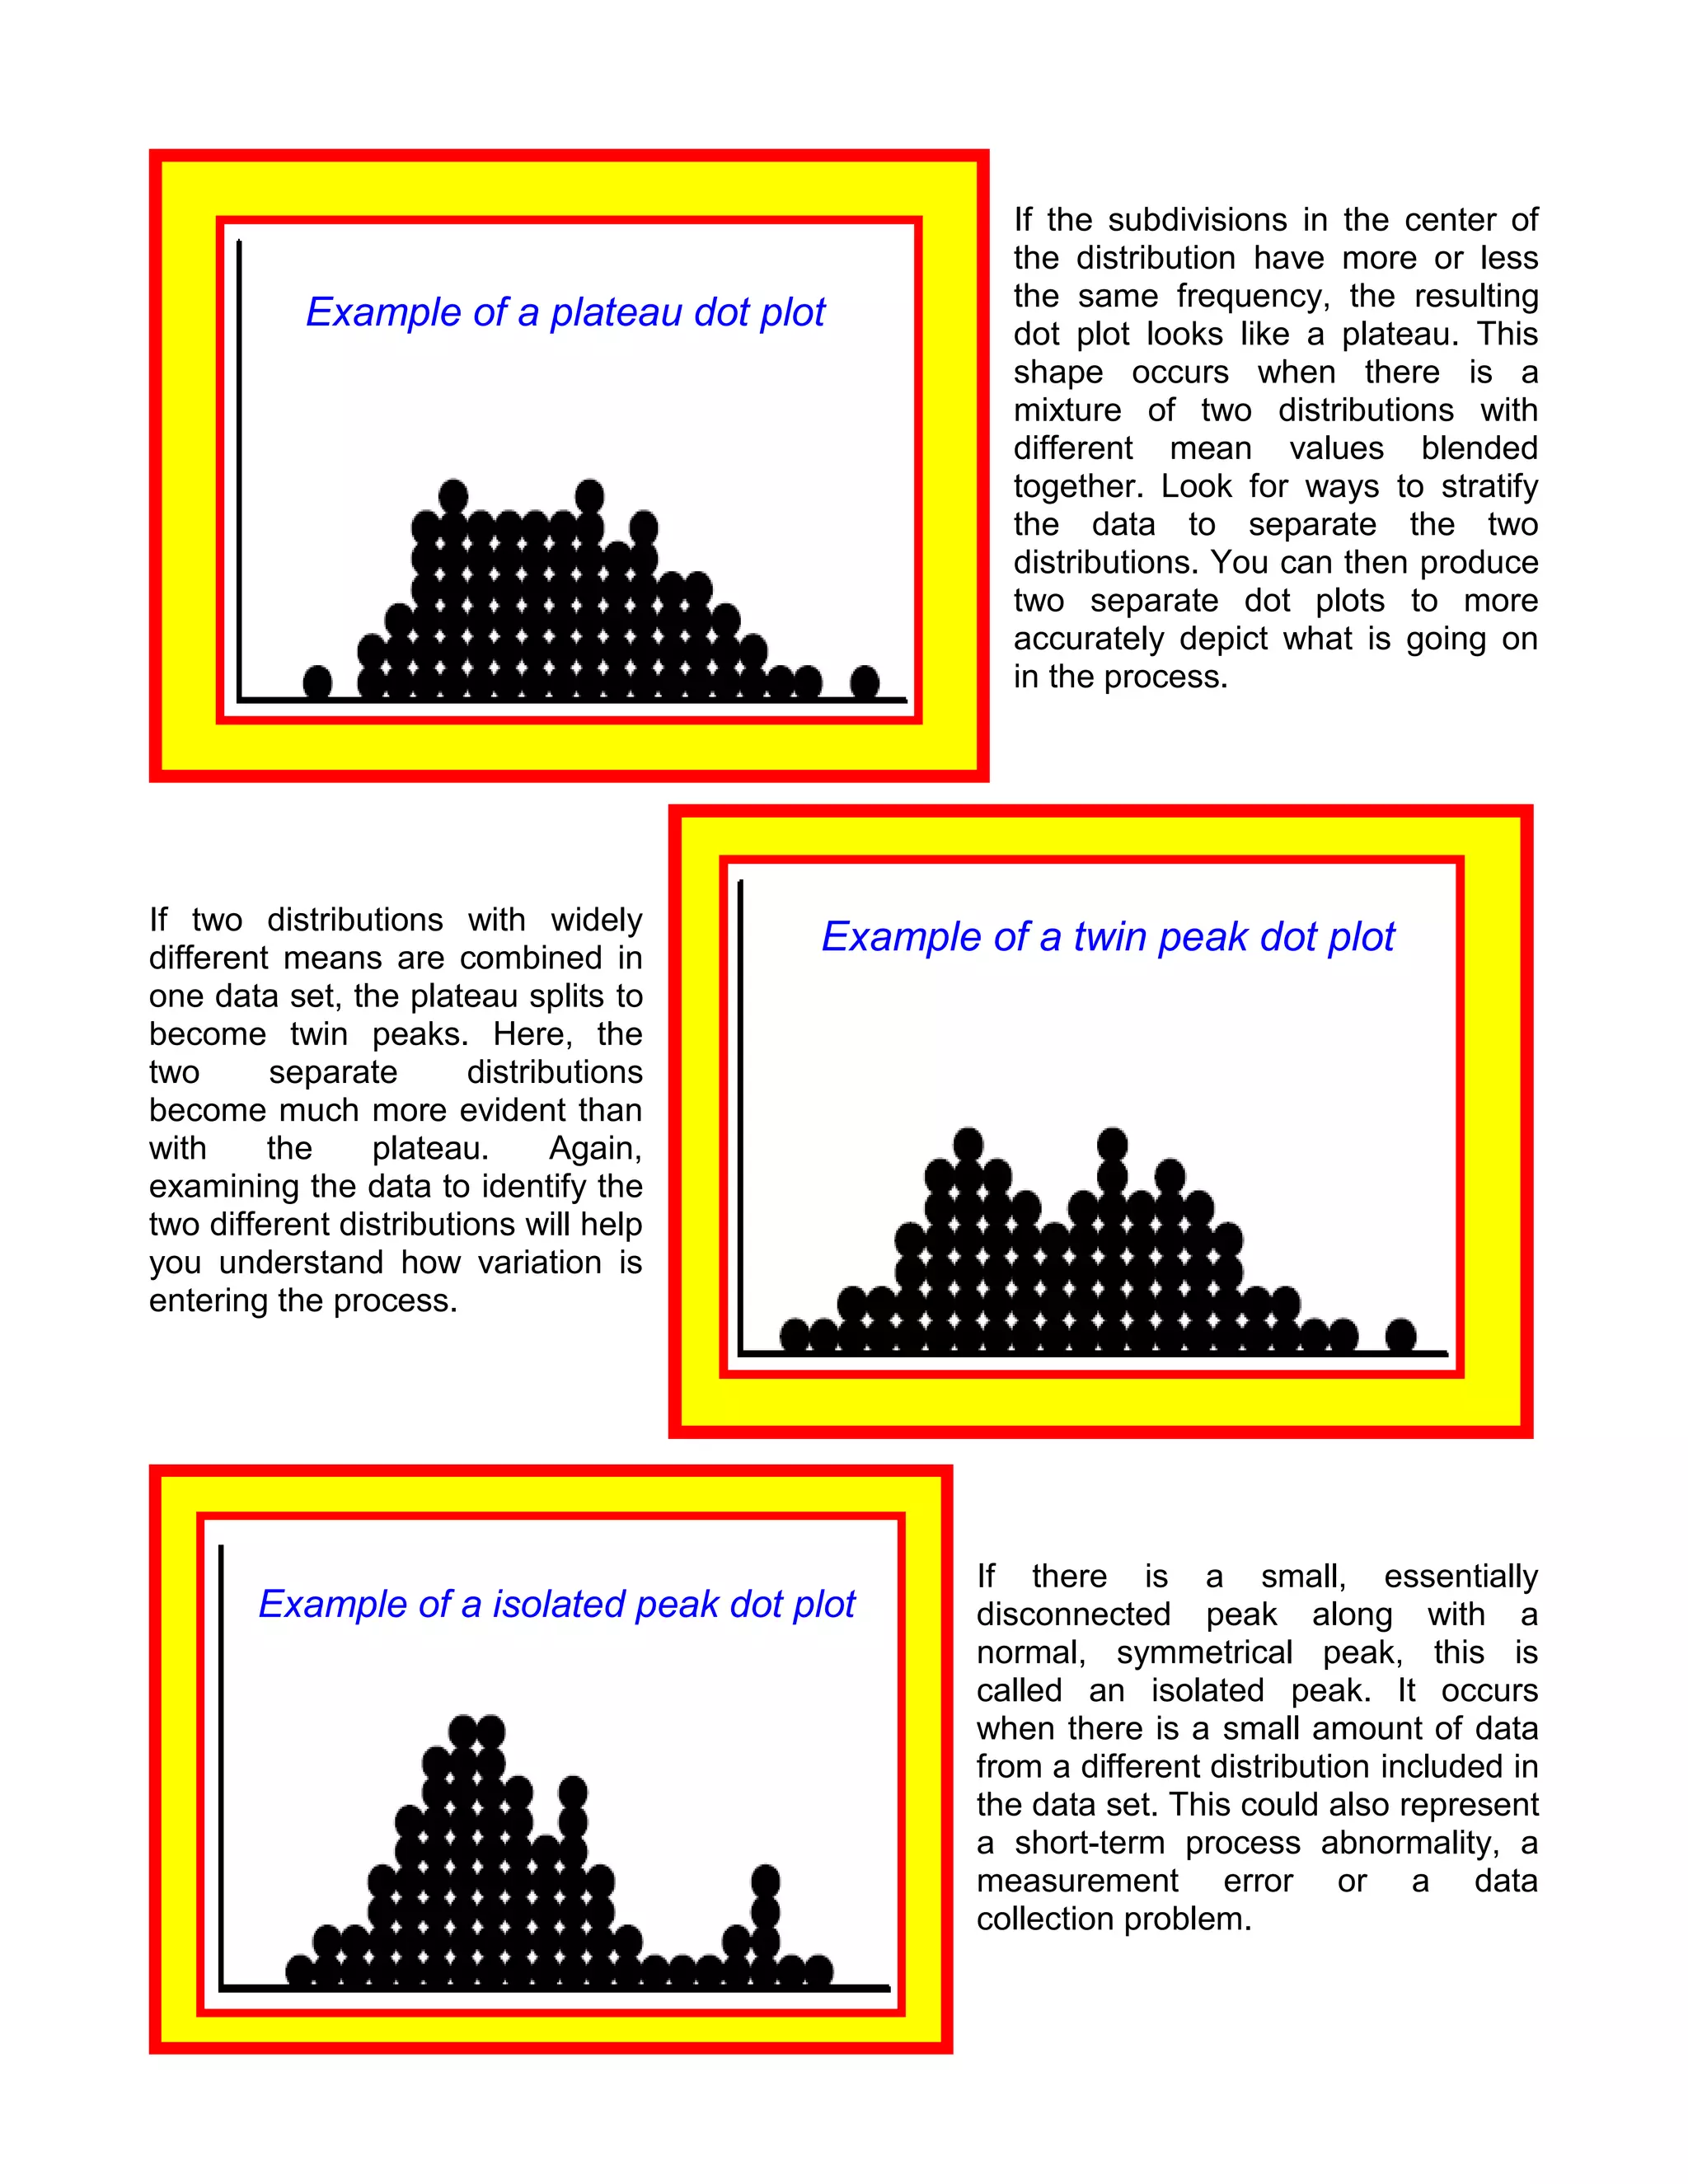


Dot plots are a tool for visually representing variation in a process. They involve measuring a characteristic, recording the results, and plotting each data point as a dot along a scale. The shape that emerges can provide insights into the sources of variation. Common shapes include symmetrical, skewed, multi-modal, plateaued, and those with isolated peaks. Comparing dot plots over time can track process improvement.


