Our businesses and their processes are based on databases. However, businesses frequently become engulfed by data volumes and trapped in data silos. Due to a lack of data clarity, these scenarios cause decision-makers to be blind spots. On such occasions, Dynamics 365 Power BI advantages will give you dependable forecasts and proposals to help your chiefs clear a pathway to progress.
With deep analytics beyond numbers, Microsoft's Dynamics 365 Power BI benefits will improve your company's decision-making abilities. It is the best fit for your company's decisive health because of its unparalleled intelligence and sharp insights.
What is the Best Data Visualization Tool: Power BI or Tableau?Digital Dialogue
Business Intelligence (BI) is a vital field of computer science that involves a range of processes and technologies aimed at gathering, storing, analyzing, and providing access to data to enhance business decision-making. Read more here!
Microsoft Power BI | Brief Introduction | PPTSophia Smith
What is Power BI?
Microsoft Power BI is one of the most powerful data visualization software. It empowers the organizations with their tools and help the users to transform their raw data into valuable information. Let's have a look on How Power BI helps to your business.
Our experts at Sunflower Lab can create interactive dashboards and reports that transform your business data into intelligent data through the power of Power BI. Imagine if you could see your inventory, backlog, revenue, pipeline, bookings, orders etc. All in one dashboard? And that dashboard would dynamically update with real-time figures? Our experts in Power BI, can help your business leverage its full potential by adding dynamic options like forecasting. This will ensure that the next time you make a decision for your business you make an informed one.
Power bi implementation for finance services firmsaddendanalytics
Addend Analytics is a Microsoft Power BI-partner based in Mumbai, India. Apart from being authorized for Power BI implementations, Addend has successfully executed Power BI projects for 100+ clients across sectors like financial services, Banking, Insurance, Retail, Sales, Manufacturing, Real estate, Logistics, and Healthcare in countries like the US, Europe, Australia, and India. Companies partnering with us save their valuable time and efforts of searching and managing resources while saving hugely on the development costs and hence, most of the small and medium enterprises in North America prefer Addend to be their Power BI implementation partner.
Microsoft Power BI is a popular business intelligence tool. Businesses use it all over the world for data visualisation and analysis. Microsoft Power BI tools enable better decision-making to avoid losses.
Master your career with a Power BI course from Skilliq and get 100% placement assurance. Power BI certification from SkillIQ allows you to learn about Microsoft Power BI concepts such as Power BI Desktop layouts, BI reports, dashboards, Power BI DAX commands, and functions.
Power BI: How to Implement Advanced Analytics with Data Integration?Kavika Roy
https://www.datatobiz.com/blog/advanced-analytics-with-data-integration/
SMEs are on the way to becoming data-driven enterprises by investing in data analytics and business intelligence. This move is to empower themselves to make better decisions based on reports generated by advanced data analytics tools.
Revamping the business systems and processes by integrating the latest AI, ML software allows enterprises to collect, store, process, and understand the vast amounts of data generated every day. Historical and real-time data from numerous sources is gathered in one place and processed using BI tools such as Power BI to gather valuable and accurate insights. In this blog, we will learn about the need for data integration and how Power BI can be used to implement advanced analytics with data integration.
Top 60 Power BI Interview Questions and Answers for 2023.pdfDatacademy.ai
Description:-
Power BI is a business analytics service provided by Microsoft. It allows users to create reports and dashboards based on various data sources, such as Excel, databases, and online services. With Power BI, users can visualize and analyze their data, and share their insights with others in their organization. Power BI offers a range of features, including data modeling, data visualization, reporting, and collaboration. It is available as a standalone service, or as part of various Office 365 plans. Power BI is designed to be user-friendly, so that people with little or no technical expertise can use it to gain insights from their data.we are provide top 60 Power BI Interview Questions and Answers for 2023.
Visit by :-https://www.datacademy.ai/power-bi-interview-questions/
Want to build your career in Power BI Analytics? Then you can opt for MIT ID Innovation. Enquire now at India's Leading Educational Institute.
To know more details visit us at : https://mitidinnovation.com/recreation/apply-for-power-bi-analytics-certification/
Power BI, a game-changer in data analytics, revolutionizes the way businesses interpret and leverage data. This Microsoft tool seamlessly integrates diverse data sources, offering dynamic visualizations and actionable insights. With user-friendly dashboards and real-time updates, Power BI empowers organizations to make informed decisions swiftly. Its intuitive interface facilitates even non-technical users in transforming raw data into meaningful narratives, fostering a data-driven culture. By simplifying complex analytics, Power BI enhances efficiency, accelerates decision-making, and propels businesses towards a new era of data-driven success.
Useful Link: Power BI, a game-changer in data analytics, revolutionizes the way businesses interpret and leverage data. This Microsoft tool seamlessly integrates diverse data sources, offering dynamic visualizations and actionable insights. With user-friendly dashboards and real-time updates, Power BI empowers organizations to make informed decisions swiftly. Its intuitive interface facilitates even non-technical users in transforming raw data into meaningful narratives, fostering a data-driven culture. By simplifying complex analytics, Power BI enhances efficiency, accelerates decision-making, and propels businesses towards a new era of data-driven success.
Useful Link:Power BI, a game-changer in data analytics, revolutionizes the way businesses interpret and leverage data. This Microsoft tool seamlessly integrates diverse data sources, offering dynamic visualizations and actionable insights. With user-friendly dashboards and real-time updates, Power BI empowers organizations to make informed decisions swiftly. Its intuitive interface facilitates even non-technical users in transforming raw data into meaningful narratives, fostering a data-driven culture. By simplifying complex analytics, Power BI enhances efficiency, accelerates decision-making, and propels businesses towards a new era of data-driven success.
Power BI vs Tableau | Key features and Comparison 2022 Sparity1
We are the leading iT Software development company in USA. We are the leaders in providing the best Software, Ai Mi, Data science, Data security, QA, UI/UX, RPA, App development, Digital transformation, Cloud and Cyber security services.
Power BI vs SAC: Which BI Solution Reigns Supreme in Business Intelligence?VCERPConsultingPvtLt1
Welcome to this blog, where the cloud experts at VC ERP will guide you through a detailed analysis of the two leading business intelligence (BI) giants. We will delve into their primary features, comparing their functionalities, including data acquisition and visualization, to provide you with a comprehensive understanding. Visit: https://www.vc-erp.com/power-bi-vs-sac-which-bi-solution-reigns-supreme-in-business-intelligence/
Power BI is a Business Intelligence tool that will help you to analyze your data, clean your data, and convert that data into a visual format where you can create different reports and different dashboards.
Power BI helps in managing and showcasing data and allows you to alter your data sets to highlight insights. It also facilitates creating and managing your data relationships for your company. It comes with various pre-built visual interfaces which help you in laying out your findings and visuals.
Power BI course in Chandigarh.pptx-presentationasmeerana605
Power BI is a collection of software services and apps that work together to turn your data into rich visualizations. You can pull data from simple spreadsheets, complex databases, and a vast array of cloud-based services, allowing you to consolidate information, and present it in clear, compelling ways.
Top 20 Power BI Interview Questions and Answers in 2023.pptxAnanthReddy38
Here are 20 commonly asked Power BI interview questions along with their answers:
What is Power BI?
Power BI is a business analytics tool developed by Microsoft. It allows users to visualize and analyze data from various sources, create interactive reports, and share insights across an organization.
What are the different components of Power BI?
Power BI consists of three main components: Power BI Desktop (for creating reports and visualizations), Power BI Service (for publishing and sharing reports online), and Power BI Mobile (for accessing reports on mobile devices).
What is the difference between Power BI Desktop and Power BI Service?
Power BI Desktop is a Windows application used for creating and designing reports, while Power BI Service is a cloud-based platform where reports can be published, shared, and accessed online.
How can you import data into Power BI?
Data can be imported into Power BI from various sources such as Excel, SQL databases, SharePoint, Azure, and many others. Power BI provides built-in connectors and supports direct query, import, and live connection options.
What is a data model in Power BI?
A data model in Power BI is a collection of tables, relationships, and calculations that define how data is organized and related to each other. It forms the foundation for creating reports and visualizations.
What are the different types of reports you can create in Power BI?
Power BI supports various types of reports, including interactive reports, paginated reports, and analytical reports. Interactive reports allow users to explore data, while paginated reports are designed for printing or generating PDFs.
How can you create relationships between tables in Power BI?
Relationships between tables can be established in Power BI by connecting related fields (columns) using the “Manage Relationships” option. Power BI automatically detects and suggests relationships based on field names.
What is DAX in Power BI?
DAX (Data Analysis Expressions) is a formula language used in Power BI to create custom calculations, measures, and queries. It is similar to Excel formulas but with more advanced functions and capabilities.
What is a measure in Power BI?
A measure in Power BI is a calculation performed on the data to derive meaningful insights. Measures are created using DAX expressions and can be used in visualizations and reports.
What is a calculated column in Power BI?
A calculated column is a column in a table that is created by defining a DAX formula. The formula is evaluated for each row, and the result is stored as a new column in the table. Calculated columns are useful for data transformations and calculations.
How can you share reports in Power BI?
Reports can be shared in Power BI by publishing them to the Power BI Service. Once published, reports can be accessed by authorized users, who can view, interact with, and share the reports with others.
Unlocking Organizational Potential through Advanced Data ManagementGetOnData
Collaboration: Effective data management requires IT, data analytics, and business operations collaboration.
Data Governance: Clear policies and procedures for data usage, access, and security are essential for successful data management.
Data Quality Assurance: Ensuring data accuracy and consistency through regular monitoring is crucial for reliable decision-making.
Directly integrate advanced data analytics within your Snowflake environment, ensuring unmatched security and governance.
Grow Your Revenue: Leverage success stories of businesses hitting major revenue milestones through Snowflake Marketplace.
Engage with us for a seamless integration of Snowflake Native Apps, designed to propel your business forward.
More Related Content
Similar to Advantages Of Using Power BI For Your Business
Power BI: How to Implement Advanced Analytics with Data Integration?Kavika Roy
https://www.datatobiz.com/blog/advanced-analytics-with-data-integration/
SMEs are on the way to becoming data-driven enterprises by investing in data analytics and business intelligence. This move is to empower themselves to make better decisions based on reports generated by advanced data analytics tools.
Revamping the business systems and processes by integrating the latest AI, ML software allows enterprises to collect, store, process, and understand the vast amounts of data generated every day. Historical and real-time data from numerous sources is gathered in one place and processed using BI tools such as Power BI to gather valuable and accurate insights. In this blog, we will learn about the need for data integration and how Power BI can be used to implement advanced analytics with data integration.
Top 60 Power BI Interview Questions and Answers for 2023.pdfDatacademy.ai
Description:-
Power BI is a business analytics service provided by Microsoft. It allows users to create reports and dashboards based on various data sources, such as Excel, databases, and online services. With Power BI, users can visualize and analyze their data, and share their insights with others in their organization. Power BI offers a range of features, including data modeling, data visualization, reporting, and collaboration. It is available as a standalone service, or as part of various Office 365 plans. Power BI is designed to be user-friendly, so that people with little or no technical expertise can use it to gain insights from their data.we are provide top 60 Power BI Interview Questions and Answers for 2023.
Visit by :-https://www.datacademy.ai/power-bi-interview-questions/
Want to build your career in Power BI Analytics? Then you can opt for MIT ID Innovation. Enquire now at India's Leading Educational Institute.
To know more details visit us at : https://mitidinnovation.com/recreation/apply-for-power-bi-analytics-certification/
Power BI, a game-changer in data analytics, revolutionizes the way businesses interpret and leverage data. This Microsoft tool seamlessly integrates diverse data sources, offering dynamic visualizations and actionable insights. With user-friendly dashboards and real-time updates, Power BI empowers organizations to make informed decisions swiftly. Its intuitive interface facilitates even non-technical users in transforming raw data into meaningful narratives, fostering a data-driven culture. By simplifying complex analytics, Power BI enhances efficiency, accelerates decision-making, and propels businesses towards a new era of data-driven success.
Useful Link: Power BI, a game-changer in data analytics, revolutionizes the way businesses interpret and leverage data. This Microsoft tool seamlessly integrates diverse data sources, offering dynamic visualizations and actionable insights. With user-friendly dashboards and real-time updates, Power BI empowers organizations to make informed decisions swiftly. Its intuitive interface facilitates even non-technical users in transforming raw data into meaningful narratives, fostering a data-driven culture. By simplifying complex analytics, Power BI enhances efficiency, accelerates decision-making, and propels businesses towards a new era of data-driven success.
Useful Link:Power BI, a game-changer in data analytics, revolutionizes the way businesses interpret and leverage data. This Microsoft tool seamlessly integrates diverse data sources, offering dynamic visualizations and actionable insights. With user-friendly dashboards and real-time updates, Power BI empowers organizations to make informed decisions swiftly. Its intuitive interface facilitates even non-technical users in transforming raw data into meaningful narratives, fostering a data-driven culture. By simplifying complex analytics, Power BI enhances efficiency, accelerates decision-making, and propels businesses towards a new era of data-driven success.
Power BI vs Tableau | Key features and Comparison 2022 Sparity1
We are the leading iT Software development company in USA. We are the leaders in providing the best Software, Ai Mi, Data science, Data security, QA, UI/UX, RPA, App development, Digital transformation, Cloud and Cyber security services.
Power BI vs SAC: Which BI Solution Reigns Supreme in Business Intelligence?VCERPConsultingPvtLt1
Welcome to this blog, where the cloud experts at VC ERP will guide you through a detailed analysis of the two leading business intelligence (BI) giants. We will delve into their primary features, comparing their functionalities, including data acquisition and visualization, to provide you with a comprehensive understanding. Visit: https://www.vc-erp.com/power-bi-vs-sac-which-bi-solution-reigns-supreme-in-business-intelligence/
Power BI is a Business Intelligence tool that will help you to analyze your data, clean your data, and convert that data into a visual format where you can create different reports and different dashboards.
Power BI helps in managing and showcasing data and allows you to alter your data sets to highlight insights. It also facilitates creating and managing your data relationships for your company. It comes with various pre-built visual interfaces which help you in laying out your findings and visuals.
Power BI course in Chandigarh.pptx-presentationasmeerana605
Power BI is a collection of software services and apps that work together to turn your data into rich visualizations. You can pull data from simple spreadsheets, complex databases, and a vast array of cloud-based services, allowing you to consolidate information, and present it in clear, compelling ways.
Top 20 Power BI Interview Questions and Answers in 2023.pptxAnanthReddy38
Here are 20 commonly asked Power BI interview questions along with their answers:
What is Power BI?
Power BI is a business analytics tool developed by Microsoft. It allows users to visualize and analyze data from various sources, create interactive reports, and share insights across an organization.
What are the different components of Power BI?
Power BI consists of three main components: Power BI Desktop (for creating reports and visualizations), Power BI Service (for publishing and sharing reports online), and Power BI Mobile (for accessing reports on mobile devices).
What is the difference between Power BI Desktop and Power BI Service?
Power BI Desktop is a Windows application used for creating and designing reports, while Power BI Service is a cloud-based platform where reports can be published, shared, and accessed online.
How can you import data into Power BI?
Data can be imported into Power BI from various sources such as Excel, SQL databases, SharePoint, Azure, and many others. Power BI provides built-in connectors and supports direct query, import, and live connection options.
What is a data model in Power BI?
A data model in Power BI is a collection of tables, relationships, and calculations that define how data is organized and related to each other. It forms the foundation for creating reports and visualizations.
What are the different types of reports you can create in Power BI?
Power BI supports various types of reports, including interactive reports, paginated reports, and analytical reports. Interactive reports allow users to explore data, while paginated reports are designed for printing or generating PDFs.
How can you create relationships between tables in Power BI?
Relationships between tables can be established in Power BI by connecting related fields (columns) using the “Manage Relationships” option. Power BI automatically detects and suggests relationships based on field names.
What is DAX in Power BI?
DAX (Data Analysis Expressions) is a formula language used in Power BI to create custom calculations, measures, and queries. It is similar to Excel formulas but with more advanced functions and capabilities.
What is a measure in Power BI?
A measure in Power BI is a calculation performed on the data to derive meaningful insights. Measures are created using DAX expressions and can be used in visualizations and reports.
What is a calculated column in Power BI?
A calculated column is a column in a table that is created by defining a DAX formula. The formula is evaluated for each row, and the result is stored as a new column in the table. Calculated columns are useful for data transformations and calculations.
How can you share reports in Power BI?
Reports can be shared in Power BI by publishing them to the Power BI Service. Once published, reports can be accessed by authorized users, who can view, interact with, and share the reports with others.
Similar to Advantages Of Using Power BI For Your Business (20)
Unlocking Organizational Potential through Advanced Data ManagementGetOnData
Collaboration: Effective data management requires IT, data analytics, and business operations collaboration.
Data Governance: Clear policies and procedures for data usage, access, and security are essential for successful data management.
Data Quality Assurance: Ensuring data accuracy and consistency through regular monitoring is crucial for reliable decision-making.
Directly integrate advanced data analytics within your Snowflake environment, ensuring unmatched security and governance.
Grow Your Revenue: Leverage success stories of businesses hitting major revenue milestones through Snowflake Marketplace.
Engage with us for a seamless integration of Snowflake Native Apps, designed to propel your business forward.
Data-Driven Retail Evolution: Redefining Customer Experience and Operational ...GetOnData
Welcome to a new era in retail, where data analytics is not just a tool but a game-changer. Today, we'll explore how leveraging data analytics can transform your retail business, enhancing customer experiences and driving unprecedented growth.
In the journey to retail excellence, data analytics is your most potent ally. As your analytics partner, we are committed to helping you navigate this journey, transforming challenges into opportunities. Let's redefine the future of your retail business together.
A Brief Journey Through Data Warehouse ArchitectureGetOnData
Unveil the secret behind effective data management. Data Warehouses: Your strategic partner in transforming massive arrays of data into actionable business insights. The cornerstone of business intelligence, enabling data-driven decision-making in an increasingly data-centric world.
Are you intrigued by the capabilities of Data Warehouse Architecture and its transformative impact? Explore the intricate details and advanced strategies with our expert guidance.
Retail and E-Commerce: Thriving with Smart Data Analytics SolutionsGetOnData
Discover how data analytics transforms retail, enhancing AI effectiveness and optimizing logistics. Embrace data analytics for retail excellence. Contact us to transform your retail business with actionable insights.
Start your data analytics journey with us. Visit our website, follow us on social media, or send an email.
How To Maximize Your Business Performance With Business IntelligenceGetOnData
Business Intelligence combines applications, technologies, tools, and practices that help businesses integrate, collect, present, and analyze raw data into actionable, insightful business information.
Business Intelligence comprises analytical processing, data mining, querying and reporting.
This analytical tool helps to enhance your business growth in more effective ways.
Things You Should Know About Snowflake WarehousesGetOnData
Snowflake is a prominent cloud-based data warehouse developed on various platforms with flexible, reliable, scalable, and cost-optimum options to store your data. GetOnData can enrich your data analytics powers by integrating with other platforms.
Software Delivery At the Speed of AI: Inflectra Invests In AI-Powered QualityInflectra
In this insightful webinar, Inflectra explores how artificial intelligence (AI) is transforming software development and testing. Discover how AI-powered tools are revolutionizing every stage of the software development lifecycle (SDLC), from design and prototyping to testing, deployment, and monitoring.
Learn about:
• The Future of Testing: How AI is shifting testing towards verification, analysis, and higher-level skills, while reducing repetitive tasks.
• Test Automation: How AI-powered test case generation, optimization, and self-healing tests are making testing more efficient and effective.
• Visual Testing: Explore the emerging capabilities of AI in visual testing and how it's set to revolutionize UI verification.
• Inflectra's AI Solutions: See demonstrations of Inflectra's cutting-edge AI tools like the ChatGPT plugin and Azure Open AI platform, designed to streamline your testing process.
Whether you're a developer, tester, or QA professional, this webinar will give you valuable insights into how AI is shaping the future of software delivery.
Slack (or Teams) Automation for Bonterra Impact Management (fka Social Soluti...Jeffrey Haguewood
Sidekick Solutions uses Bonterra Impact Management (fka Social Solutions Apricot) and automation solutions to integrate data for business workflows.
We believe integration and automation are essential to user experience and the promise of efficient work through technology. Automation is the critical ingredient to realizing that full vision. We develop integration products and services for Bonterra Case Management software to support the deployment of automations for a variety of use cases.
This video focuses on the notifications, alerts, and approval requests using Slack for Bonterra Impact Management. The solutions covered in this webinar can also be deployed for Microsoft Teams.
Interested in deploying notification automations for Bonterra Impact Management? Contact us at sales@sidekicksolutionsllc.com to discuss next steps.
Key Trends Shaping the Future of Infrastructure.pdfCheryl Hung
Keynote at DIGIT West Expo, Glasgow on 29 May 2024.
Cheryl Hung, ochery.com
Sr Director, Infrastructure Ecosystem, Arm.
The key trends across hardware, cloud and open-source; exploring how these areas are likely to mature and develop over the short and long-term, and then considering how organisations can position themselves to adapt and thrive.
Essentials of Automations: Optimizing FME Workflows with ParametersSafe Software
Are you looking to streamline your workflows and boost your projects’ efficiency? Do you find yourself searching for ways to add flexibility and control over your FME workflows? If so, you’re in the right place.
Join us for an insightful dive into the world of FME parameters, a critical element in optimizing workflow efficiency. This webinar marks the beginning of our three-part “Essentials of Automation” series. This first webinar is designed to equip you with the knowledge and skills to utilize parameters effectively: enhancing the flexibility, maintainability, and user control of your FME projects.
Here’s what you’ll gain:
- Essentials of FME Parameters: Understand the pivotal role of parameters, including Reader/Writer, Transformer, User, and FME Flow categories. Discover how they are the key to unlocking automation and optimization within your workflows.
- Practical Applications in FME Form: Delve into key user parameter types including choice, connections, and file URLs. Allow users to control how a workflow runs, making your workflows more reusable. Learn to import values and deliver the best user experience for your workflows while enhancing accuracy.
- Optimization Strategies in FME Flow: Explore the creation and strategic deployment of parameters in FME Flow, including the use of deployment and geometry parameters, to maximize workflow efficiency.
- Pro Tips for Success: Gain insights on parameterizing connections and leveraging new features like Conditional Visibility for clarity and simplicity.
We’ll wrap up with a glimpse into future webinars, followed by a Q&A session to address your specific questions surrounding this topic.
Don’t miss this opportunity to elevate your FME expertise and drive your projects to new heights of efficiency.
GDG Cloud Southlake #33: Boule & Rebala: Effective AppSec in SDLC using Deplo...James Anderson
Effective Application Security in Software Delivery lifecycle using Deployment Firewall and DBOM
The modern software delivery process (or the CI/CD process) includes many tools, distributed teams, open-source code, and cloud platforms. Constant focus on speed to release software to market, along with the traditional slow and manual security checks has caused gaps in continuous security as an important piece in the software supply chain. Today organizations feel more susceptible to external and internal cyber threats due to the vast attack surface in their applications supply chain and the lack of end-to-end governance and risk management.
The software team must secure its software delivery process to avoid vulnerability and security breaches. This needs to be achieved with existing tool chains and without extensive rework of the delivery processes. This talk will present strategies and techniques for providing visibility into the true risk of the existing vulnerabilities, preventing the introduction of security issues in the software, resolving vulnerabilities in production environments quickly, and capturing the deployment bill of materials (DBOM).
Speakers:
Bob Boule
Robert Boule is a technology enthusiast with PASSION for technology and making things work along with a knack for helping others understand how things work. He comes with around 20 years of solution engineering experience in application security, software continuous delivery, and SaaS platforms. He is known for his dynamic presentations in CI/CD and application security integrated in software delivery lifecycle.
Gopinath Rebala
Gopinath Rebala is the CTO of OpsMx, where he has overall responsibility for the machine learning and data processing architectures for Secure Software Delivery. Gopi also has a strong connection with our customers, leading design and architecture for strategic implementations. Gopi is a frequent speaker and well-known leader in continuous delivery and integrating security into software delivery.
Neuro-symbolic is not enough, we need neuro-*semantic*Frank van Harmelen
Neuro-symbolic (NeSy) AI is on the rise. However, simply machine learning on just any symbolic structure is not sufficient to really harvest the gains of NeSy. These will only be gained when the symbolic structures have an actual semantics. I give an operational definition of semantics as “predictable inference”.
All of this illustrated with link prediction over knowledge graphs, but the argument is general.
Transcript: Selling digital books in 2024: Insights from industry leaders - T...BookNet Canada
The publishing industry has been selling digital audiobooks and ebooks for over a decade and has found its groove. What’s changed? What has stayed the same? Where do we go from here? Join a group of leading sales peers from across the industry for a conversation about the lessons learned since the popularization of digital books, best practices, digital book supply chain management, and more.
Link to video recording: https://bnctechforum.ca/sessions/selling-digital-books-in-2024-insights-from-industry-leaders/
Presented by BookNet Canada on May 28, 2024, with support from the Department of Canadian Heritage.
UiPath Test Automation using UiPath Test Suite series, part 3DianaGray10
Welcome to UiPath Test Automation using UiPath Test Suite series part 3. In this session, we will cover desktop automation along with UI automation.
Topics covered:
UI automation Introduction,
UI automation Sample
Desktop automation flow
Pradeep Chinnala, Senior Consultant Automation Developer @WonderBotz and UiPath MVP
Deepak Rai, Automation Practice Lead, Boundaryless Group and UiPath MVP
Epistemic Interaction - tuning interfaces to provide information for AI supportAlan Dix
Paper presented at SYNERGY workshop at AVI 2024, Genoa, Italy. 3rd June 2024
https://alandix.com/academic/papers/synergy2024-epistemic/
As machine learning integrates deeper into human-computer interactions, the concept of epistemic interaction emerges, aiming to refine these interactions to enhance system adaptability. This approach encourages minor, intentional adjustments in user behaviour to enrich the data available for system learning. This paper introduces epistemic interaction within the context of human-system communication, illustrating how deliberate interaction design can improve system understanding and adaptation. Through concrete examples, we demonstrate the potential of epistemic interaction to significantly advance human-computer interaction by leveraging intuitive human communication strategies to inform system design and functionality, offering a novel pathway for enriching user-system engagements.
JMeter webinar - integration with InfluxDB and GrafanaRTTS
Watch this recorded webinar about real-time monitoring of application performance. See how to integrate Apache JMeter, the open-source leader in performance testing, with InfluxDB, the open-source time-series database, and Grafana, the open-source analytics and visualization application.
In this webinar, we will review the benefits of leveraging InfluxDB and Grafana when executing load tests and demonstrate how these tools are used to visualize performance metrics.
Length: 30 minutes
Session Overview
-------------------------------------------
During this webinar, we will cover the following topics while demonstrating the integrations of JMeter, InfluxDB and Grafana:
- What out-of-the-box solutions are available for real-time monitoring JMeter tests?
- What are the benefits of integrating InfluxDB and Grafana into the load testing stack?
- Which features are provided by Grafana?
- Demonstration of InfluxDB and Grafana using a practice web application
To view the webinar recording, go to:
https://www.rttsweb.com/jmeter-integration-webinar
JMeter webinar - integration with InfluxDB and Grafana
Advantages Of Using Power BI For Your Business
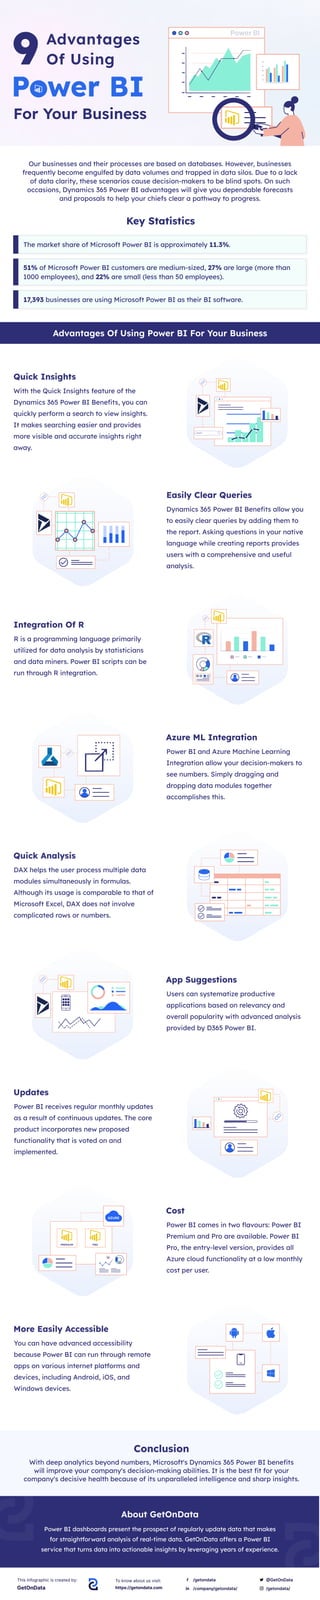
1. Our businesses and their processes are based on databases. However, businesses
frequently become engulfed by data volumes and trapped in data silos. Due to a lack
of data clarity, these scenarios cause decision-makers to be blind spots. On such
occasions, Dynamics 365 Power BI advantages will give you dependable forecasts
and proposals to help your chiefs clear a pathway to progress.
Advantages Of Using Power BI For Your Business
9Advantages
Of Using
Power BI
For Your Business
Power BI
Quick Insights
With the Quick Insights feature of the
Dynamics 365 Power BI Benefits, you can
quickly perform a search to view insights.
It makes searching easier and provides
more visible and accurate insights right
away.
Search
Quick Analysis
DAX helps the user process multiple data
modules simultaneously in formulas.
Although its usage is comparable to that of
Microsoft Excel, DAX does not involve
complicated rows or numbers.
Easily Clear Queries
Dynamics 365 Power BI Benefits allow you
to easily clear queries by adding them to
the report. Asking questions in your native
language while creating reports provides
users with a comprehensive and useful
analysis.
App Suggestions
Users can systematize productive
applications based on relevancy and
overall popularity with advanced analysis
provided by D365 Power BI.
Cost
Power BI comes in two flavours: Power BI
Premium and Pro are available. Power BI
Pro, the entry-level version, provides all
Azure cloud functionality at a low monthly
cost per user.
PREMIUM PRO
AZURE
Integration Of R
R is a programming language primarily
utilized for data analysis by statisticians
and data miners. Power BI scripts can be
run through R integration.
Updates
Power BI receives regular monthly updates
as a result of continuous updates. The core
product incorporates new proposed
functionality that is voted on and
implemented.
More Easily Accessible
You can have advanced accessibility
because Power BI can run through remote
apps on various internet platforms and
devices, including Android, iOS, and
Windows devices.
Azure ML Integration
Power BI and Azure Machine Learning
Integration allow your decision-makers to
see numbers. Simply dragging and
dropping data modules together
accomplishes this.
Key Statistics
The market share of Microsoft Power BI is approximately 11.3%.
51% of Microsoft Power BI customers are medium-sized, 27% are large (more than
1000 employees), and 22% are small (less than 50 employees).
17,393 businesses are using Microsoft Power BI as their BI software.
About GetOnData
Power BI dashboards present the prospect of regularly update data that makes
for straightforward analysis of real-time data. GetOnData offers a Power BI
service that turns data into actionable insights by leveraging years of experience.
This infographic is created by:
GetOnData
To know about us visit:
https://getondata.com
/getondata @GetOnData
/company/getondata/ /getondata/
Conclusion
With deep analytics beyond numbers, Microsoft's Dynamics 365 Power BI benefits
will improve your company's decision-making abilities. It is the best fit for your
company's decisive health because of its unparalleled intelligence and sharp insights.