
Recommended
Recommended
More Related Content
Similar to Power BI: A Comprehensive Solution for Data Analytics
Similar to Power BI: A Comprehensive Solution for Data Analytics (20)
Recently uploaded
Recently uploaded (20)
Power BI: A Comprehensive Solution for Data Analytics
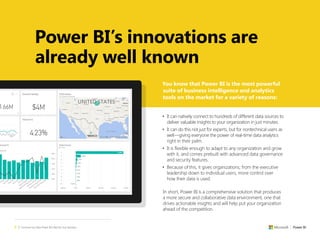
- 1. 2 | Convince Your Boss Power BI Is Best for Your Business You know that Power BI is the most powerful suite of business intelligence and analytics tools on the market for a variety of reasons: • It can natively connect to hundreds of different data sources to deliver valuable insights to your organization in just minutes. • It can do this not just for experts, but for nontechnical users as well—giving everyone the power of real-time data analytics right in their palm. • It is flexible enough to adapt to any organization and grow with it, and comes prebuilt with advanced data governance and security features. • Because of this, it gives organizations, from the executive leadership down to individual users, more control over how their data is used. In short, Power BI is a comprehensive solution that produces a more secure and collaborative data environment, one that drives actionable insights and will help put your organization ahead of the competition. Power BI’s innovations are already well known
- 2. 3 | Convince Your Boss Power BI Is Best for Your Business Just look at the numbers 100,000+ companies currently use Power BI. Millions of active users. Used in over 200 countries. More than 500 different partners in its ecosystem.
- 3. 8 | Convince Your Boss Power BI Is Best for Your Business Ease-of-use features Draw insights from your data within five minutes flat. At its core, Power BI is designed to be a tool for everyone. That’s why we’ve not only filled it with the best data analytical features available, but have also made them all incredibly easy to use. This way, everyone at your organization will be able to benefit from intelligent, data-driven analysis—regardless of their skill level. We believe this is one of the most vital benefits you can get from Power BI.
- 4. 9 | Convince Your Boss Power BI Is Best for Your Business Build intuitive charts and graphs in minutes Plug in your data, select your graphics, and start showing off. With Power BI, you won’t have to rely on hard-to-schedule graphic designers to make your data beautiful ever again. After connecting your data sources to Power BI, you can immediately start using the drag-and-drop menu to build stunning visualizations. Choose from standard bar or column charts, as well as tree maps, pie charts, and even more specialized graphs such as waterfalls and gauges. You can also build custom graphics using the library of visualizations the Power BI community is continually putting online. Keep refining by removing individual elements, isolating key categories, adjusting axes, and more. After you’ve transformed your data, you can then take your most useful charts and graphics and quickly combine them all into a custom dashboard with just a few clicks. Create several dashboards for managing different aspects of your organization, or use just one so you can glean insights at a glance. You can even share these dashboards with other team members, driving efficiency and high-level decision-making throughout your organization. Talking points: • Turn your data into gorgeous charts and graphs within just minutes. • Intuitive drag-and-drop menu and a library of custom visualizations put professional- level design within reach for everyone. • Collect your most useful visualizations into a dashboard, then share them with others to promote organization- wide insights. • More information: Visualizations in Power BI More information: Visualizations in Power BI
- 5. 10 | Convince Your Boss Power BI Is Best for Your Business Explore your data using natural language Getting the answers you need is as easy as asking a question. One of the most exciting features of Power BI is its ability to interpret queries and questions phrased in natural language. All you have to do start exploring through your data is to ask a simple question, such as “What were the sales numbers for last quarter?” Power BI will then automatically select the corresponding data and choose the appropriate visualizations to depict it. If you’d like to dive in further, you can keep refining and expanding your question until you’ve found exactly what you need—or realized what you were looking for all along. When you’re finished, you can operationalize that custom data by including it in your dashboard or by sharing it with the rest of your organization. In this way, Power BI helps remove any potential barriers to data exploration and promotes a culture aligned with data analytics. Everyone will finally be able to uncover exactly the information they need. Talking points: • Begin exploring your data simply by typing in naturally phrased questions. • Further refine your questions to home in on what you’re looking for. • Add custom data to your dashboard, or share it with a wider organization in order to encourage additional insights. More information: Q&A in Power BI
- 6. 11 | Convince Your Boss Power BI Is Best for Your Business Excel and PowerPoint users can jump right in It’s more than intuitive. It’s familiar. Excel and PowerPoint are two of the most widely used business applications in the world. They are also part of the Microsoft family, so it made sense to incorporate many of their functions and processes into Power BI. For example, any PowerPoint user will be instantly familiar with Power BI’s drag-and-drop controls. However, Power BI really shines when it comes to how closely it’s integrated with Excel. Within seconds, you can import the data from an Excel workbook or even upload the entire workbook itself. You can then edit just as you would in Excel, with additional options such as the ability to drag charts to your dashboard or share the workbook with other Power BI users. You can also use Power BI’s functionality to get extra value from your Excel data, such as by using it to create custom visualizations, editing it further with Power Query and Power Pivot, or combining it with still other data you have stored in Power BI. This tight level of integration helps lower the barrier of entry for novice users and further extends Power BI’s usefulness for those familiar with Excel. Talking points: • Anyone familiar with PowerPoint or Excel will have an easy time learning how to use Power BI. • In particular, Power BI is designed from the ground up to integrate closely with Excel. • You can import whole Excel workbooks, or just their data, then user Power BI’s additional functionality to make other edits. More information: From Excel workbook to stunning report in no time
- 7. 12 | Convince Your Boss Power BI Is Best for Your Business Access data analytics wherever you are The Power BI mobile app puts everything you need in your palm. Today’s workers aren’t just sitting in their office all day. They’re constantly on the go, so it’s essential they always have access to the data analytics they need. The Power BI mobile app does more than just connect with the rest of your Power BI data so you can check it while you’re away. It offers full integration to help you focus on only the data you need. For example, once you create a custom dashboard within Power BI, it will automatically appear in your Power BI mobile app, where you can scroll through to view it through the easy-to-use interface. You can also go a step further and tell the mobile app to notify you if any data points you’re tracking exceed a certain threshold. This way, it saves you the trouble of constantly monitoring your phone while you’re out of the office. The mobile app also makes it easy to annotate live data and share it through text, email, or through the app itself—giving you further control over your data wherever you go. Talking points: • Power BI automatically populates the mobile app with your dashboards. • You can set proactive notifications to alert you when specific data points reach a certain mark. • You can annotate and send data through text, email, or the app itself. More information: Power BI Mobile page
- 8. 13 | Convince Your Boss Power BI Is Best for Your Business Sharing and collaboration features Break down the walls that separate your data and people from your goals. In many ways, data is only as good as the people you share it with. All the insights in the world won’t be of much use if you can’t show them to other people. For this reason, we’ve made sharing and collaboration as important in Power BI as the analytics themselves. That means it will be easier than ever for your organization to start working together toward its future goals.
- 9. 14 | Convince Your Boss Power BI Is Best for Your Business Seamlessly connect all of your data Native integration with hundreds of data sources, apps, and services. Before you can begin sharing and collaborating with your data, you first have to make sure that everyone can access it in one place. Power BI makes this easy by automatically connecting to hundreds of different data sources, as well as many more apps and services that your organization may already use. This includes native integrations with SQL Server, Azure, SAP Hana, Office 365, Microsoft Dynamics, Adobe Analytics, Salesforce, and much more. New integrations are constantly being developed as well, helping to further extend Power BI’s reach. With this level of flexibility, you can finally create a convenient way for your entire organization to view all its data under one umbrella. For example, after connecting your CRM system and website analytics software to Power BI, you could create a graph directly comparing website visitors with your sales. Dive further and you could even correlate the average time a visitor spends on your website before making a purchase. Once you open up this capability to your entire organization, the possibilities of new and valuable insights are endless. Talking points: • Power BI comes with native integrations for hundreds of different data sources, apps, and services. • This makes it simple to bring together whatever sources of data you already use. • It’s the ideal way of making sharing and collaboration a central aspect of your organization. More information: Connect to services with content packs for Power BI
- 10. 15 | Convince Your Boss Power BI Is Best for Your Business Share your data however you want Show off your analytics using a vast array of options. Power BI can not only transform the way you look at your organization’s data, but also change how you share your new insights with your colleagues and even the broader world. Once you create a custom dashboard or report, for instance, you can immediately distribute it to others through Power BI itself, or by sending a link through email or text message (via the mobile app). While everyone will be able to interact with the dynamic elements of your dashboard or report, only your own colleagues will be able to share them again, helping ensure your information stays within your organization. Likewise, if you are sharing dashboards or reports with row-level security turned on, they will only be able to see information that they have permission to view. However, if you want to share a dashboard or report with the wider public, you can embed them on your website or in an email, too. You can also use Power BI to collaborate directly on dashboards and reports with your colleagues. To do this, you and your colleagues can collect key dashboards and reports in an app workspace, where you can either continue to refine them, or can send them out to additional coworkers to encourage further collaboration. Everyone will be able to view, interact, and edit the same data as you do, unless they have different permissions, in which case they will only be able to view authorized data. With features such as these, even organizations with complex data sets and large numbers of employees will find it easy to promote a culture of sharing and collaboration. Talking points: • Power BI lets you share secure reports and dashboards through the service itself, through email or text message, or by embedding them in emails and websites. • You can also create app workspaces, where you and your colleagues can collaborate on a collection of dashboards and reports. • Power BI will automatically remove any information from a dashboard or report when a person is not authorized to view it. More information: How should I collaborate and share dashboards and reports?
- 11. 16 | Convince Your Boss Power BI Is Best for Your Business View your data in real time Gain valuable insights as they are happening. The ability to see the most up-to-date information has become essential to today’s organizations. This is especially true when you are working on projects with your colleagues, which means everyone must be on the same page. Power BI can help reduce the chances of miscommunication during this process by constantly refreshing any data sources it’s connected to, enabling everyone to see your organization’s data in real time. This can be set up to apply not only to reports and dashboards within Power BI itself, but also to reports and dashboards you’ve shared elsewhere. This creates a window of streaming real-time information that you and your colleagues can continuously check in on for the latest news. When this capability is paired with other features in Power BI, it can dramatically increase your organization’s efficiency. For instance, when workers can access real-time organizational data through their Power BI mobile app while traveling, they will be empowered to make better decisions on the fly. Similarly, through Power BI’s close integration with Cortana, you can view real-time data simply by asking a question in the search bar. The chart or graph with the most up-to-date information will then automatically appear, saving you the time of searching it out yourself. This level of convenience, along with access to real-time data, can help turn your organization into a well-oiled machine. Talking points: • Power BI will connect to your data sources and continuously update them, giving you access to the up-to-minute data. • This applies not only to reports and dashboards within Power BI, but also to any you share. • When you combine this capability with other features, such as Cortana integration and the mobile app, it will make your organization much more efficient. More information: Real-time streaming in Power BI
- 12. 17 | Convince Your Boss Power BI Is Best for Your Business Data security features Make sure your information is always in the right hands. Keeping your data safe is a serious concern these days. Unfortunately, due to the ease with which people can now instantly (and even unintentionally) send out sensitive information, many organizations think that security can only come at the cost of collaboration. We disagree. With intelligent security features that let you protect your data without walling it off, Power BI will give you more control.
- 13. 18 | Convince Your Boss Power BI Is Best for Your Business Set flexible data access permissions Control with pinpoint accuracy what everyone can see. Because Power BI is already designed to connect to all your data sources, apps, and services, it can be used as a central filter to manage which information your organization chooses to make available and which it does not. However, it also comes with much more nuanced controls. For instance, you can set permission levels for each user, as well as for entire data sources and individual dashboards and reports. This level of specificity will even apply within those dashboards and reports, so that users with different access levels will only see the data that they have permission to view. When combined, these different permission levels will give you complete control over every aspect of your organization’s data. This makes Power BI the perfect solution for a variety of organizations, regardless of how sensitive or open their data is. For example, a healthcare organization with a mixture of private patient files and public information has the flexibility to set a wide range of access levels across data sources, users, and the reports they produce. This makes it easy to ensure that no sensitive information is leaked, while also allowing employees to safely work together on everything else. It’s an elegant solution that strikes a careful balance between security and collaboration. Talking points: • You can set different permission levels per data source, user, dashboard, and report. • Even when users with different permission levels view a dashboard or report, they will only see data that they are allowed to view. • The ability to combine these different permission levels makes Power BI flexible enough to meet the security needs of any organization. More information: Row-level security (RLS) with Power BI
- 14. 19 | Convince Your Boss Power BI Is Best for Your Business Design an effective data governance strategy Empower users and increase efficiency with more control. Data governance refers to the overall strategy that defines who gets to view, edit, and share data, as well as how an organization’s access to data can best be used to further its goals. In the case of a security breach, a good data governance strategy will also be able to hold a specific person or unit accountable, since it dictates who is responsible for each aspect of the organization’s data. Although some data governance strategies put control of all data in the hands of executives or IT departments, more modern strategies will allow individual business units to control the information they use. Called a self-service approach, this strategy lets each unit come up with the most useful application for their data, and often produces much more creative and valuable insights. Despite this, many organizations often shy away from this approach because of security concerns. However, Power BI was designed with just such concerns in mind. It can bring together all your data and give you pinpoint accuracy over access permissions per data source, user, and individual dashboards and reports, it is the perfect tool for implementing a self-service data governance strategy at your organization. The benefits of such a strategy can even go beyond the insights it will produce. For instance, by allowing each business unit to control its own data, it frees up the IT department from having to micromanage each aspect of information coming in, eliminating potential bottlenecks and speeding up business. This is how Power BI can give your organization better efficiency and deeper insights without compromising security. Talking points: • A self-service data governance strategy lets each business unit manage its own data, which can result in greater efficiency and more valuable insights. • Power BI’s nuanced security controls make it possible for an organization to implement a self-service strategy without compromising its security. More information: The data governance and security webinar
- 15. 29 | Convince Your Boss Power BI Is Best for Your Business “Setting up roles and permissions will take too long” Tell them that Power BI was built with data governance in mind. Power BI was designed to be an essential aspect of your organization’s data governance strategy, allowing you to set a variety of security roles and access permissions to reflect all your different types of data needs. To this end, users can easily apply comprehensive rules regarding data sources, organizational roles, and individual reports to ensure various kinds of data can be seen only by those who need to see it. To make this process even faster, different levels of administrators can be assigned within Power BI in accordance with your data governance strategy. For instance, the Global Admin can assign different administrators for each separate data sources or for certain types of data, or whatever else makes sense for your organization. These admins can then go on to give other users specific permissions until your entire organization has been assigned appropriate roles. In this way, setting up roles and permissions can actually be done quite quickly, so long as you have a firm understanding of your data governance strategy ahead of time. Talking points: • Power BI is designed to support data governance and security, including setting up user roles and access permissions. • Users can apply comprehensive rules regarding data sources, organizational roles, and even individual reports. • A Global Admin can assign specific data sources, sets of data, and so on to other administrators, who can then control access permissions beneath them. More information: Power BI admin portal
- 16. 30 | Convince Your Boss Power BI Is Best for Your Business “Connecting all our data will be too difficult” Tell them that this can actually be done in just a few clicks. One of the most important functions of Power BI is its ability to seamlessly connect to a vast number of data sources, apps, and services. Because this is integral to allowing you to quickly begin analyzing and interpreting data, it was essential that the process be as simple as possible. That’s why users can connect Power BI in less than a minute to any of the several hundred services it’s already setup to integrate with. After selecting the appropriate data sources and entering your credentials, Power BI will automatically populate a dashboard with your real-time data, allowing you to start experiencing its value right away. The list of Power BI’s native integrations is long and constantly growing. It includes popular services such as Salesforce, Adobe Analytics, Google Analytics, MailChimp, Marketo, and the Microsoft ecosystem of products, such as Office 365, Dynamics, Azure, and Cortana. New content packs for different services are being released every day in order to keep Power BI up to date. Talking points: • Connecting data to Power BI is an integral part of its service. • You can connect your data to Power BI in less than a minute. • Power BI natively integrates with hundreds of different services, and more are being added every day. More information: Connect to services with content packs for Power BI