SlideShare a Scribd company logo
Data Visualization Nikhil Srivastava, 2015
Nikhil Srivastava
Moringa School
Summer 2015
Data Visualization Nikhil Srivastava, 2015
• What is Data Visualization?
• Thinking and Seeing
• From Data to Graphics
• Principles and Guidelines
• Highcharts and Javascript
• Class Project
introduction
foundation & theory
building blocks
design & critique
construction
Class Summary
Data Visualization Nikhil Srivastava, 2015
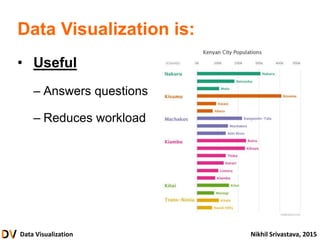
Data Visualization is:
• Useful
– Answers questions
– Reduces workload
Data Visualization Nikhil Srivastava, 2015
Data Visualization is:
• Useful
• Important
– Understand structure
– Resolve ambiguity
– Locate outliers
Data Visualization Nikhil Srivastava, 2015
Data Visualization is:
• Useful
• Important
– Design decisions affect interpretation
Data Visualization Nikhil Srivastava, 2015
Data Visualization is:
• Useful
• Important
• Powerful
– Communicate
– Teach
– Inspire
Data Visualization Nikhil Srivastava, 2015
Data Visualization is:
• Useful
• Important
• Powerful
• Relevant
Data Visualization Nikhil Srivastava, 2015
• What is Data Visualization?
• Thinking and Seeing
• From Data to Graphics
• Principles and Guidelines
• Highcharts and Javascript
• Class Project
introduction
foundation & theory
building blocks
design & critique
construction
Data Visualization Nikhil Srivastava, 2015
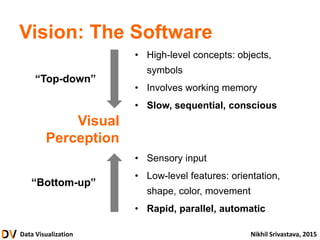
Vision: The Software
• High-level concepts: objects,
symbols
• Involves working memory
• Slow, sequential, conscious
• Sensory input
• Low-level features: orientation,
shape, color, movement
• Rapid, parallel, automatic
Visual
Perception
“Bottom-up”
“Top-down”
Data Visualization Nikhil Srivastava, 2015
Eye != Camera
Data Visualization Nikhil Srivastava, 2015
• What is Data Visualization?
• Thinking and Seeing
• From Data to Graphics
• Principles and Guidelines
• Highcharts and Javascript
• Class Project
introduction
foundation & theory
building blocks
design & critique
construction
Data Visualization Nikhil Srivastava, 2015
From Data to Graphics
What kind
of data do
we have?
How can we
represent the
data visually?
How can we
organize this into
a visualization?
Athi River Machakos 139,380
Awasi Kisumu 93,369
Kangundo-Tala Machakos 218,557
Karuri Kiambu 129,934
Kiambu Kiambu 88,869
Kikuyu Kiambu 233,231
Kisumu Kisumu 409,928
Kitale Trans-Nzoia 106,187
Kitui Kitui 155,896
Limuru Kiambu 104,282
Machakos Machakos 150,041
Molo Nakuru 107,806
Mwingi Kitui 83,803
Naivasha Nakuru 181,966
Nakuru Nakuru 307,990
Nandi Hills Trans-Nzoia 73,626
Visual
Encoding
Data Visualization Nikhil Srivastava, 2015
Data Types
CATEGORICAL ORDINAL NUMERICAL
Interval Ratio
Male / Female
Asia / Africa / Europe
True / False
Small / Med / Large
Low / High
Yes / Maybe / No
Time
Latitude/Longitude
Compass direction
Time
Length
Count
= = = =
< > < > < >
+ - + -
* /
Data Visualization Nikhil Srivastava, 2015
Channel Effectiveness
Data Visualization Nikhil Srivastava, 2015
Chart Types
SCATTER LINE
BAR PIE
Data Visualization Nikhil Srivastava, 2015
More Chart Types
• Stacked/Grouped Charts
• Treemap
• Multi-level Pie
• Heat Map
• Choropleth/Cartogram
Data Visualization Nikhil Srivastava, 2015
• What is Data Visualization?
• Thinking and Seeing
• From Data to Graphics
• Principles and Guidelines
• Highcharts and Javascript
• Class Project
introduction
foundation & theory
building blocks
design & critique
construction
Data Visualization Nikhil Srivastava, 2015
Design Principles
Data Visualization Nikhil Srivastava, 2015
Design Principles
• Integrity
– Tell the truth with data
• Effectiveness
– Achieve visualization objectives
• Aesthetics
– Be compelling, vivid, beautiful
Data Visualization Nikhil Srivastava, 2015
Examples
Data Visualization Nikhil Srivastava, 2015
• What is Data Visualization?
• Thinking and Seeing
• From Data to Graphics
• Principles and Guidelines
• Highcharts and Javascript
• Class Project
introduction
foundation & theory
building blocks
design & critique
construction
Data Visualization Nikhil Srivastava, 2015
• What is Data Visualization?
• Thinking and Seeing
• From Data to Graphics
• Principles and Guidelines
• Highcharts and Javascript
• Class Project
introduction
foundation & theory
building blocks
design & critique
construction
Data Visualization Nikhil Srivastava, 2015
The Ebb and Flow of Movies
NY Times, 2008
Advanced Visualizations
Data Visualization Nikhil Srivastava, 2015
Word Cloud - “Data Visualization” Wikipedia Page
Wordle
Data Visualization Nikhil Srivastava, 2015
ZIPScribble
Robert Kosara, 2006
Data Visualization Nikhil Srivastava, 2015
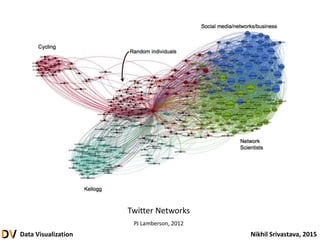
Twitter Networks
PJ Lamberson, 2012
Data Visualization Nikhil Srivastava, 2015
Blogs
• Infosthetics.com
• Visualizing.org
• FlowingData.com
Data Visualization Nikhil Srivastava, 2015
Class Website
• Send me your final projects!
• Will be updated with future classes
Data Visualization Nikhil Srivastava, 2015
Nikhil Srivastava
Moringa School
Summer 2015

More Related Content

Viewers also liked

Social data visualization
Social data visualizationSocial data visualization
Social data visualization
Cristina Serban
 
Data visualization in JavaScript
Data visualization in JavaScriptData visualization in JavaScript
Data visualization in JavaScript
Wenting ZHAO
 
New Tools for Visualization in JavaScript - Sept. 2011
New Tools for Visualization in JavaScript - Sept. 2011New Tools for Visualization in JavaScript - Sept. 2011
New Tools for Visualization in JavaScript - Sept. 2011
philogb
 
Using Web Standards to create Interactive Data Visualizations for the Web
Using Web Standards to create Interactive Data Visualizations for the WebUsing Web Standards to create Interactive Data Visualizations for the Web
Using Web Standards to create Interactive Data Visualizations for the Web
philogb
 
Up and Down the Python Data & Web Visualization Stack by Rob Story PyData SV ...
Up and Down the Python Data & Web Visualization Stack by Rob Story PyData SV ...Up and Down the Python Data & Web Visualization Stack by Rob Story PyData SV ...
Up and Down the Python Data & Web Visualization Stack by Rob Story PyData SV ...
PyData
 
Data Visualization in Health
Data Visualization in HealthData Visualization in Health
Data Visualization in Health
Ramon Martinez
 
Visualized Conference and jQuery Conference
Visualized Conference and jQuery ConferenceVisualized Conference and jQuery Conference
Visualized Conference and jQuery Conference
Keiichiro Ono
 

Viewers also liked (7)

Social data visualization
Social data visualizationSocial data visualization
Social data visualization
 
Data visualization in JavaScript
Data visualization in JavaScriptData visualization in JavaScript
Data visualization in JavaScript
 
New Tools for Visualization in JavaScript - Sept. 2011
New Tools for Visualization in JavaScript - Sept. 2011New Tools for Visualization in JavaScript - Sept. 2011
New Tools for Visualization in JavaScript - Sept. 2011
 
Using Web Standards to create Interactive Data Visualizations for the Web
Using Web Standards to create Interactive Data Visualizations for the WebUsing Web Standards to create Interactive Data Visualizations for the Web
Using Web Standards to create Interactive Data Visualizations for the Web
 
Up and Down the Python Data & Web Visualization Stack by Rob Story PyData SV ...
Up and Down the Python Data & Web Visualization Stack by Rob Story PyData SV ...Up and Down the Python Data & Web Visualization Stack by Rob Story PyData SV ...
Up and Down the Python Data & Web Visualization Stack by Rob Story PyData SV ...
 
Data Visualization in Health
Data Visualization in HealthData Visualization in Health
Data Visualization in Health
 
Visualized Conference and jQuery Conference
Visualized Conference and jQuery ConferenceVisualized Conference and jQuery Conference
Visualized Conference and jQuery Conference
 

Similar to Advanced Visualizations

From Data To Graphics
From Data To GraphicsFrom Data To Graphics
From Data To Graphics
nsrivast
 
Enhancing Performance through Data-led Decision Making
Enhancing Performance through Data-led Decision MakingEnhancing Performance through Data-led Decision Making
Enhancing Performance through Data-led Decision Making
College Development Network
 
Using Analytics to Deliver Engaging Courses
Using Analytics to Deliver Engaging CoursesUsing Analytics to Deliver Engaging Courses
Using Analytics to Deliver Engaging Courses
Lambda Solutions
 
Assure Creative Projects Deliver Awesome Business Results
Assure Creative Projects Deliver Awesome Business ResultsAssure Creative Projects Deliver Awesome Business Results
Assure Creative Projects Deliver Awesome Business Results
maryat
 
Taking portfolio benefits management to the next level with modern analytics ...
Taking portfolio benefits management to the next level with modern analytics ...Taking portfolio benefits management to the next level with modern analytics ...
Taking portfolio benefits management to the next level with modern analytics ...
Association for Project Management
 
How and Why of IABC Gold Quill Awards
How and Why of IABC Gold Quill AwardsHow and Why of IABC Gold Quill Awards
How and Why of IABC Gold Quill Awards
IABC France
 
Statify digital consulting an introduction
Statify digital consulting   an introductionStatify digital consulting   an introduction
Statify digital consulting an introduction
Satya Srinivas
 
7 steps to a successful itsm tool implementation - itsmf atlanta
7 steps to a successful itsm tool implementation - itsmf atlanta7 steps to a successful itsm tool implementation - itsmf atlanta
7 steps to a successful itsm tool implementation - itsmf atlanta
Navvia
 
Getting started with an Agile career
Getting started with an Agile careerGetting started with an Agile career
Getting started with an Agile career
Sathpal Singh FBCS CITP FCMI CMgr
 
Data Driven Desicion Making
Data Driven Desicion MakingData Driven Desicion Making
Data Driven Desicion Making
Carl Chiang
 
What's important and what isn't
What's important and what isn'tWhat's important and what isn't
What's important and what isn't
twcmad
 
Shiryra Crabb's Resume 2016
Shiryra Crabb's Resume 2016Shiryra Crabb's Resume 2016
Shiryra Crabb's Resume 2016
Shiryra Crabb
 
Data analytics techniques and tools.pptx
Data analytics techniques and tools.pptxData analytics techniques and tools.pptx
Data analytics techniques and tools.pptx
LN Mishra CBAP
 
Effektiv ledelse skaber værdidrevne teams - Karolina Jackson-Ward Manager Cus...
Effektiv ledelse skaber værdidrevne teams - Karolina Jackson-Ward Manager Cus...Effektiv ledelse skaber værdidrevne teams - Karolina Jackson-Ward Manager Cus...
Effektiv ledelse skaber værdidrevne teams - Karolina Jackson-Ward Manager Cus...
Mediehuset Ingeniøren Live
 
Data to Insights with Gogo's Data Science Lead
Data to Insights with Gogo's Data Science LeadData to Insights with Gogo's Data Science Lead
Data to Insights with Gogo's Data Science Lead
Promotable
 
From Data to Profits: Ingredients for Successful Data-Driven Business Develop...
From Data to Profits: Ingredients for Successful Data-Driven Business Develop...From Data to Profits: Ingredients for Successful Data-Driven Business Develop...
From Data to Profits: Ingredients for Successful Data-Driven Business Develop...
Center for Services Leadership, W.P.Carey School of Business, ASU
 
Data Analytics: From Basic Skills to Executive Decision-Making
Data Analytics: From Basic Skills to Executive Decision-MakingData Analytics: From Basic Skills to Executive Decision-Making
Data Analytics: From Basic Skills to Executive Decision-Making
Training Industry Conference & Expo
 
George Brown College TETR9031 Instructional Design - Session 1
George Brown College TETR9031 Instructional Design - Session 1George Brown College TETR9031 Instructional Design - Session 1
George Brown College TETR9031 Instructional Design - Session 1
Frank R. Morris
 
"The Business of Data" workshop, Ishai Shamir @Producttank TLV, September 2017
"The Business of Data" workshop, Ishai Shamir @Producttank TLV, September 2017 "The Business of Data" workshop, Ishai Shamir @Producttank TLV, September 2017
"The Business of Data" workshop, Ishai Shamir @Producttank TLV, September 2017
ProductTank TLV
 
Building digital capability
Building digital capabilityBuilding digital capability
Building digital capability
Jisc
 

Similar to Advanced Visualizations (20)

From Data To Graphics
From Data To GraphicsFrom Data To Graphics
From Data To Graphics
 
Enhancing Performance through Data-led Decision Making
Enhancing Performance through Data-led Decision MakingEnhancing Performance through Data-led Decision Making
Enhancing Performance through Data-led Decision Making
 
Using Analytics to Deliver Engaging Courses
Using Analytics to Deliver Engaging CoursesUsing Analytics to Deliver Engaging Courses
Using Analytics to Deliver Engaging Courses
 
Assure Creative Projects Deliver Awesome Business Results
Assure Creative Projects Deliver Awesome Business ResultsAssure Creative Projects Deliver Awesome Business Results
Assure Creative Projects Deliver Awesome Business Results
 
Taking portfolio benefits management to the next level with modern analytics ...
Taking portfolio benefits management to the next level with modern analytics ...Taking portfolio benefits management to the next level with modern analytics ...
Taking portfolio benefits management to the next level with modern analytics ...
 
How and Why of IABC Gold Quill Awards
How and Why of IABC Gold Quill AwardsHow and Why of IABC Gold Quill Awards
How and Why of IABC Gold Quill Awards
 
Statify digital consulting an introduction
Statify digital consulting   an introductionStatify digital consulting   an introduction
Statify digital consulting an introduction
 
7 steps to a successful itsm tool implementation - itsmf atlanta
7 steps to a successful itsm tool implementation - itsmf atlanta7 steps to a successful itsm tool implementation - itsmf atlanta
7 steps to a successful itsm tool implementation - itsmf atlanta
 
Getting started with an Agile career
Getting started with an Agile careerGetting started with an Agile career
Getting started with an Agile career
 
Data Driven Desicion Making
Data Driven Desicion MakingData Driven Desicion Making
Data Driven Desicion Making
 
What's important and what isn't
What's important and what isn'tWhat's important and what isn't
What's important and what isn't
 
Shiryra Crabb's Resume 2016
Shiryra Crabb's Resume 2016Shiryra Crabb's Resume 2016
Shiryra Crabb's Resume 2016
 
Data analytics techniques and tools.pptx
Data analytics techniques and tools.pptxData analytics techniques and tools.pptx
Data analytics techniques and tools.pptx
 
Effektiv ledelse skaber værdidrevne teams - Karolina Jackson-Ward Manager Cus...
Effektiv ledelse skaber værdidrevne teams - Karolina Jackson-Ward Manager Cus...Effektiv ledelse skaber værdidrevne teams - Karolina Jackson-Ward Manager Cus...
Effektiv ledelse skaber værdidrevne teams - Karolina Jackson-Ward Manager Cus...
 
Data to Insights with Gogo's Data Science Lead
Data to Insights with Gogo's Data Science LeadData to Insights with Gogo's Data Science Lead
Data to Insights with Gogo's Data Science Lead
 
From Data to Profits: Ingredients for Successful Data-Driven Business Develop...
From Data to Profits: Ingredients for Successful Data-Driven Business Develop...From Data to Profits: Ingredients for Successful Data-Driven Business Develop...
From Data to Profits: Ingredients for Successful Data-Driven Business Develop...
 
Data Analytics: From Basic Skills to Executive Decision-Making
Data Analytics: From Basic Skills to Executive Decision-MakingData Analytics: From Basic Skills to Executive Decision-Making
Data Analytics: From Basic Skills to Executive Decision-Making
 
George Brown College TETR9031 Instructional Design - Session 1
George Brown College TETR9031 Instructional Design - Session 1George Brown College TETR9031 Instructional Design - Session 1
George Brown College TETR9031 Instructional Design - Session 1
 
"The Business of Data" workshop, Ishai Shamir @Producttank TLV, September 2017
"The Business of Data" workshop, Ishai Shamir @Producttank TLV, September 2017 "The Business of Data" workshop, Ishai Shamir @Producttank TLV, September 2017
"The Business of Data" workshop, Ishai Shamir @Producttank TLV, September 2017
 
Building digital capability
Building digital capabilityBuilding digital capability
Building digital capability
 

Recently uploaded

How to Manage Your Lost Opportunities in Odoo 17 CRM
How to Manage Your Lost Opportunities in Odoo 17 CRMHow to Manage Your Lost Opportunities in Odoo 17 CRM
How to Manage Your Lost Opportunities in Odoo 17 CRM
Celine George
 
RPMS TEMPLATE FOR SCHOOL YEAR 2023-2024 FOR TEACHER 1 TO TEACHER 3
RPMS TEMPLATE FOR SCHOOL YEAR 2023-2024 FOR TEACHER 1 TO TEACHER 3RPMS TEMPLATE FOR SCHOOL YEAR 2023-2024 FOR TEACHER 1 TO TEACHER 3
RPMS TEMPLATE FOR SCHOOL YEAR 2023-2024 FOR TEACHER 1 TO TEACHER 3
IreneSebastianRueco1
 
Life upper-Intermediate B2 Workbook for student
Life upper-Intermediate B2 Workbook for studentLife upper-Intermediate B2 Workbook for student
Life upper-Intermediate B2 Workbook for student
NgcHiNguyn25
 
Pollock and Snow "DEIA in the Scholarly Landscape, Session One: Setting Expec...
Pollock and Snow "DEIA in the Scholarly Landscape, Session One: Setting Expec...Pollock and Snow "DEIA in the Scholarly Landscape, Session One: Setting Expec...
Pollock and Snow "DEIA in the Scholarly Landscape, Session One: Setting Expec...
National Information Standards Organization (NISO)
 
Exploiting Artificial Intelligence for Empowering Researchers and Faculty, In...
Exploiting Artificial Intelligence for Empowering Researchers and Faculty, In...Exploiting Artificial Intelligence for Empowering Researchers and Faculty, In...
Exploiting Artificial Intelligence for Empowering Researchers and Faculty, In...
Dr. Vinod Kumar Kanvaria
 
Advanced Java[Extra Concepts, Not Difficult].docx
Advanced Java[Extra Concepts, Not Difficult].docxAdvanced Java[Extra Concepts, Not Difficult].docx
Advanced Java[Extra Concepts, Not Difficult].docx
adhitya5119
 
C1 Rubenstein AP HuG xxxxxxxxxxxxxx.pptx
C1 Rubenstein AP HuG xxxxxxxxxxxxxx.pptxC1 Rubenstein AP HuG xxxxxxxxxxxxxx.pptx
C1 Rubenstein AP HuG xxxxxxxxxxxxxx.pptx
mulvey2
 
বাংলাদেশ অর্থনৈতিক সমীক্ষা (Economic Review) ২০২৪ UJS App.pdf
বাংলাদেশ অর্থনৈতিক সমীক্ষা (Economic Review) ২০২৪ UJS App.pdfবাংলাদেশ অর্থনৈতিক সমীক্ষা (Economic Review) ২০২৪ UJS App.pdf
বাংলাদেশ অর্থনৈতিক সমীক্ষা (Economic Review) ২০২৪ UJS App.pdf
eBook.com.bd (প্রয়োজনীয় বাংলা বই)
 
ANATOMY AND BIOMECHANICS OF HIP JOINT.pdf
ANATOMY AND BIOMECHANICS OF HIP JOINT.pdfANATOMY AND BIOMECHANICS OF HIP JOINT.pdf
ANATOMY AND BIOMECHANICS OF HIP JOINT.pdf
Priyankaranawat4
 
How to Build a Module in Odoo 17 Using the Scaffold Method
How to Build a Module in Odoo 17 Using the Scaffold MethodHow to Build a Module in Odoo 17 Using the Scaffold Method
How to Build a Module in Odoo 17 Using the Scaffold Method
Celine George
 
LAND USE LAND COVER AND NDVI OF MIRZAPUR DISTRICT, UP
LAND USE LAND COVER AND NDVI OF MIRZAPUR DISTRICT, UPLAND USE LAND COVER AND NDVI OF MIRZAPUR DISTRICT, UP
LAND USE LAND COVER AND NDVI OF MIRZAPUR DISTRICT, UP
RAHUL
 
Azure Interview Questions and Answers PDF By ScholarHat
Azure Interview Questions and Answers PDF By ScholarHatAzure Interview Questions and Answers PDF By ScholarHat
Azure Interview Questions and Answers PDF By ScholarHat
Scholarhat
 
The simplified electron and muon model, Oscillating Spacetime: The Foundation...
The simplified electron and muon model, Oscillating Spacetime: The Foundation...The simplified electron and muon model, Oscillating Spacetime: The Foundation...
The simplified electron and muon model, Oscillating Spacetime: The Foundation...
RitikBhardwaj56
 
How to Setup Warehouse & Location in Odoo 17 Inventory
How to Setup Warehouse & Location in Odoo 17 InventoryHow to Setup Warehouse & Location in Odoo 17 Inventory
How to Setup Warehouse & Location in Odoo 17 Inventory
Celine George
 
Main Java[All of the Base Concepts}.docx
Main Java[All of the Base Concepts}.docxMain Java[All of the Base Concepts}.docx
Main Java[All of the Base Concepts}.docx
adhitya5119
 
Film vocab for eal 3 students: Australia the movie
Film vocab for eal 3 students: Australia the movieFilm vocab for eal 3 students: Australia the movie
Film vocab for eal 3 students: Australia the movie
Nicholas Montgomery
 
Digital Artefact 1 - Tiny Home Environmental Design
Digital Artefact 1 - Tiny Home Environmental DesignDigital Artefact 1 - Tiny Home Environmental Design
Digital Artefact 1 - Tiny Home Environmental Design
amberjdewit93
 
South African Journal of Science: Writing with integrity workshop (2024)
South African Journal of Science: Writing with integrity workshop (2024)South African Journal of Science: Writing with integrity workshop (2024)
South African Journal of Science: Writing with integrity workshop (2024)
Academy of Science of South Africa
 
The Diamonds of 2023-2024 in the IGRA collection
The Diamonds of 2023-2024 in the IGRA collectionThe Diamonds of 2023-2024 in the IGRA collection
The Diamonds of 2023-2024 in the IGRA collection
Israel Genealogy Research Association
 
A Independência da América Espanhola LAPBOOK.pdf
A Independência da América Espanhola LAPBOOK.pdfA Independência da América Espanhola LAPBOOK.pdf
A Independência da América Espanhola LAPBOOK.pdf
Jean Carlos Nunes Paixão
 

Recently uploaded (20)

How to Manage Your Lost Opportunities in Odoo 17 CRM
How to Manage Your Lost Opportunities in Odoo 17 CRMHow to Manage Your Lost Opportunities in Odoo 17 CRM
How to Manage Your Lost Opportunities in Odoo 17 CRM
 
RPMS TEMPLATE FOR SCHOOL YEAR 2023-2024 FOR TEACHER 1 TO TEACHER 3
RPMS TEMPLATE FOR SCHOOL YEAR 2023-2024 FOR TEACHER 1 TO TEACHER 3RPMS TEMPLATE FOR SCHOOL YEAR 2023-2024 FOR TEACHER 1 TO TEACHER 3
RPMS TEMPLATE FOR SCHOOL YEAR 2023-2024 FOR TEACHER 1 TO TEACHER 3
 
Life upper-Intermediate B2 Workbook for student
Life upper-Intermediate B2 Workbook for studentLife upper-Intermediate B2 Workbook for student
Life upper-Intermediate B2 Workbook for student
 
Pollock and Snow "DEIA in the Scholarly Landscape, Session One: Setting Expec...
Pollock and Snow "DEIA in the Scholarly Landscape, Session One: Setting Expec...Pollock and Snow "DEIA in the Scholarly Landscape, Session One: Setting Expec...
Pollock and Snow "DEIA in the Scholarly Landscape, Session One: Setting Expec...
 
Exploiting Artificial Intelligence for Empowering Researchers and Faculty, In...
Exploiting Artificial Intelligence for Empowering Researchers and Faculty, In...Exploiting Artificial Intelligence for Empowering Researchers and Faculty, In...
Exploiting Artificial Intelligence for Empowering Researchers and Faculty, In...
 
Advanced Java[Extra Concepts, Not Difficult].docx
Advanced Java[Extra Concepts, Not Difficult].docxAdvanced Java[Extra Concepts, Not Difficult].docx
Advanced Java[Extra Concepts, Not Difficult].docx
 
C1 Rubenstein AP HuG xxxxxxxxxxxxxx.pptx
C1 Rubenstein AP HuG xxxxxxxxxxxxxx.pptxC1 Rubenstein AP HuG xxxxxxxxxxxxxx.pptx
C1 Rubenstein AP HuG xxxxxxxxxxxxxx.pptx
 
বাংলাদেশ অর্থনৈতিক সমীক্ষা (Economic Review) ২০২৪ UJS App.pdf
বাংলাদেশ অর্থনৈতিক সমীক্ষা (Economic Review) ২০২৪ UJS App.pdfবাংলাদেশ অর্থনৈতিক সমীক্ষা (Economic Review) ২০২৪ UJS App.pdf
বাংলাদেশ অর্থনৈতিক সমীক্ষা (Economic Review) ২০২৪ UJS App.pdf
 
ANATOMY AND BIOMECHANICS OF HIP JOINT.pdf
ANATOMY AND BIOMECHANICS OF HIP JOINT.pdfANATOMY AND BIOMECHANICS OF HIP JOINT.pdf
ANATOMY AND BIOMECHANICS OF HIP JOINT.pdf
 
How to Build a Module in Odoo 17 Using the Scaffold Method
How to Build a Module in Odoo 17 Using the Scaffold MethodHow to Build a Module in Odoo 17 Using the Scaffold Method
How to Build a Module in Odoo 17 Using the Scaffold Method
 
LAND USE LAND COVER AND NDVI OF MIRZAPUR DISTRICT, UP
LAND USE LAND COVER AND NDVI OF MIRZAPUR DISTRICT, UPLAND USE LAND COVER AND NDVI OF MIRZAPUR DISTRICT, UP
LAND USE LAND COVER AND NDVI OF MIRZAPUR DISTRICT, UP
 
Azure Interview Questions and Answers PDF By ScholarHat
Azure Interview Questions and Answers PDF By ScholarHatAzure Interview Questions and Answers PDF By ScholarHat
Azure Interview Questions and Answers PDF By ScholarHat
 
The simplified electron and muon model, Oscillating Spacetime: The Foundation...
The simplified electron and muon model, Oscillating Spacetime: The Foundation...The simplified electron and muon model, Oscillating Spacetime: The Foundation...
The simplified electron and muon model, Oscillating Spacetime: The Foundation...
 
How to Setup Warehouse & Location in Odoo 17 Inventory
How to Setup Warehouse & Location in Odoo 17 InventoryHow to Setup Warehouse & Location in Odoo 17 Inventory
How to Setup Warehouse & Location in Odoo 17 Inventory
 
Main Java[All of the Base Concepts}.docx
Main Java[All of the Base Concepts}.docxMain Java[All of the Base Concepts}.docx
Main Java[All of the Base Concepts}.docx
 
Film vocab for eal 3 students: Australia the movie
Film vocab for eal 3 students: Australia the movieFilm vocab for eal 3 students: Australia the movie
Film vocab for eal 3 students: Australia the movie
 
Digital Artefact 1 - Tiny Home Environmental Design
Digital Artefact 1 - Tiny Home Environmental DesignDigital Artefact 1 - Tiny Home Environmental Design
Digital Artefact 1 - Tiny Home Environmental Design
 
South African Journal of Science: Writing with integrity workshop (2024)
South African Journal of Science: Writing with integrity workshop (2024)South African Journal of Science: Writing with integrity workshop (2024)
South African Journal of Science: Writing with integrity workshop (2024)
 
The Diamonds of 2023-2024 in the IGRA collection
The Diamonds of 2023-2024 in the IGRA collectionThe Diamonds of 2023-2024 in the IGRA collection
The Diamonds of 2023-2024 in the IGRA collection
 
A Independência da América Espanhola LAPBOOK.pdf
A Independência da América Espanhola LAPBOOK.pdfA Independência da América Espanhola LAPBOOK.pdf
A Independência da América Espanhola LAPBOOK.pdf
 

Advanced Visualizations

  • 1. Data Visualization Nikhil Srivastava, 2015 Nikhil Srivastava Moringa School Summer 2015
  • 2. Data Visualization Nikhil Srivastava, 2015 • What is Data Visualization? • Thinking and Seeing • From Data to Graphics • Principles and Guidelines • Highcharts and Javascript • Class Project introduction foundation & theory building blocks design & critique construction Class Summary
  • 3. Data Visualization Nikhil Srivastava, 2015 Data Visualization is: • Useful – Answers questions – Reduces workload
  • 4. Data Visualization Nikhil Srivastava, 2015 Data Visualization is: • Useful • Important – Understand structure – Resolve ambiguity – Locate outliers
  • 5. Data Visualization Nikhil Srivastava, 2015 Data Visualization is: • Useful • Important – Design decisions affect interpretation
  • 6. Data Visualization Nikhil Srivastava, 2015 Data Visualization is: • Useful • Important • Powerful – Communicate – Teach – Inspire
  • 7. Data Visualization Nikhil Srivastava, 2015 Data Visualization is: • Useful • Important • Powerful • Relevant
  • 8. Data Visualization Nikhil Srivastava, 2015 • What is Data Visualization? • Thinking and Seeing • From Data to Graphics • Principles and Guidelines • Highcharts and Javascript • Class Project introduction foundation & theory building blocks design & critique construction
  • 9. Data Visualization Nikhil Srivastava, 2015 Vision: The Software • High-level concepts: objects, symbols • Involves working memory • Slow, sequential, conscious • Sensory input • Low-level features: orientation, shape, color, movement • Rapid, parallel, automatic Visual Perception “Bottom-up” “Top-down”
  • 10. Data Visualization Nikhil Srivastava, 2015 Eye != Camera
  • 11. Data Visualization Nikhil Srivastava, 2015 • What is Data Visualization? • Thinking and Seeing • From Data to Graphics • Principles and Guidelines • Highcharts and Javascript • Class Project introduction foundation & theory building blocks design & critique construction
  • 12. Data Visualization Nikhil Srivastava, 2015 From Data to Graphics What kind of data do we have? How can we represent the data visually? How can we organize this into a visualization? Athi River Machakos 139,380 Awasi Kisumu 93,369 Kangundo-Tala Machakos 218,557 Karuri Kiambu 129,934 Kiambu Kiambu 88,869 Kikuyu Kiambu 233,231 Kisumu Kisumu 409,928 Kitale Trans-Nzoia 106,187 Kitui Kitui 155,896 Limuru Kiambu 104,282 Machakos Machakos 150,041 Molo Nakuru 107,806 Mwingi Kitui 83,803 Naivasha Nakuru 181,966 Nakuru Nakuru 307,990 Nandi Hills Trans-Nzoia 73,626 Visual Encoding
  • 13. Data Visualization Nikhil Srivastava, 2015 Data Types CATEGORICAL ORDINAL NUMERICAL Interval Ratio Male / Female Asia / Africa / Europe True / False Small / Med / Large Low / High Yes / Maybe / No Time Latitude/Longitude Compass direction Time Length Count = = = = < > < > < > + - + - * /
  • 14. Data Visualization Nikhil Srivastava, 2015 Channel Effectiveness
  • 15. Data Visualization Nikhil Srivastava, 2015 Chart Types SCATTER LINE BAR PIE
  • 16. Data Visualization Nikhil Srivastava, 2015 More Chart Types • Stacked/Grouped Charts • Treemap • Multi-level Pie • Heat Map • Choropleth/Cartogram
  • 17. Data Visualization Nikhil Srivastava, 2015 • What is Data Visualization? • Thinking and Seeing • From Data to Graphics • Principles and Guidelines • Highcharts and Javascript • Class Project introduction foundation & theory building blocks design & critique construction
  • 18. Data Visualization Nikhil Srivastava, 2015 Design Principles
  • 19. Data Visualization Nikhil Srivastava, 2015 Design Principles • Integrity – Tell the truth with data • Effectiveness – Achieve visualization objectives • Aesthetics – Be compelling, vivid, beautiful
  • 20. Data Visualization Nikhil Srivastava, 2015 Examples
  • 21. Data Visualization Nikhil Srivastava, 2015 • What is Data Visualization? • Thinking and Seeing • From Data to Graphics • Principles and Guidelines • Highcharts and Javascript • Class Project introduction foundation & theory building blocks design & critique construction
  • 22. Data Visualization Nikhil Srivastava, 2015 • What is Data Visualization? • Thinking and Seeing • From Data to Graphics • Principles and Guidelines • Highcharts and Javascript • Class Project introduction foundation & theory building blocks design & critique construction
  • 23. Data Visualization Nikhil Srivastava, 2015 The Ebb and Flow of Movies NY Times, 2008 Advanced Visualizations
  • 24. Data Visualization Nikhil Srivastava, 2015 Word Cloud - “Data Visualization” Wikipedia Page Wordle
  • 25. Data Visualization Nikhil Srivastava, 2015 ZIPScribble Robert Kosara, 2006
  • 26. Data Visualization Nikhil Srivastava, 2015 Twitter Networks PJ Lamberson, 2012
  • 27. Data Visualization Nikhil Srivastava, 2015 Blogs • Infosthetics.com • Visualizing.org • FlowingData.com
  • 28. Data Visualization Nikhil Srivastava, 2015 Class Website • Send me your final projects! • Will be updated with future classes
  • 29. Data Visualization Nikhil Srivastava, 2015 Nikhil Srivastava Moringa School Summer 2015