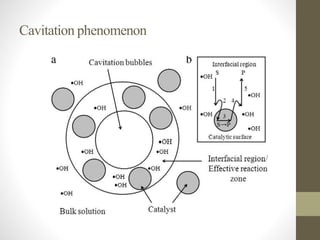
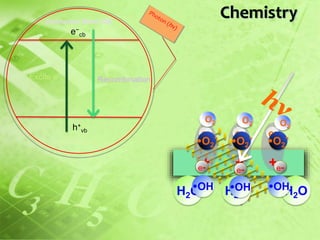
This document investigates the lack of correlation between the degradation of organic pollutants and the concurrently formed hydrogen peroxide (H2O2) during sono, photo, and sonophotocatalytic processes. It finds that sono, photo, and sonophotocatalytic degradation of phenol generates H2O2 as an intermediate and final product. The concentration of H2O2 oscillates during sono and photocatalysis due to competing formation and decomposition, while it stabilizes during sonophotocatalysis. The oscillations depend on concentration, with formation or decomposition dominating at times, causing concentration increases or decreases. In the absence of sufficient oxygen, H2O2 acts as
![US UV US+UV
0
20
40
60
80
%
Degradation
of
phenol
[ZnO] : 100mg/L
[Phenol] : 40mg/L
pH : 5.5
Time : 2 hr
Fig 1: Sono, Photo and Sonophotocatalytic degradation
of phenol in presence of ZnO](https://image.slidesharecdn.com/taparppt-240316171911-9214b240/85/Advanced-Oxidation-Process-and-Son-Photo-Catalysis-7-320.jpg)

![0 30 60 90 120 150 180
0
5
10
15
20
25
30
Conc
of
H
2
O
2
(mg/L)
Time(min)
US
UV
US+UV
[ZnO] : 100 mg/L
[Phenol] : 40 mg/L
pH : 5.5
Fig 2: Concentration of H2O2 during the Sono, Photo and Sonophotocatalytic
degradation of phenol in presence of ZnO](https://image.slidesharecdn.com/taparppt-240316171911-9214b240/85/Advanced-Oxidation-Process-and-Son-Photo-Catalysis-9-320.jpg)
![0.00 0.05 0.10 0.15 0.20 0.25
10
20
30
40
50
60
70
80
90
%
Degradation
of
phenol
ZnO loading(g/L)
US
UV
US+UV
[Phenol]: 40 mg/L
pH : 5.5
Vol. : 50 mL
Time : 2 hr
Fig 3: Effect of catalyst loading on the Sono, Photo and Sonophotocatalytic
degradation of phenol in presence of ZnO](https://image.slidesharecdn.com/taparppt-240316171911-9214b240/85/Advanced-Oxidation-Process-and-Son-Photo-Catalysis-10-320.jpg)
![0 30 60 90 120 150 180
0
5
10
15
20
25
30
35
Conc.
of
H
2
O
2
(mg/L)
Time (min)
US
US+H2O2
UV
UV+H2O2
US+UV
US+UV+H2O2
[ZnO] : 100mg/L
[Phenol] : 40mg/L
[H2O2] : 15mg/L
pH : 5.5
Fig 4: Effect of added H2O2 on the net concentration of H2O2
under Sono, Photo and Sonophotocatalysis](https://image.slidesharecdn.com/taparppt-240316171911-9214b240/85/Advanced-Oxidation-Process-and-Son-Photo-Catalysis-11-320.jpg)


![Ultrasonic reactions [autosaved]](https://cdn.slidesharecdn.com/ss_thumbnails/ultrasonicreactionsautosaved-211008145954-thumbnail.jpg?width=640&height=640&fit=bounds)


