Download as PDF, PPTX
![4 © 2016 CA. ALL RIGHTS RESERVED.@CAWORLD #CAWORLD
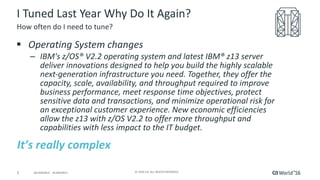
I Tuned Last Year Why Do It Again?
§ Hardware changes
– IBM z13 - The Processor Unit chip (PU chip) measures 678 mm2
and consists of 3.99 billion transistors fabricated using IBM's 22 nm
CMOS silicon on insulator fabrication process, using 17 metal layers
and supporting speeds of 5.2 GHz, which is less than its predecessor, the
zEC12.[3][5] The PU chip can have six, seven or eight cores
(or "processor units" in IBM's parlance) enabled depending on
configuration. New for the z13 is that the PU chip comes packaged
in single chip modules, which is a big change from all previous
mainframe processors that were mounted on large multi-chip modules.
How often do I need to tune?
It’s really fast](https://image.slidesharecdn.com/mfx66eamfx66ea20161117132642-170106182235/85/Advanced-DBA-Performance-Tuning-for-MUF-Part-I-4-320.jpg)


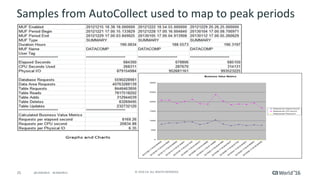


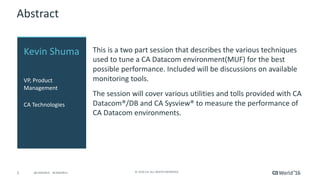
This document summarizes a two-part presentation on techniques for tuning a CA Datacom environment (MUF) for optimal performance. It discusses tools for measuring performance like AutoInfo, AutoCollect, and CA SYSVIEW. It also covers factors that influence total cost of ownership (TCO) like CPU usage, I/O, and storage. Regular monitoring and benchmarking are recommended to identify opportunities to reduce resource consumption and TCO as hardware, software, databases and workloads change over time.


