Online examination system is a non removable examination pattern of today’s life. We need more time saving and more accurate examination system as the number of applicants is increasing day by day. For all IT students and professionals, it is very important to have some basic understanding about the online examination system. On this site you will get source code with the running project. It will help you to understand the concept of the project. Here you find project in php free download.
FEA Based Level 3 Assessment of Deformed Tanks with Fluid Induced Loads
Administrator of Online Examination has multiple features such as Add, Delete, Update Topics and Question.
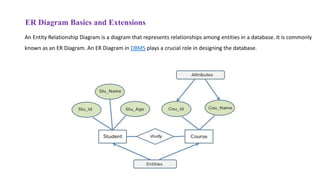
1. ER Diagram Basics and Extensions
An Entity Relationship Diagram is a diagram that represents relationships among entities in a database. It is commonly
known as an ER Diagram. An ER Diagram in DBMS plays a crucial role in designing the database.
2. ER Diagram Basics and Extensions
An Entity Relationship Diagram is a diagram that represents relationships among entities in a database. It is
commonly known as an ER Diagram. An ER Diagram in DBMS plays a crucial role in designing the
database.
An Entity Relationship Diagram (ER Diagram) pictorially explains the relationship between entities
to be stored in a database. Fundamentally, the ER Diagram is a structural design of the database. It
acts as a framework created with specialized symbols for the purpose of defining the relationship
between the database entities. ER diagram is created based on three principal components: entities,
attributes, and relationships.
Peter Chen proposed ER Diagrams in 1971 to create a uniform convention that can be used as a conceptual
modeling tool. Many models were presented and discussed, but none were suitable. The data structure
diagrams offered by Charles Bachman also inspired his model.
3. ER Diagram Basics and Extensions
Why Use ER Diagrams in DBMS?
ER Diagram helps you conceptualize the database and lets you know which fields need to be embedded
for a particular entity
ER Diagram gives a better understanding of the information to be stored in a database
It reduces complexity and allows database designers to build databases quickly
It helps to describe elements using Entity-Relationship models
It allows users to get a preview of the logical structure of the database
4. ER Diagram Basics and Extensions
Symbols Used in ER Diagrams
Rectangles: This Entity Relationship Diagram symbol represents entity types
Ellipses: This symbol represents attributes
Diamonds: This symbol represents relationship types
Lines: It links attributes to entity types and entity types with other relationship types
Primary key: Here, it underlines the attributes
Double Ellipses: Represents multi-valued attributes
6. ER Diagram Basics and Extensions
Components of ER Diagram
Entitiy, Attributes, Relationships etc form the components of ER Diagram and there are defined symbols
and shapes to represent each one of them.
Entity
Simple rectangular box represents an Entity.
7. ER Diagram Basics and Extensions
Components of ER Diagram
Relationships between Entities - Weak and Strong
Rhombus is used to setup relationships between two or more entities.
8. ER Diagram Basics and Extensions
Components of ER Diagram
Attributes for any Entity
Ellipse is used to represent attributes of any entity. It is connected to the entity.
9. ER Diagram Basics and Extensions
Components of ER Diagram
Weak Entity
A weak Entity is represented using double rectangular boxes. It is generally connected to another entity.
10. ER Diagram Basics and Extensions
Components of ER Diagram
Key Attribute for any Entity
To represent a Key attribute, the attribute name inside the Ellipse is underlined.
11. ER Diagram Basics and Extensions
Components of ER Diagram
Derived Attribute for any Entity
Derived attributes are those which are derived based on other attributes, for example, age can be derived
from date of birth.
To represent a derived attribute, another dotted ellipse is created inside the main ellipse.
12. ER Diagram Basics and Extensions
Components of ER Diagram
Multivalued Attribute for any Entity
Double Ellipse, one inside another, represents the attribute which can have multiple values.
13. ER Diagram Basics and Extensions
Components of ER Diagram
Composite Attribute for any Entity
A composite attribute is the attribute, which also has attributes.
14. ER Diagram Basics and Extensions
ER Diagram: Entity
An Entity can be any object, place, person or class. In ER Diagram, an entity is represented using
rectangles. Consider an example of an Organisation- Employee, Manager, Department, Product and many
more can be taken as entities in an Organisation.
15. ER Diagram Basics and Extensions
ER Diagram: Weak Entity
Weak entity is an entity that depends on another entity. Weak entity doesn't have anay key attribute of its
own. Double rectangle is used to represent a weak entity.
16. ER Diagram Basics and Extensions
ER Diagram: Attribute
An Attribute describes a property or characterstic of an entity. For example, Name, Age, Address etc can
be attributes of a Student. An attribute is represented using eclipse.
17. ER Diagram Basics and Extensions
ER Diagram: Key Attribute
Key attribute represents the main characterstic of an Entity. It is used to represent a Primary key. Ellipse
with the text underlined, represents Key Attribute.
18. ER Diagram Basics and Extensions
ER Diagram: Composite Attribute
An attribute can also have their own attributes. These attributes are known as Composite attributes.
19. ER Diagram Basics and Extensions
ER Diagram: Relationship
A Relationship describes relation between entities. Relationship is represented using diamonds or rhombus.
20. ER Diagram Basics and Extensions
There are three types of relationship that exist between Entities.
1. Binary Relationship
2. Recursive Relationship
3. Ternary Relationship
21. ER Diagram Basics and Extensions
ER Diagram: Binary Relationship
Binary Relationship means relation between two Entities. This is further divided into three types.
One to One Relationship
This type of relationship is rarely seen in real world.
22. ER Diagram Basics and Extensions
ER Diagram: Binary Relationship
One to Many Relationship
The below example showcases this relationship, which means that 1 student can opt for many courses, but
a course can only have 1 student. Sounds weird! This is how it is.
23. ER Diagram Basics and Extensions
ER Diagram: Binary Relationship
Many to One Relationship
It reflects business rule that many entities can be associated with just one entity. For example, Student
enrolls for only one Course but a Course can have many Students.
24. ER Diagram Basics and Extensions
ER Diagram: Binary Relationship
Many to Many Relationship
The below diagram represents that one student can enroll for more than one courses. And a course can have
more than 1 student enrolled in it.
25. ER Diagram Basics and Extensions
ER Diagram: Recursive Relationship
When an Entity is related with itself it is known as Recursive Relationship.
26. ER Diagram Basics and Extensions
ER Diagram: Ternary Relationship
Relationship of degree three is called Ternary relationship.
A Ternary relationship involves three entities. In such relationships we always consider two entites together
and then look upon the third.
27. ER Diagram Basics and Extensions
ER Diagram: Ternary Relationship
For example, in the diagram above, we have three related entities, Company, Product and Sector. To
understand the relationship better or to define rules around the model, we should relate two entities and
then derive the third one.
A Company produces many Products/ each product is produced by exactly one company.
A Company operates in only one Sector / each sector has many companies operating in it.
Considering the above two rules or relationships, we see that although the complete relationship involves
three entities, but we are looking at two entities at a time.