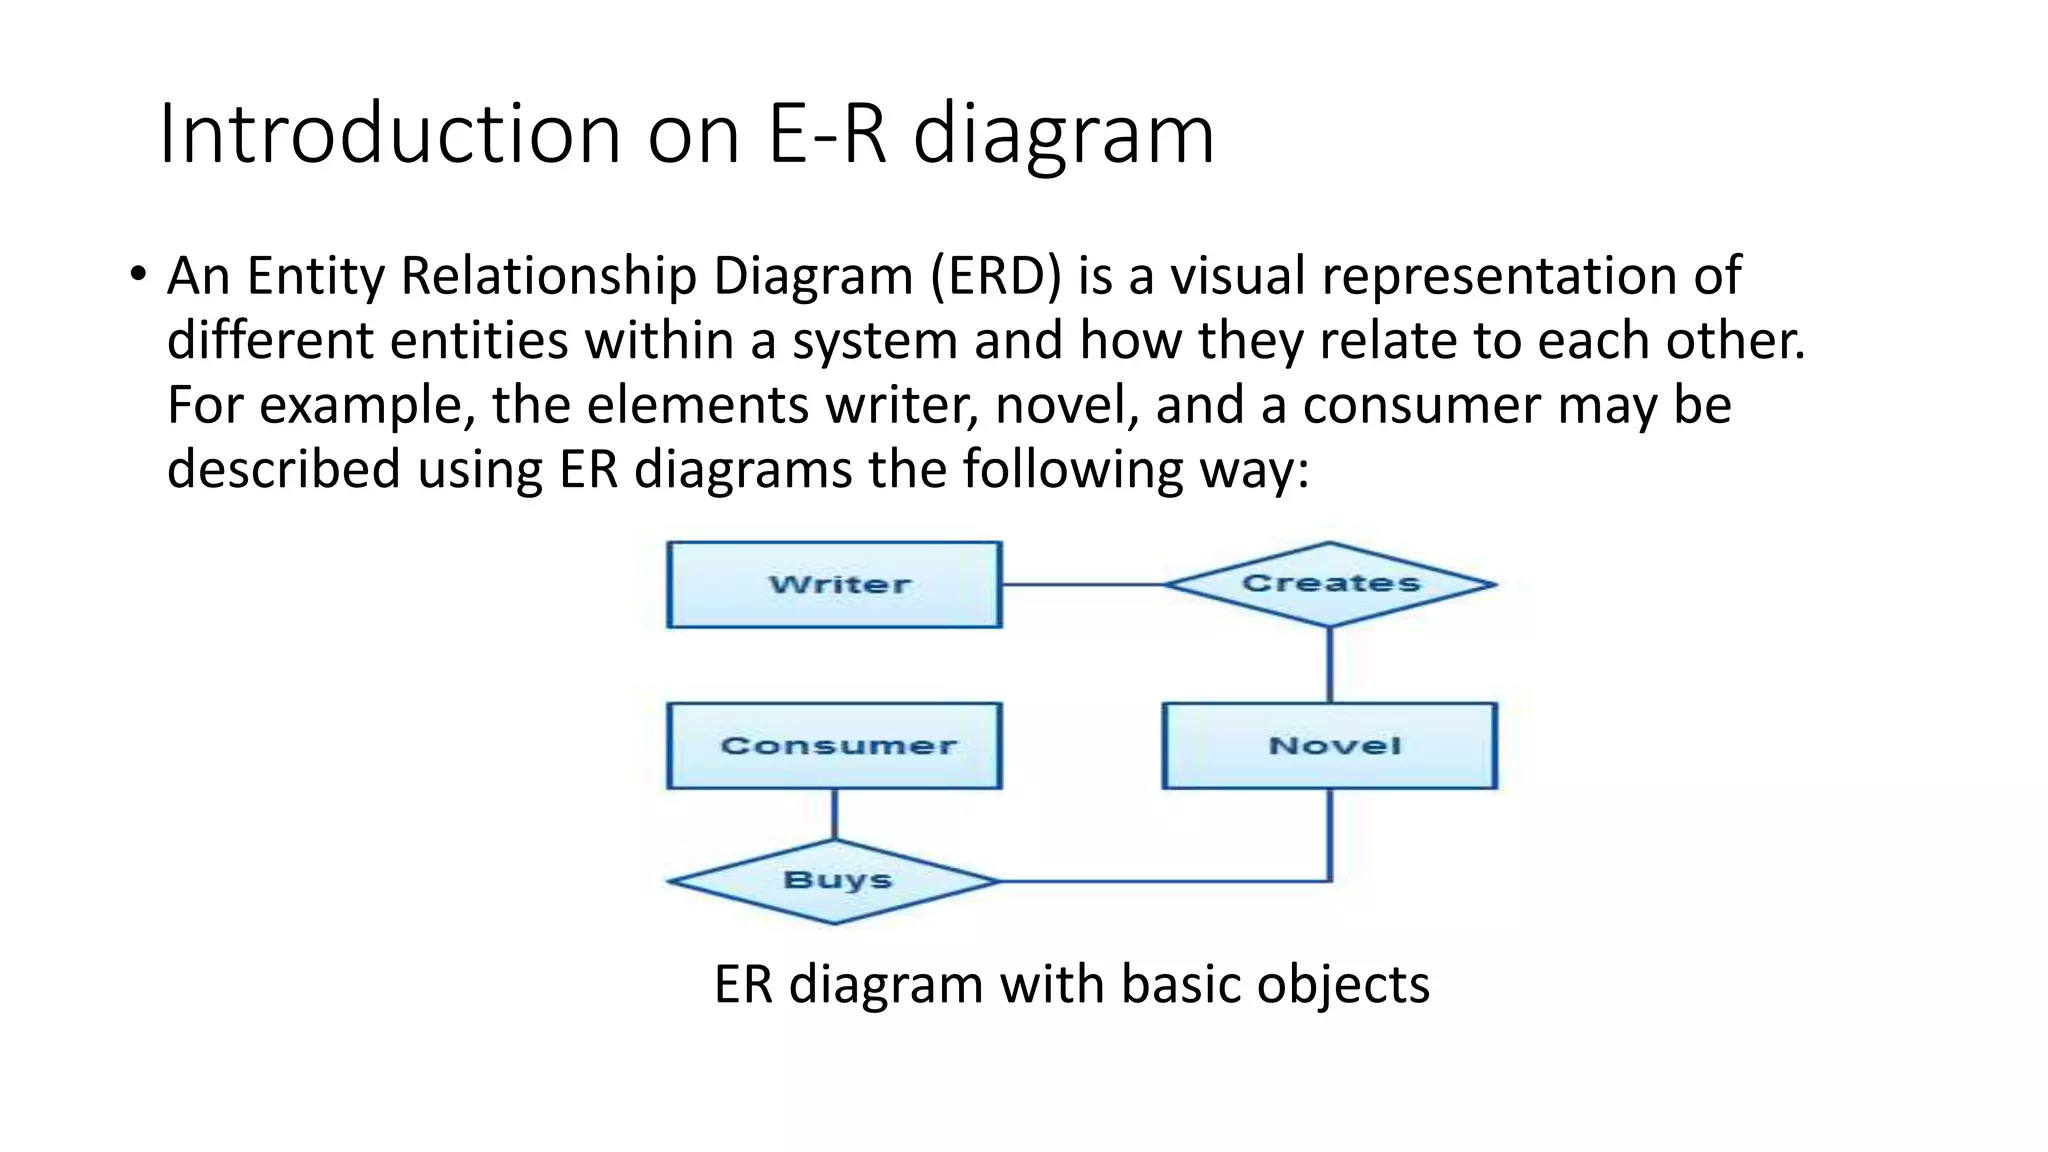
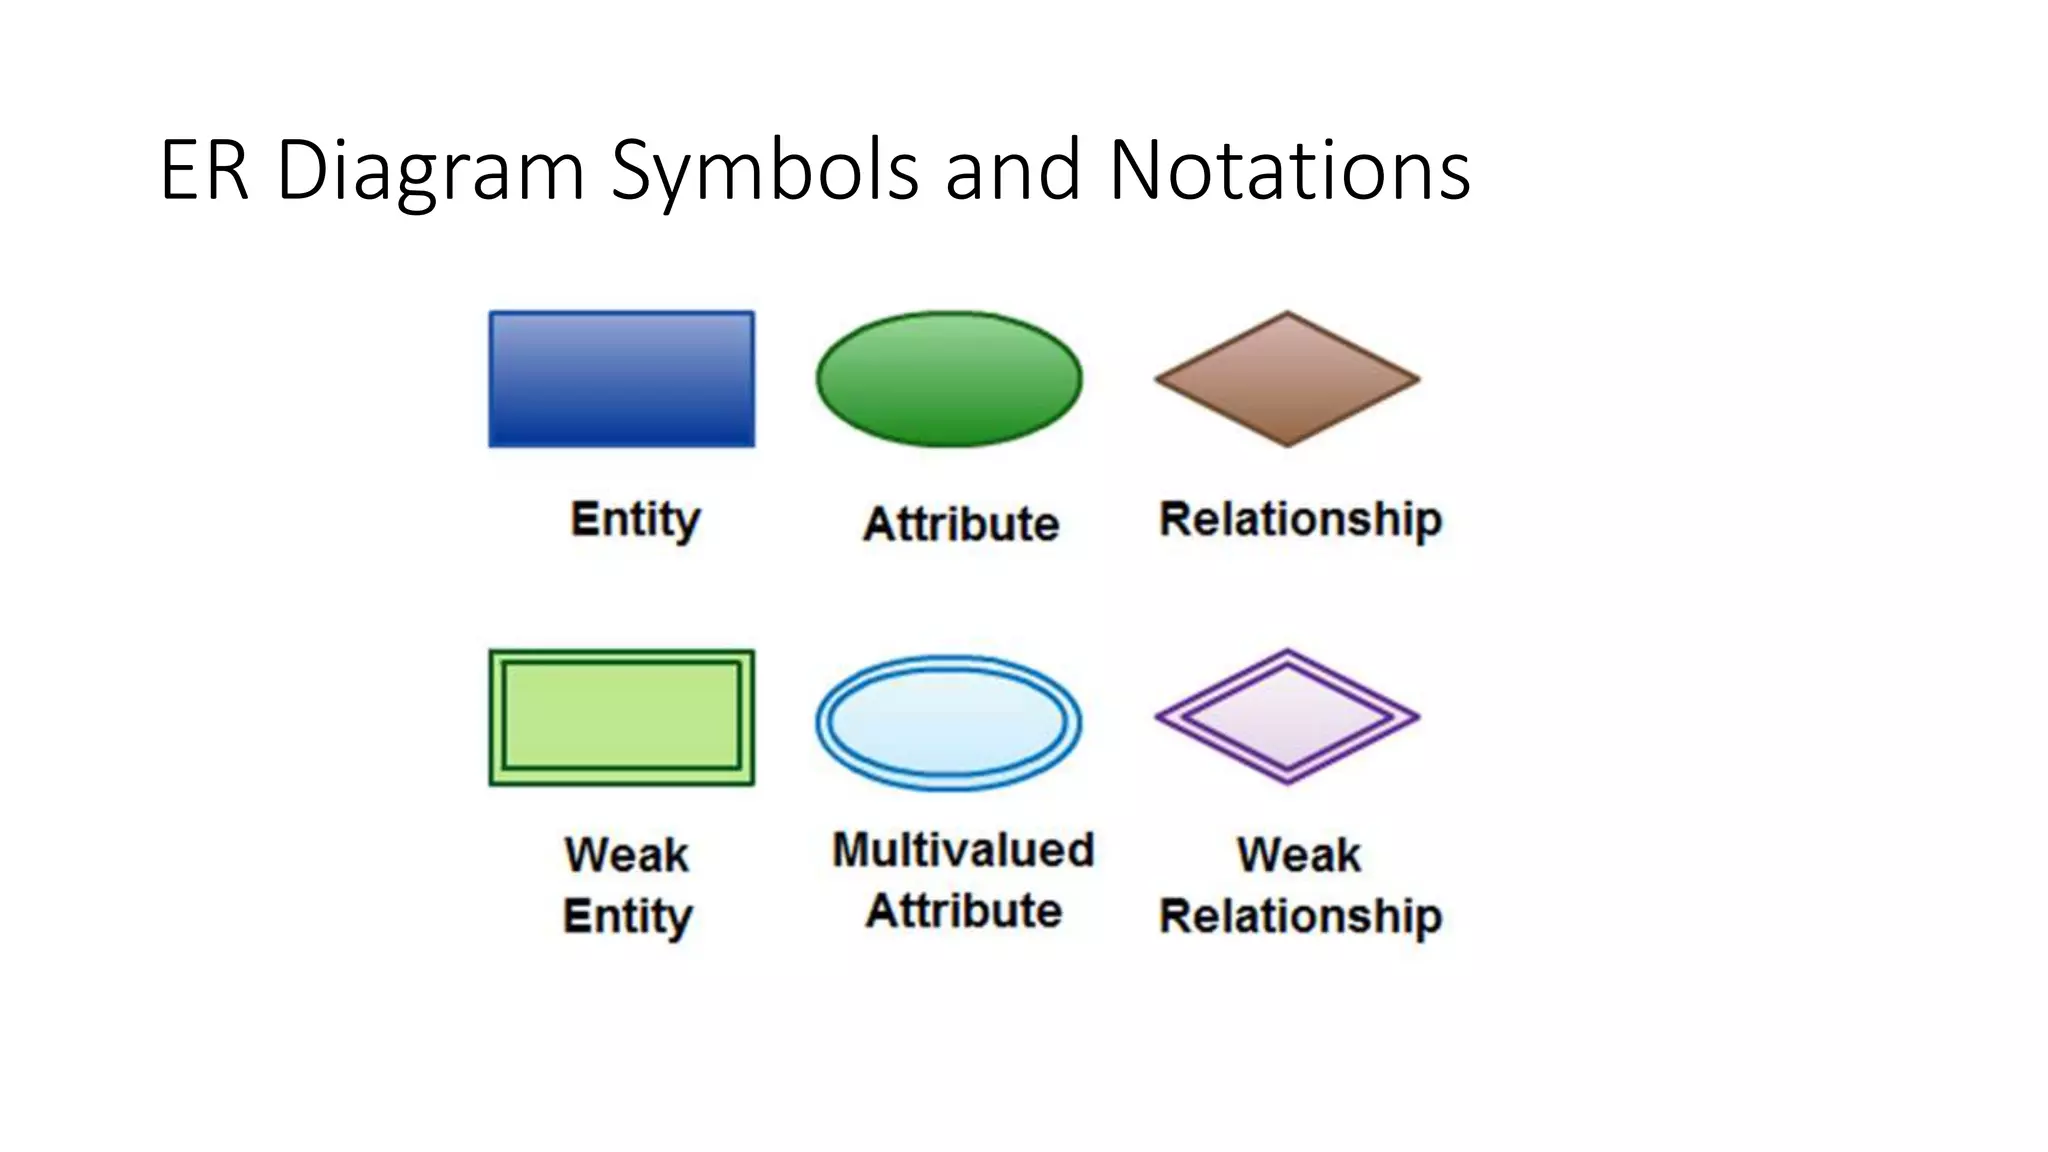
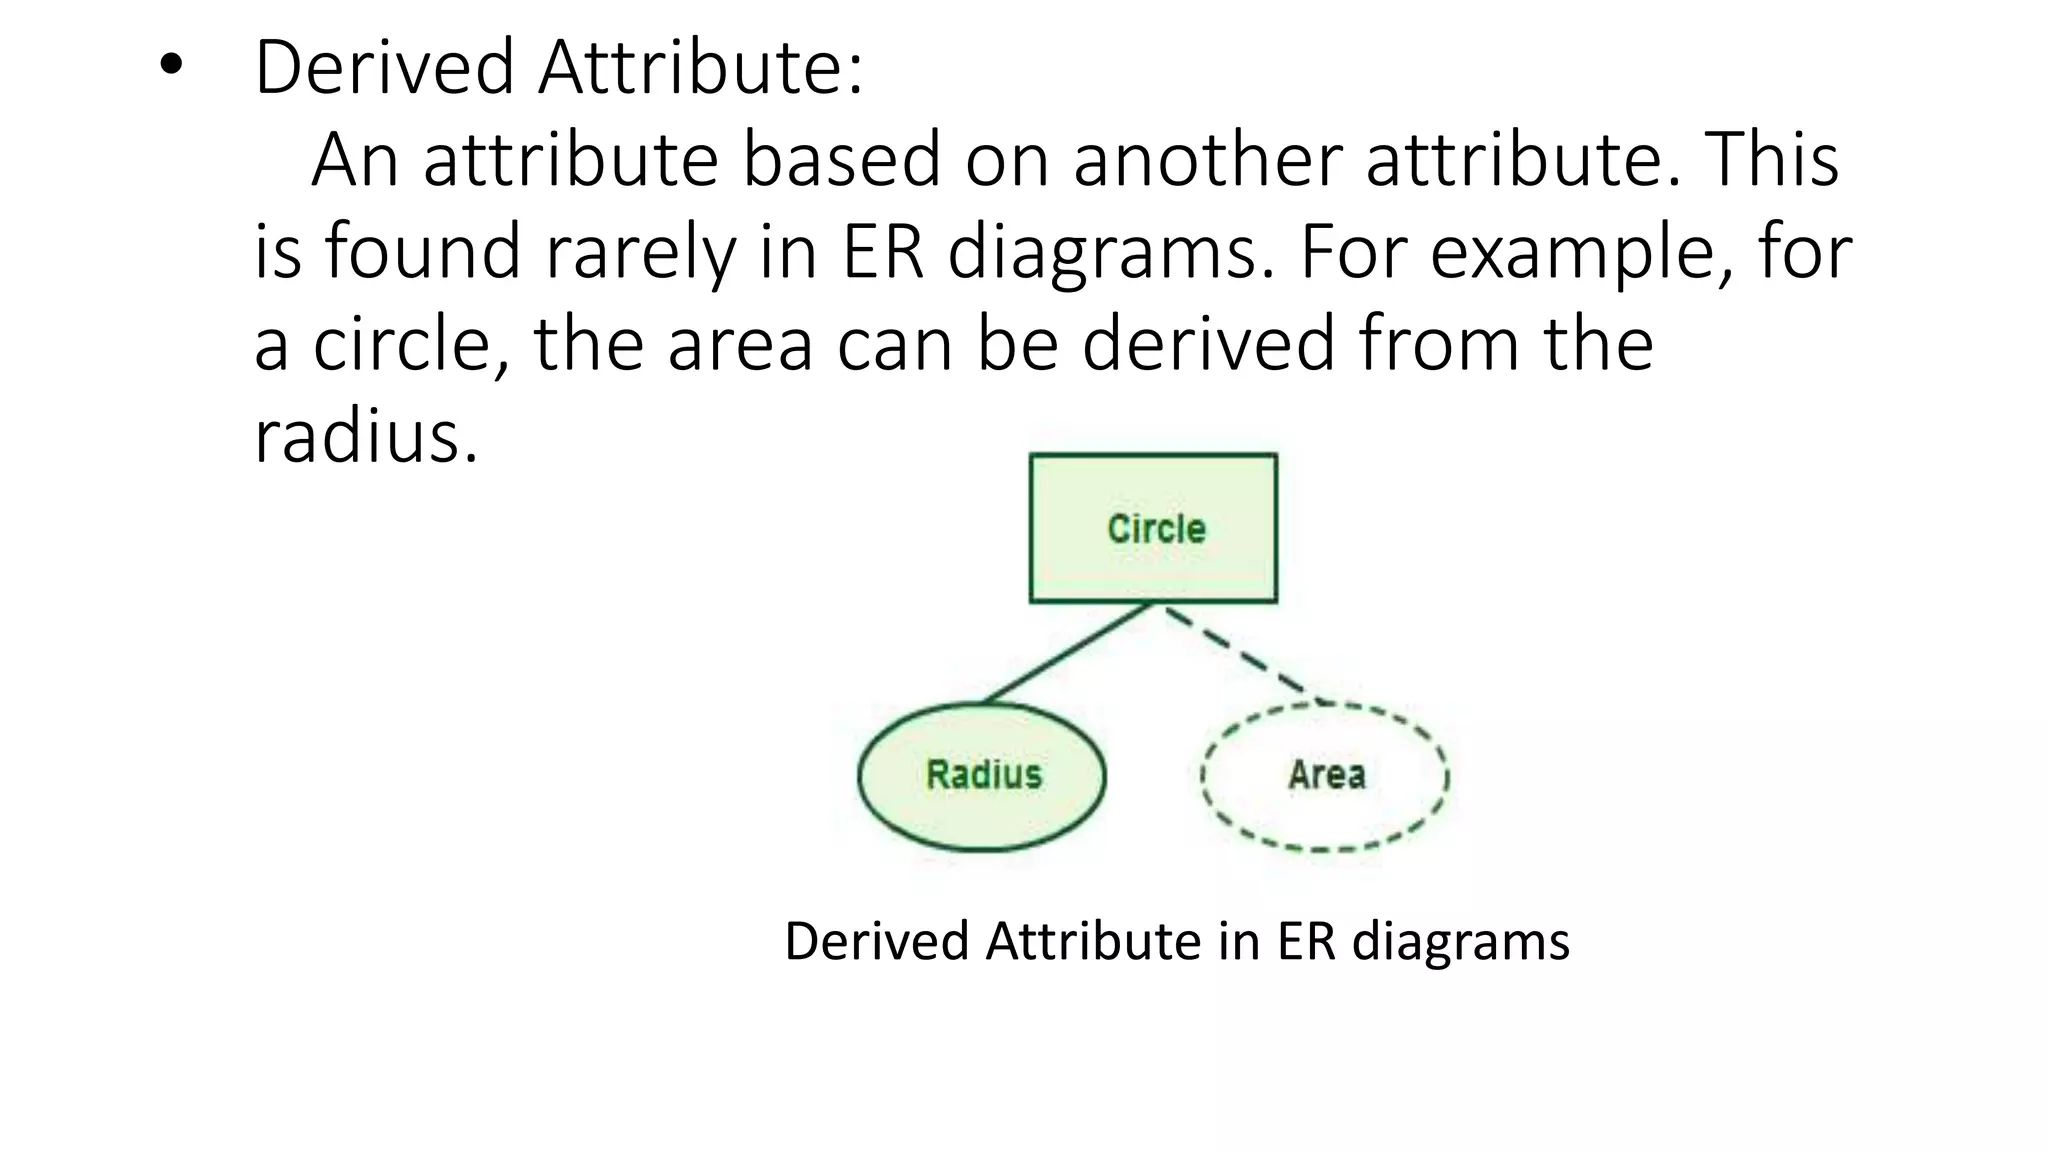
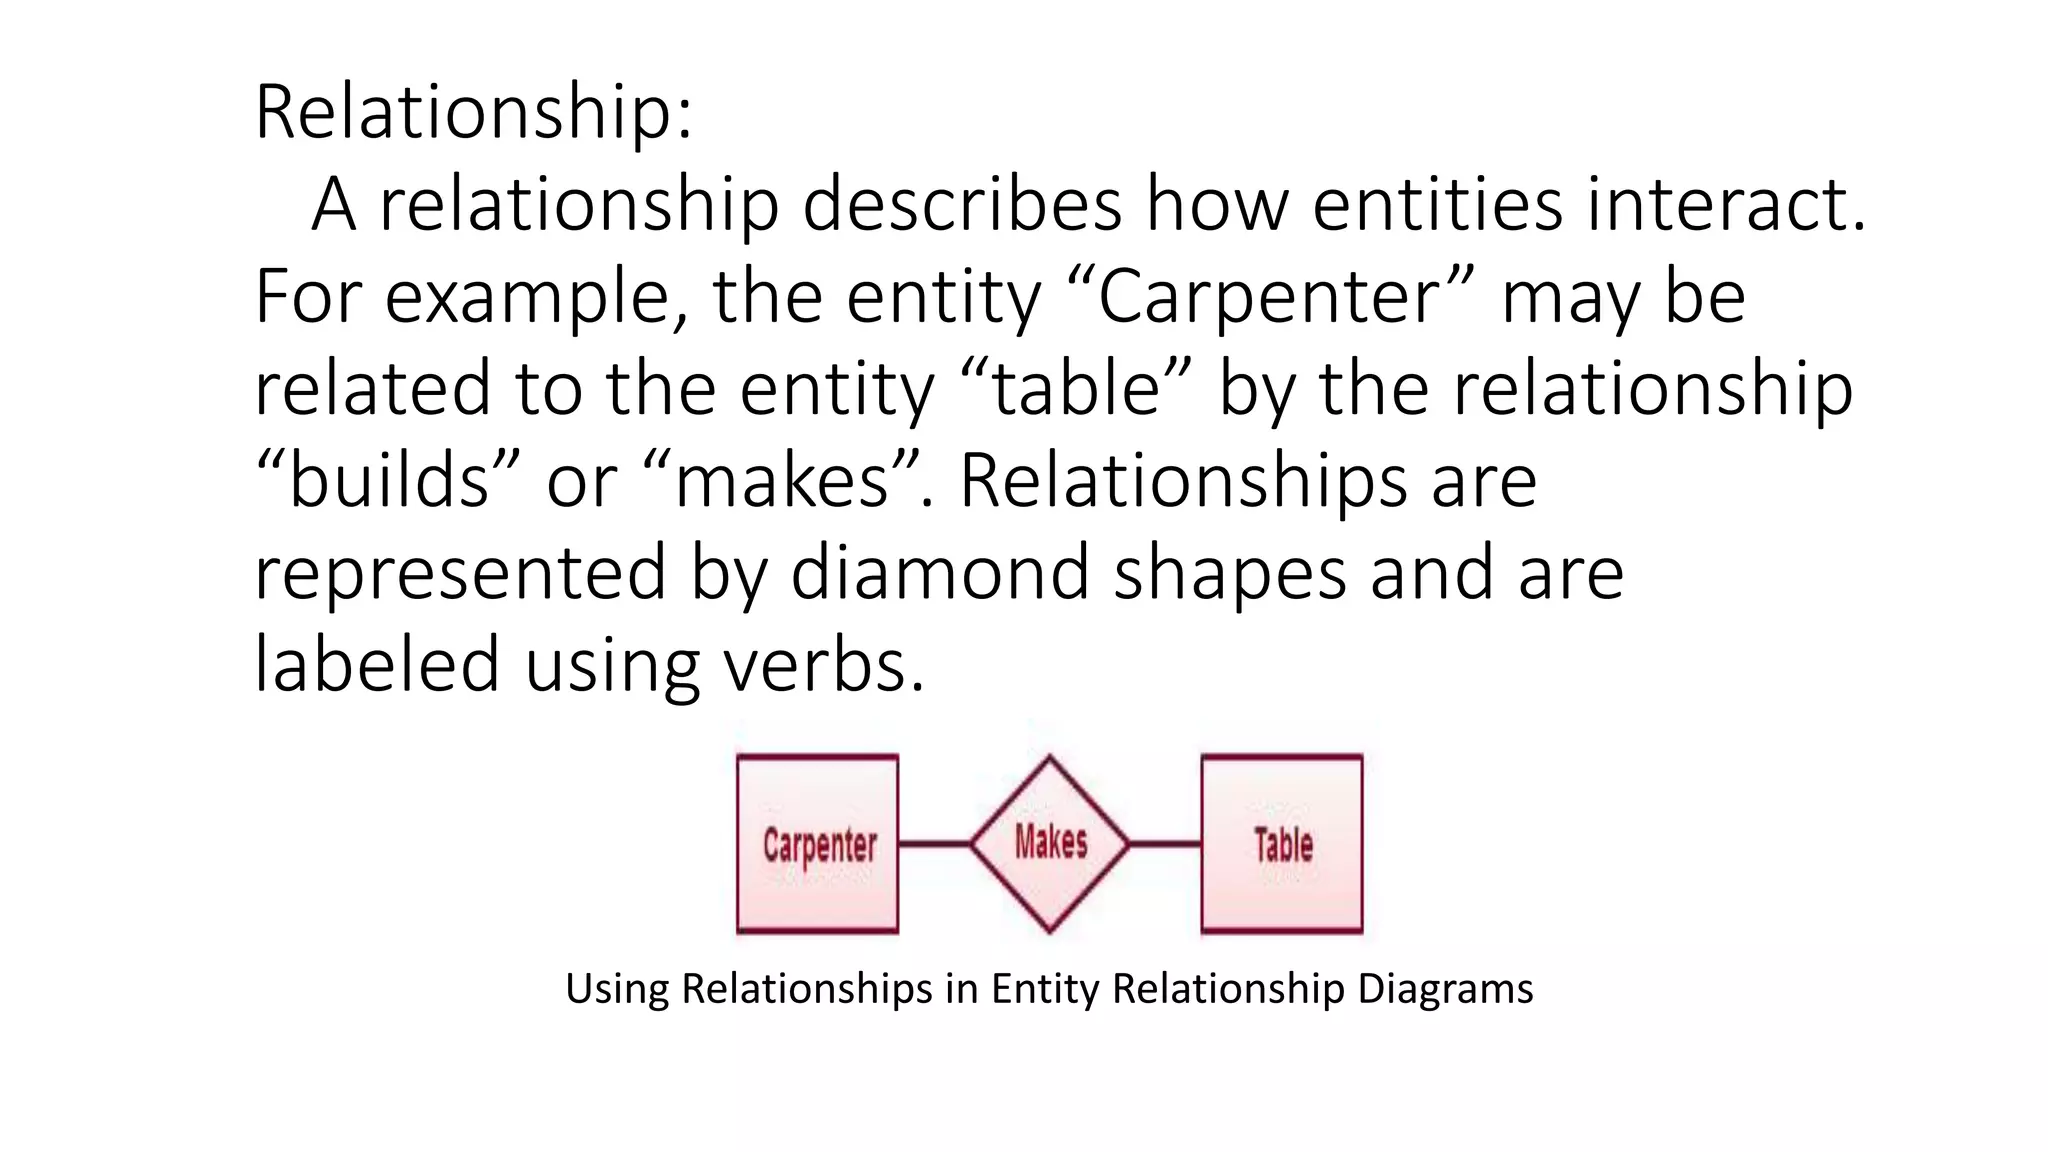
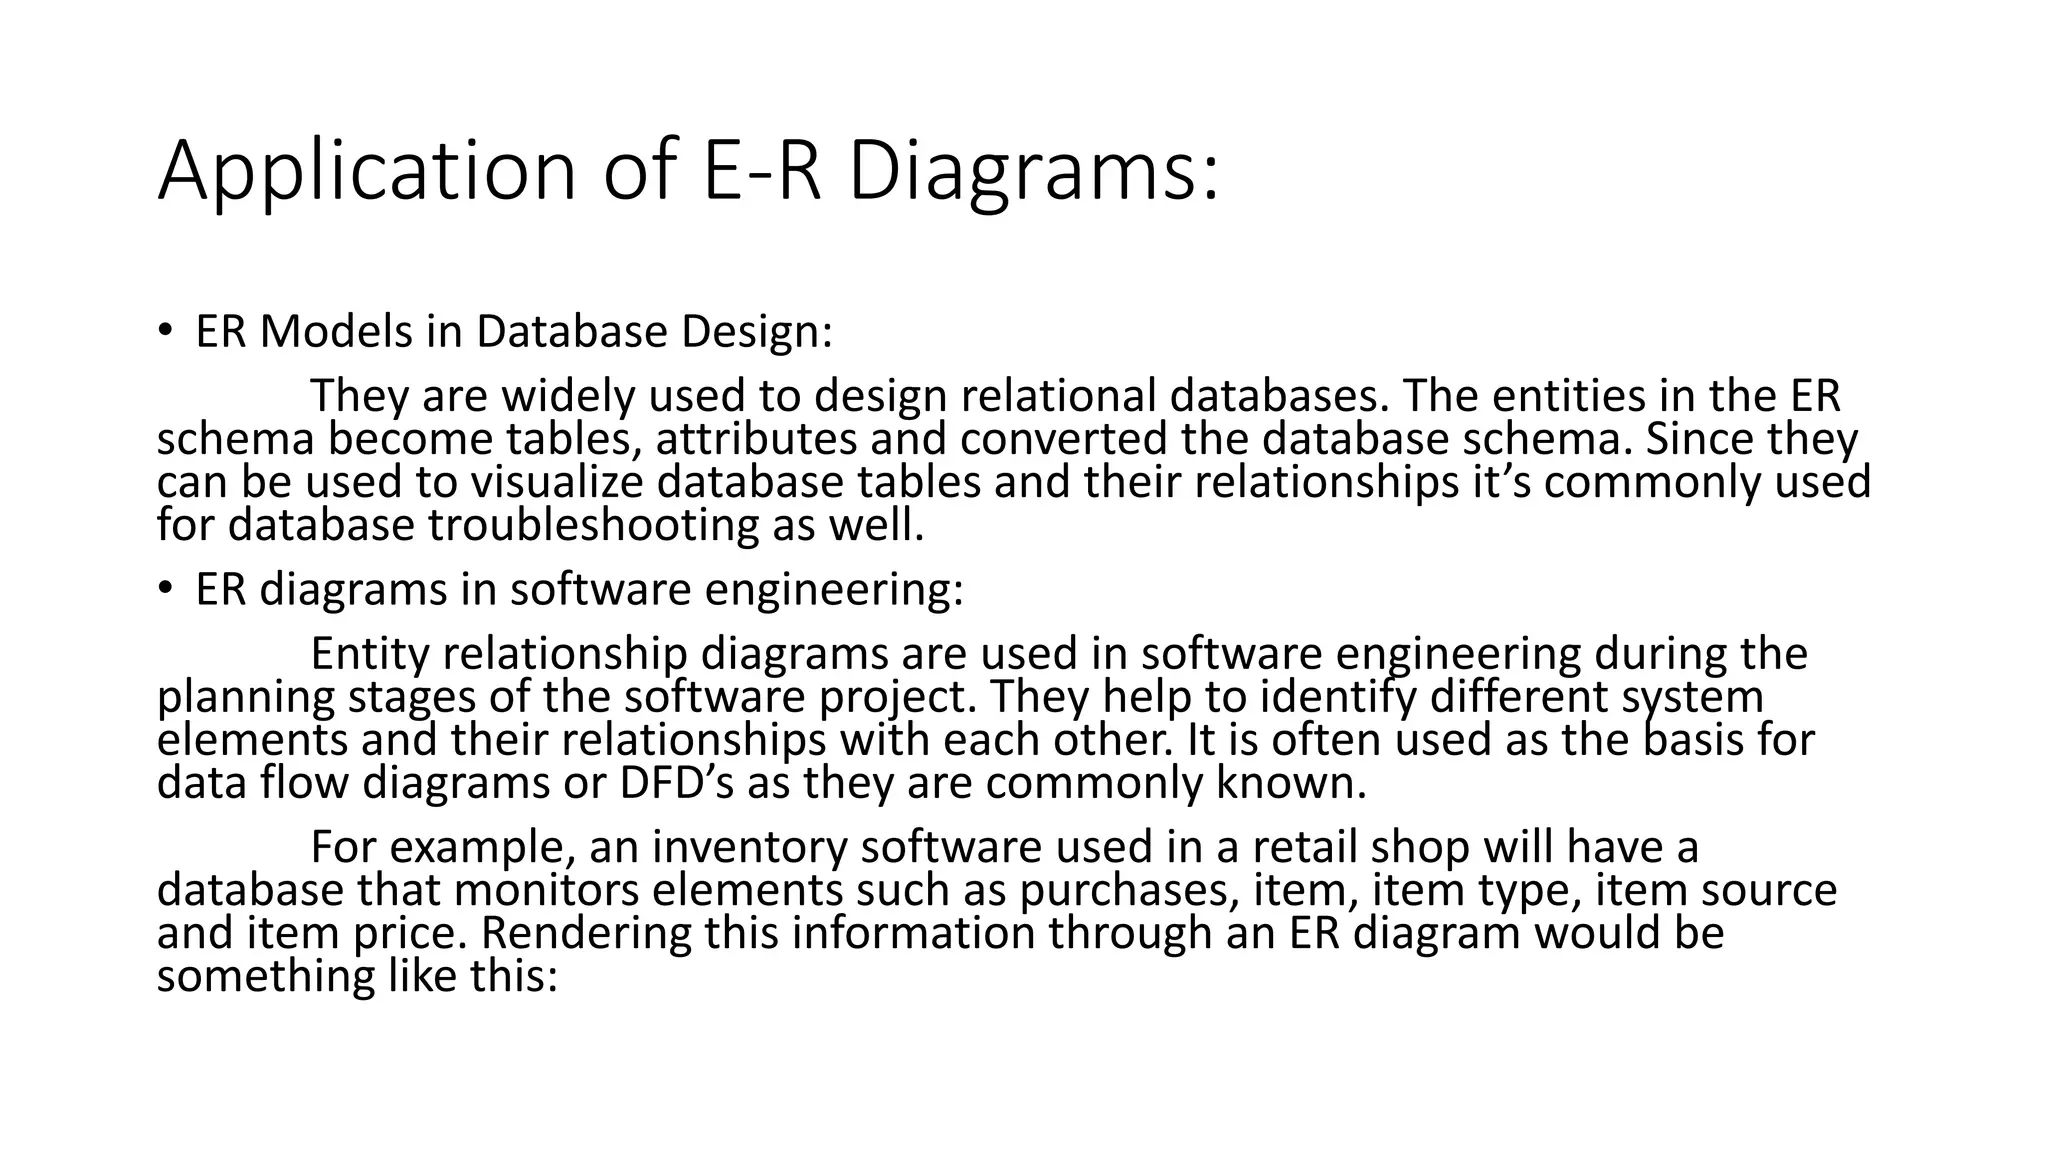
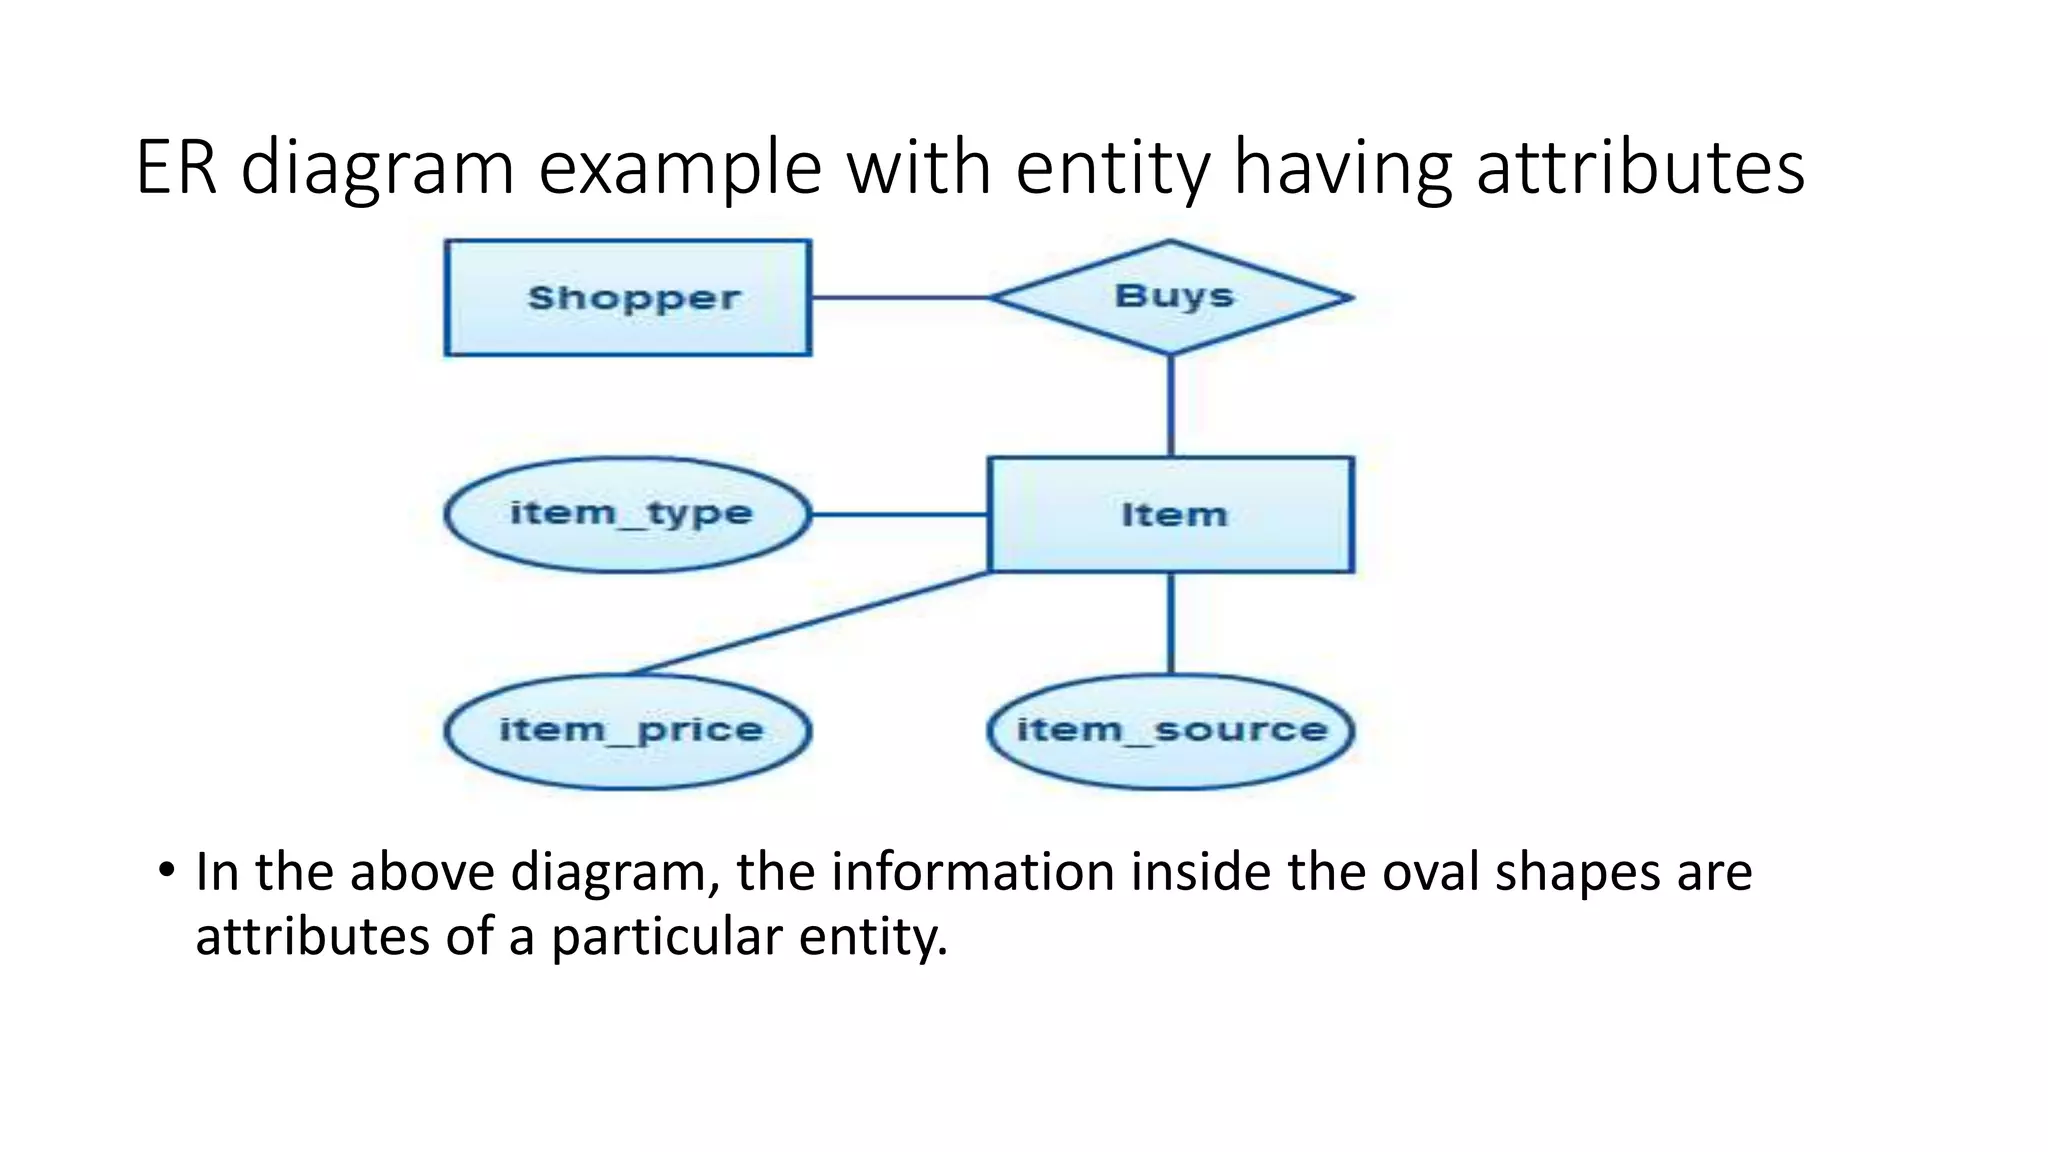
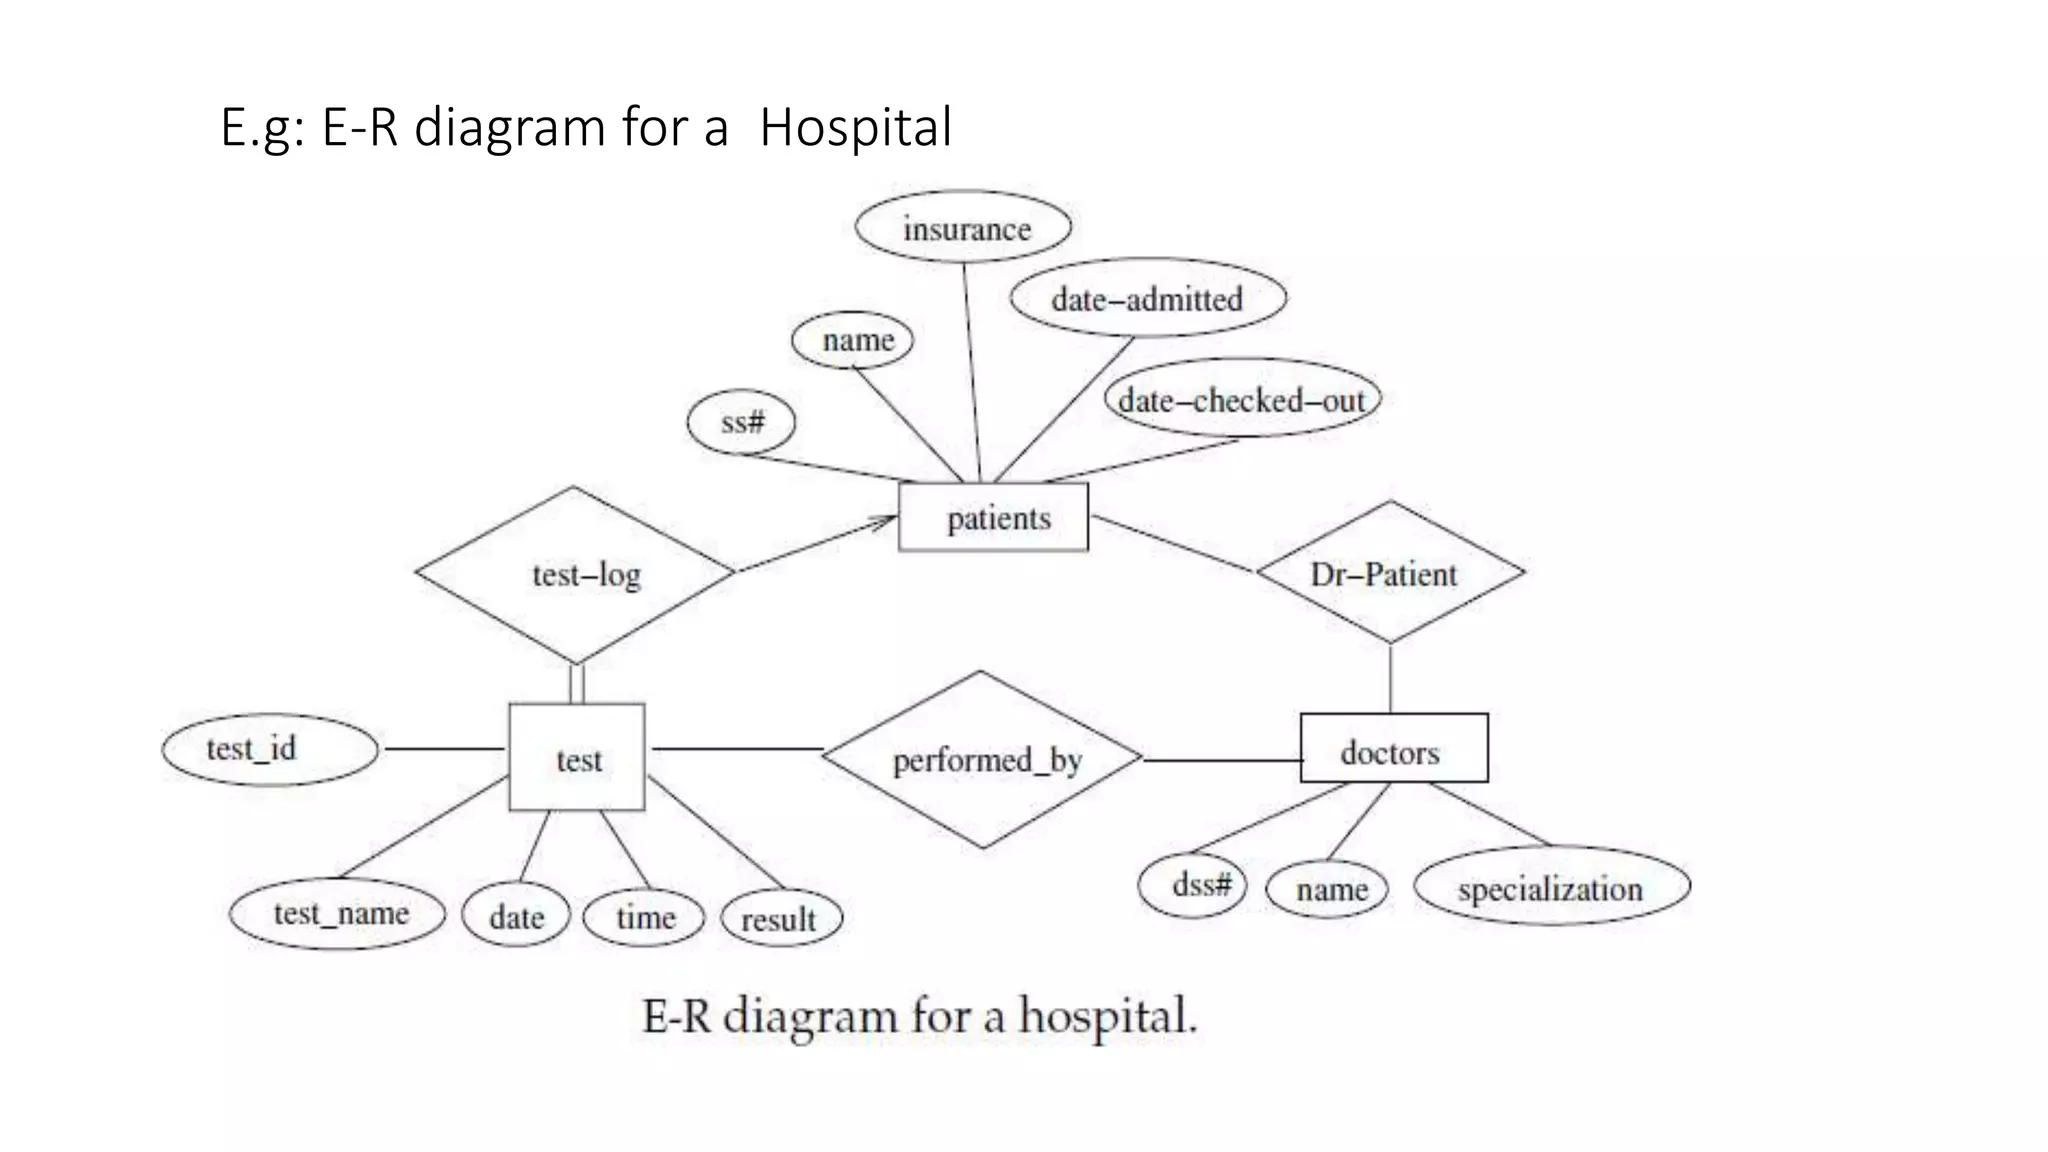
3. Introduction on E-R diagram
• An Entity Relationship Diagram (ERD) is a visual representation of
different entities within a system and how they relate to each other.
For example, the elements writer, novel, and a consumer may be
described using ER diagrams the following way:
ER diagram with basic objects
5. Elements in ER diagrams
There are three basic elements in an ER Diagram: entity, attribute, relationship.
There are more elements which are based on the main elements. They are weak
entity, multi valued attribute, derived attribute, weak relationship, and recursive
relationship. Cardinality and ordinality are two other notations used in ER diagrams
to further define relationships.
• Entity
An entity can be a person, place, event, or object that is relevant to a given
system. For example, a school system may include students, teachers, major
courses, subjects, fees, and other items. Entities are represented in ER diagrams by
a rectangle and named using singular nouns.
• Weak Entity
A weak entity is an entity that depends on the existence of another entity.
In more technical terms it can be defined as an entity that cannot be identified by
its own attributes. It uses a foreign key combined with its attributed to form the
primary key. An entity like order item is a good example for this. The order item will
be meaningless without an order so it depends on the existence of the order.
6. Weak Entity Example in ER diagrams
• Attribute
An attribute is a property, trait, or characteristic of an entity,
relationship, or another attribute. For example, the attribute Inventory
Item Name is an attribute of the entity Inventory Item. An entity can
have as many attributes as necessary. Meanwhile, attributes can also
have their own specific attributes. For example, the attribute “customer
address” can have the attributes number, street, city, and state. These
are called composite attributes. Note that some top level ER diagrams
do not show attributes for the sake of simplicity. In those that do,
however, attributes are represented by oval shapes.
7. Attributes in ER diagrams, Note that an attribute can have
its own attributes ( composite attribute )
• Multivalued Attribute:
If an attribute can have more than one value it is called a multi valued
attribute. It is important to note that this is different to an attribute
having its own attributes. For example, a teacher entity can have
multiple subject values. E.g:
8. • Derived Attribute:
An attribute based on another attribute. This
is found rarely in ER diagrams. For example, for
a circle, the area can be derived from the
radius.
Derived Attribute in ER diagrams
9. Relationship:
A relationship describes how entities interact.
For example, the entity “Carpenter” may be
related to the entity “table” by the relationship
“builds” or “makes”. Relationships are
represented by diamond shapes and are
labeled using verbs.
Using Relationships in Entity Relationship Diagrams
10. • Recursive Relationship:
If the same entity participates more than
once in a relationship it is known as a
recursive relationship. In the below
example an employee can be a supervisor
and be supervised, so there is a recursive
relationship.
Example of a recursive relationship in ER diagrams
11. Instructions for creating E-R Diagrams
Below points show how to create an ER diagram:
• Identify all the entities in the system. An entity should appear only
once in a particular diagram. Create rectangles for all entities and
name them properly.
• Identify relationships between entities. Connect them using a line and
add a diamond in the middle describing the relationship.
• Add attributes for entities. Give meaningful attribute names so they
can be understood easily.
12. Benefits of ER diagrams
ER diagrams constitute a very useful framework for creating and
manipulating databases. First, ER diagrams are easy to understand and
do not require a person to undergo extensive training to be able to
work with it efficiently and accurately. This means that designers can
use ER diagrams to easily communicate with developers, customers,
and end users, regardless of their IT proficiency. Second, ER diagrams
are readily translatable into relational tables which can be used to
quickly build databases. In addition, ER diagrams can directly be used
by database developers as the blueprint for implementing data in
specific software applications. Lastly, ER diagrams may be applied in
other contexts such as describing the different relationships and
operations within an organization.
13. Application of E-R Diagrams:
• ER Models in Database Design:
They are widely used to design relational databases. The entities in the ER
schema become tables, attributes and converted the database schema. Since they
can be used to visualize database tables and their relationships it’s commonly used
for database troubleshooting as well.
• ER diagrams in software engineering:
Entity relationship diagrams are used in software engineering during the
planning stages of the software project. They help to identify different system
elements and their relationships with each other. It is often used as the basis for
data flow diagrams or DFD’s as they are commonly known.
For example, an inventory software used in a retail shop will have a
database that monitors elements such as purchases, item, item type, item source
and item price. Rendering this information through an ER diagram would be
something like this:
14. ER diagram example with entity having attributes
• In the above diagram, the information inside the oval shapes are
attributes of a particular entity.