Downloaded 22 times


This document provides examples of classifying costs as direct or indirect, variable or fixed for different cost objects across manufacturing, service, and merchandising sectors. It also discusses computing unit costs using total versus variable costs, relevant ranges for fixed and variable costs, and identifying cost drivers in a value chain. Key information includes examples of how costs are classified based on their behavior and relationship to the cost object, as well as how relevant ranges and fixed versus variable costs impact the calculation of total unit costs.


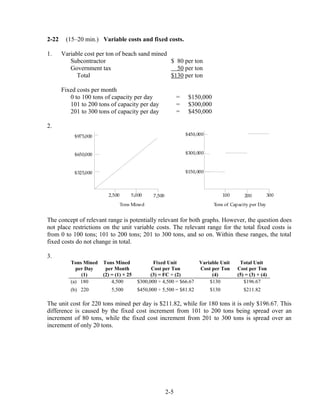
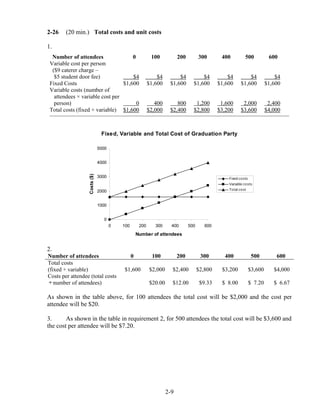
![[TUTORING SESSION KÌ I - 2021] Final Handbook MA.pdf](https://cdn.slidesharecdn.com/ss_thumbnails/tutoringsessionkii-2021finalhandbookma-221130064059-cd42703e-thumbnail.jpg?width=640&height=640&fit=bounds)


