The document analyzes 13 opportunities for wireless telecommunications to reduce carbon emissions and energy costs in the EU by 2020. It finds that these opportunities could reduce emissions by 113 million tonnes of CO2e and save €43 billion in energy costs annually through 1 billion new mobile connections, mainly for machine-to-machine applications. The largest opportunities are in smart grid and smart logistics. Incentives like carbon pricing and investment are needed to realize these opportunities.
![15 Carbon connections: quantifying mobile’s role in tackling climate change
Context Recommendations AppendicesFindings
Potential barriers:
• Need to change company culture of working together in a physical office
• Employee resistance to working remotely
• Working from home may not be viable in certain industry sectors, such as retail
or manufacturing.
Mobile delivery notifications for e-commerce
30 Eurostat average for EU-25 countries, 2008
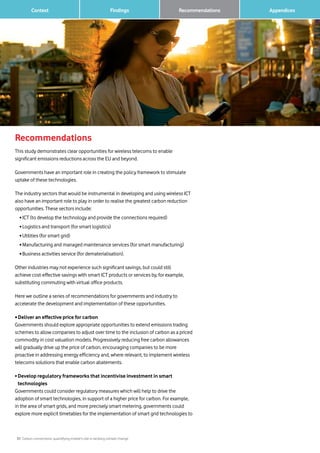
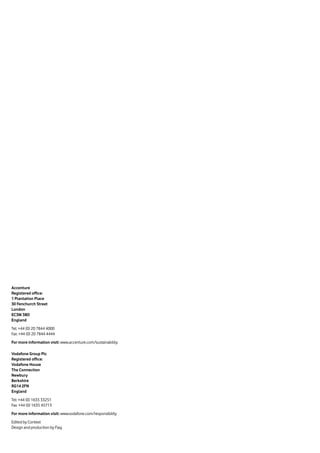
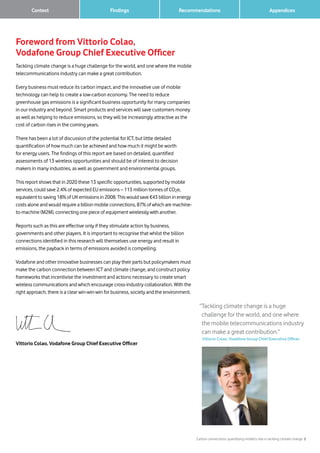
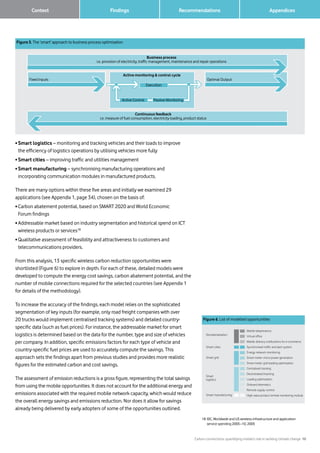
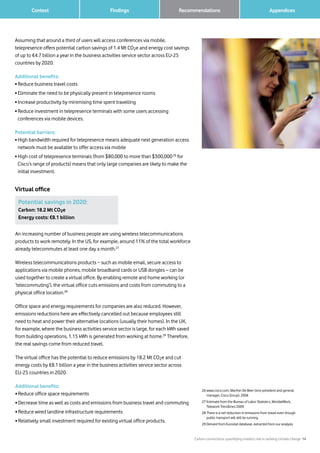
Key findings for EU-25 countries in 2020
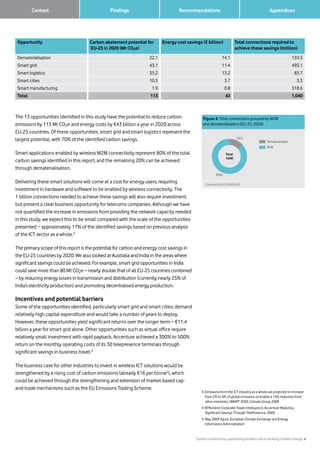
• Total carbon abatement potential:
22.1 Mt CO2e (Figure 12)
• Total energy cost savings potential:
€14.1 billion (Figure 13)
• Total connections required to achieve these savings:
139.3 million (Figure 14)
Figure 14. Dematerialisation – required connections
(EU-25; 2020)
Connections (million)
88.8
50.4
0.1
Mobile telepresence
Virtual office
Mobile delivery notification
for e-commerceTotal
139.3
Figure 12. Dematerialisation carbon abatement potential
(EU-25; 2020)
Carbon savings (Mt CO2e)
18.2
2.5 1.4
Mobile telepresence
Virtual office
Mobile delivery notification
for e-commerce
Total
22.1
Figure 13. Dematerialisation energy cost reduction
potential (EU-25; 2020)
Energy cost savings (e billion)
8.1
1.3
4.7
Mobile telepresence
Virtual office
Mobile delivery notification
for e-commerce
Total
14.1
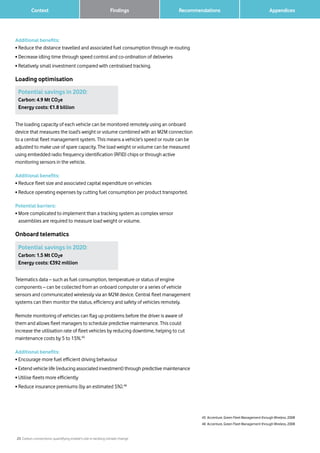
Potential savings in 2020:
Carbon: 2.5 Mt CO2e
Energy costs: €1.3 billion
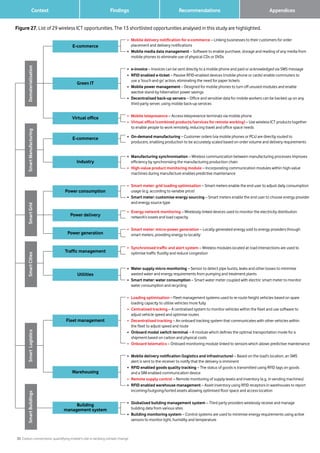
Online ordering and home delivery from retail and wholesale outlets can
substantially reduce emissions from shopping trips by individual consumers.
Although the distance travelled by delivery trucks will increase, each trip can make
multiple deliveries, resulting in a net reduction in distance travelled.
E-commerce is already well established and growing at 8% 30
a year in EU-25
countries. Offering customers reliable and accurate notifications about the status
and timing of deliveries via their mobile phone could make regular online shopping
a more attractive option for consumers for a wider range of products, such as
clothes, sports goods, food, groceries and household goods. These notifications
make delivery times more predictable, enabling customers to plan their schedules
accordingly and reduce time wasted waiting for deliveries. This in turn reduces
emissions from abortive delivery attempts and individual shopping trips.
Extending the range of products regularly ordered online through reliable mobile
delivery notifications offers potential emissions reductions of 2.5 Mt CO2e a year
and energy cost savings of €1.3 billion across EU-25 countries by 2020. To achieve
these savings, platforms must be developed that provide robust, reliable orders and
notifications for e-commerce.
Additional benefits:
• Reduce retail building floor space and associated operating expenses
• Reduce customer time wasted waiting for deliveries with reliable mobile delivery
notification
• Manage retail supply chains more efficiently with advanced notice of
consumer demand.
Country analysis
Cost savings are dependent on the price of fuel (for road, rail or air travel) and
electricity (for office electricity use), as well as other factors such as the number of
employees in the business activities service sector and the share of households using
e-commerce. Given these factors, France, Germany, Spain and the UK are likely to
achieve the greatest carbon reductions from dematerialisation in the EU.
Countries with a large share of their population in the business activities service
sector, such as the UK with 7%, (see Figure 29, page 36) or with a large total workforce
in that sector, such as Germany with 4 million, represent the largest potential for the
number of employees likely to telecommute (Figure 15).
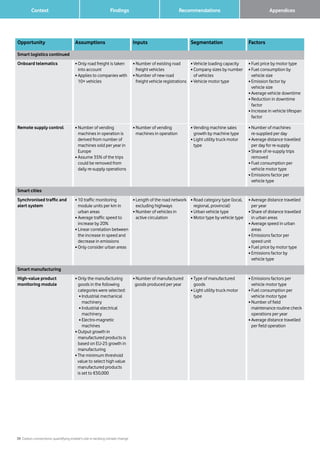
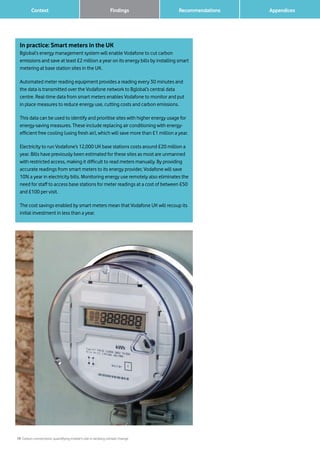
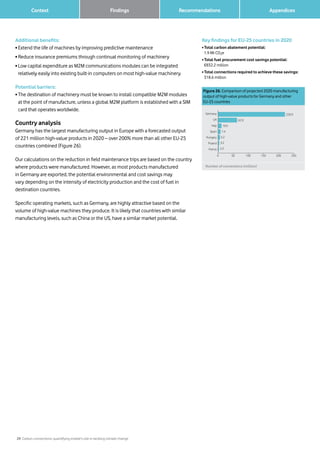
Figure 15. Comparison of the 2020 savings potential of
the three combined dematerialisation opportunities for a
selection of EU-25 countries
Potential savings (@million) and required connections (million)
France 2.1
Spain 1.6
Italy 1.2
Germany 3.0
United Kingdom
2.0
Numberofconnections(million)
End consumer cost savings (€ million)
Potential carbon savings [Mt CO2e]
0.0
15.0
30.0
500 1,000 1,500 2,000 2,500
o
2.02](https://image.slidesharecdn.com/eecce52b-743d-4120-a04d-57150921933a-150316111110-conversion-gate01/85/Accenture_Carbon_Connections_Quantifying_Mobiles_Role_in_Tackling_Climate_Change-16-320.jpg)
![25 Carbon connections: quantifying mobile’s role in tackling climate change
Context Recommendations AppendicesFindings
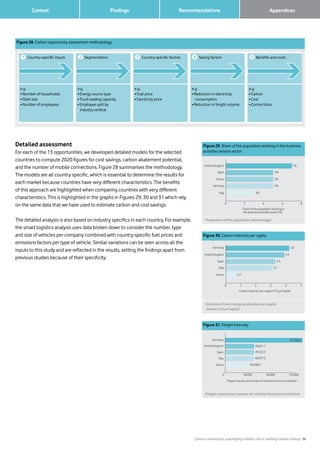
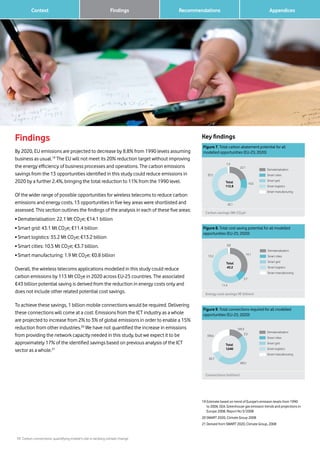
Country analysis
Europe
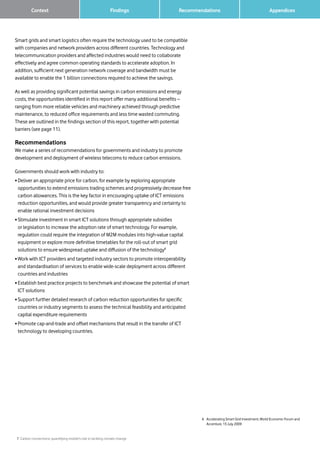
EU countries with large numbers of freight vehicles are strong potential markets for
M2M-enabled fleet management systems (Figure 24). Potential energy cost savings
and corresponding carbon savings depend on the nature of the freight sector in each
country. For example, France and Italy have the largest number of freight vehicles, but
cost and carbon savings are also dependent on the volume of freight (tonne.km) and
the number of truck kilometres travelled (vehicle.km).
Germany has the largest volume of freight transported, with 343,000 million
tonne.km47
of road freight per year, but is not associated with the greatest savings
because its freight sector is also more efficient, with a relatively high average
utilisation rate of 133,380 tonne.km per vehicle per year. Italy shows the strongest
potential for smart logistics solutions, with potential savings of €2 billion in fuel costs
and 5.1 Mt CO2e in carbon emissions a year by 2020.
Australia
Australia was included in our analysis for smart logistics because of its strong
reliance on road freight and the high intensity of its freight sector, mainly
because of the large distances that must be covered. Australia’s freight intensity is
476,749 tonne.km per vehicle per year, 3.6 times that of Germany48
. Smart logistics
could enable total potential carbon savings of 2.4 Mt CO2e and fuel cost savings of
€839.2 million in Australia.
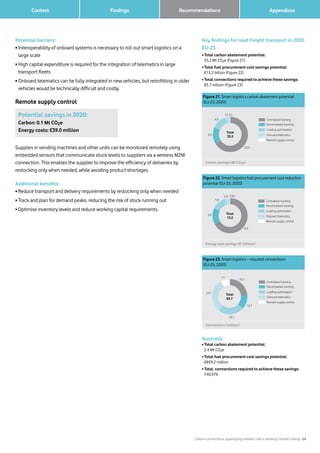
In practice: Smart logistics in the UK
Isotrak’s fleet management systems are helping UK businesses cut fuel costs
and CO2 emissions, reduce fleet size and save time by enabling smart logistics.
The company’s Active Transport Management System combines satellite
tracking and onboard telematics data sent over the Vodafone mobile network
using standard SIM cards. This enables businesses to monitor their fleets
remotely and plan more efficient logistics based on where vehicles travel, what
they carry and how they are driven. By changing driving styles, for example, fuel
efficiency can be improved by 5–15%.
In the UK, over 80% of all groceries, half of all road fuel and all residential mail
are transported on trucks equipped with Isotrak systems. Isotrak expects to have
connected 30,000 vehicles by the end of 2009. Among its customers are leading
logistics companies and the UK’s biggest supermarkets, including Asda, Tesco
and Sainsbury’s.
The Asda fleet has already saved 18 million road miles — the equivalent to
28,000 tonnes of carbon dioxide – and cut fuel costs by 23% over three years
using Isotrak’s system. Asda drivers have changed their behaviour to improve
fuel efficiency by 6.6%, and the system is also enabling the supermarket to
‘backhaul’ more waste and recyclable materials between stores and distribution
centres, minimising the number of trucks running without full loads.
47 Tonne.km is the standard unit for freight volume resulting from
the multiplication of a load in tonnes by the distance travelled in
kilometres. 2009 projection based on 2007 Eurostat data
48 Australian Bureau of Statistics, 2008 Year Book Australia
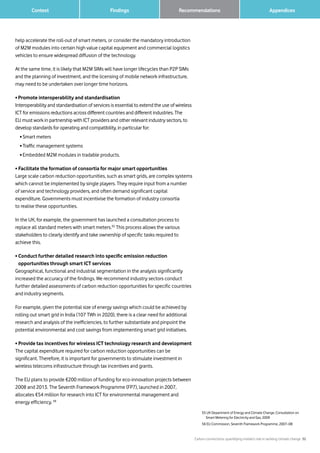
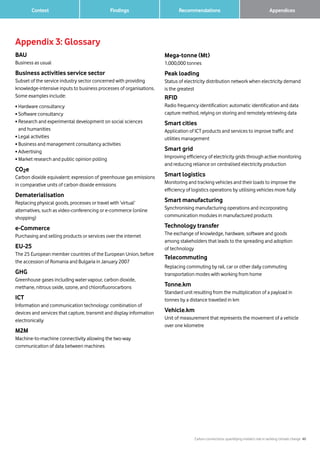
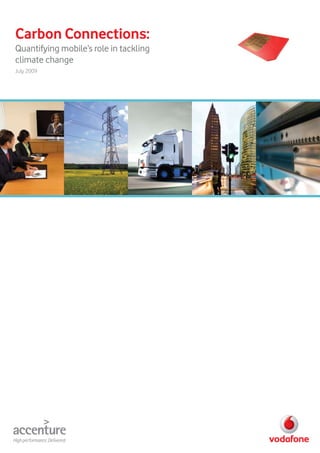
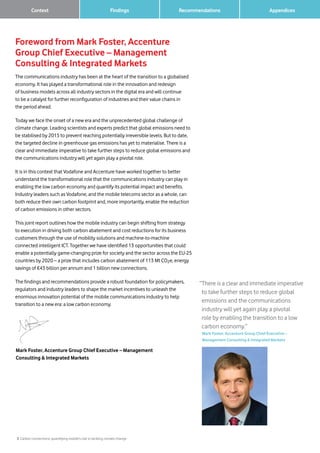
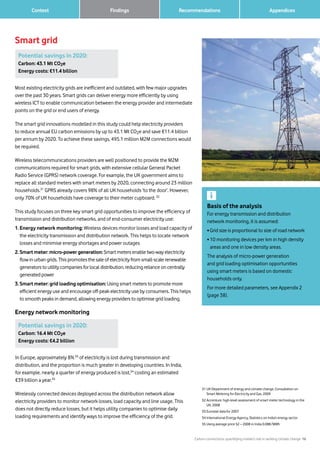
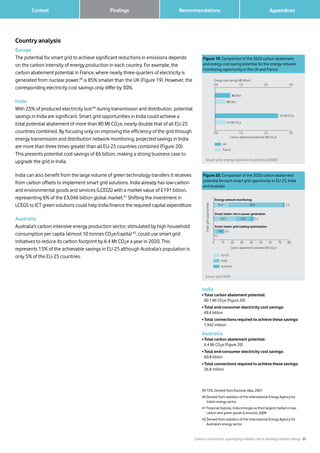
Figure 24. Potential savings and required connections for
smart logistics opportunities for a selection of countries
in 2020
Potential savings (@million), required connections (million)
and potential carbon savings (Mt CO2e)
Numberofconnections(million)
End consumer cost savings (€ million)
Potential carbon savings [Mt CO2e]
0.0
15.0
30.0
500 1,000 1,500 2,000 2,500
Australia 2.4
500 1000 1500 2000 2500
0
5
10
15
20
Australia 2.4
France 2.4
United
Kingdom
1.8
Spain 3.6
Italy 5.1
Germany 4.0](https://image.slidesharecdn.com/eecce52b-743d-4120-a04d-57150921933a-150316111110-conversion-gate01/85/Accenture_Carbon_Connections_Quantifying_Mobiles_Role_in_Tackling_Climate_Change-26-320.jpg)
![27 Carbon connections: quantifying mobile’s role in tackling climate change
Context Recommendations AppendicesFindings
Local authorities should investigate the results from existing pilot programmes and
use the lessons learned in the course of deploying trials of their own.
Additional benefits:
• Decrease pollution levels in urban areas and improve air quality
• Increase local revenues by coupling intelligent traffic monitoring systems with
congestion charging schemes to prevent ‘rebound’ effects (see barriers below).
Potential barriers:
• High capital expenditure to install and fully integrate autonomous traffic
control systems
• Improvements in traffic flow could create a ‘rebound’ effect by increasing road use,
negating the benefits.
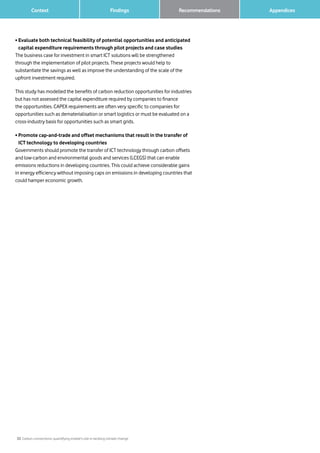
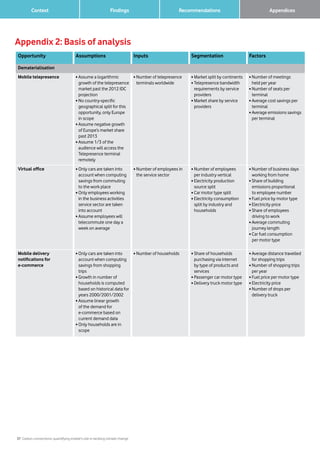
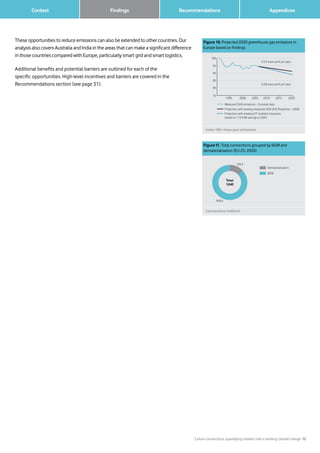
Country analysis
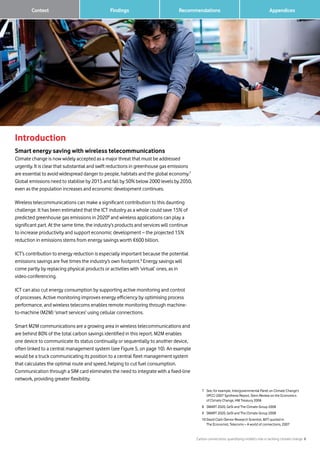
Cost and environmental savings are proportional to the volume of vehicles in urban
areas of each country. Countries with the largest volumes of vehicles – such as Italy,
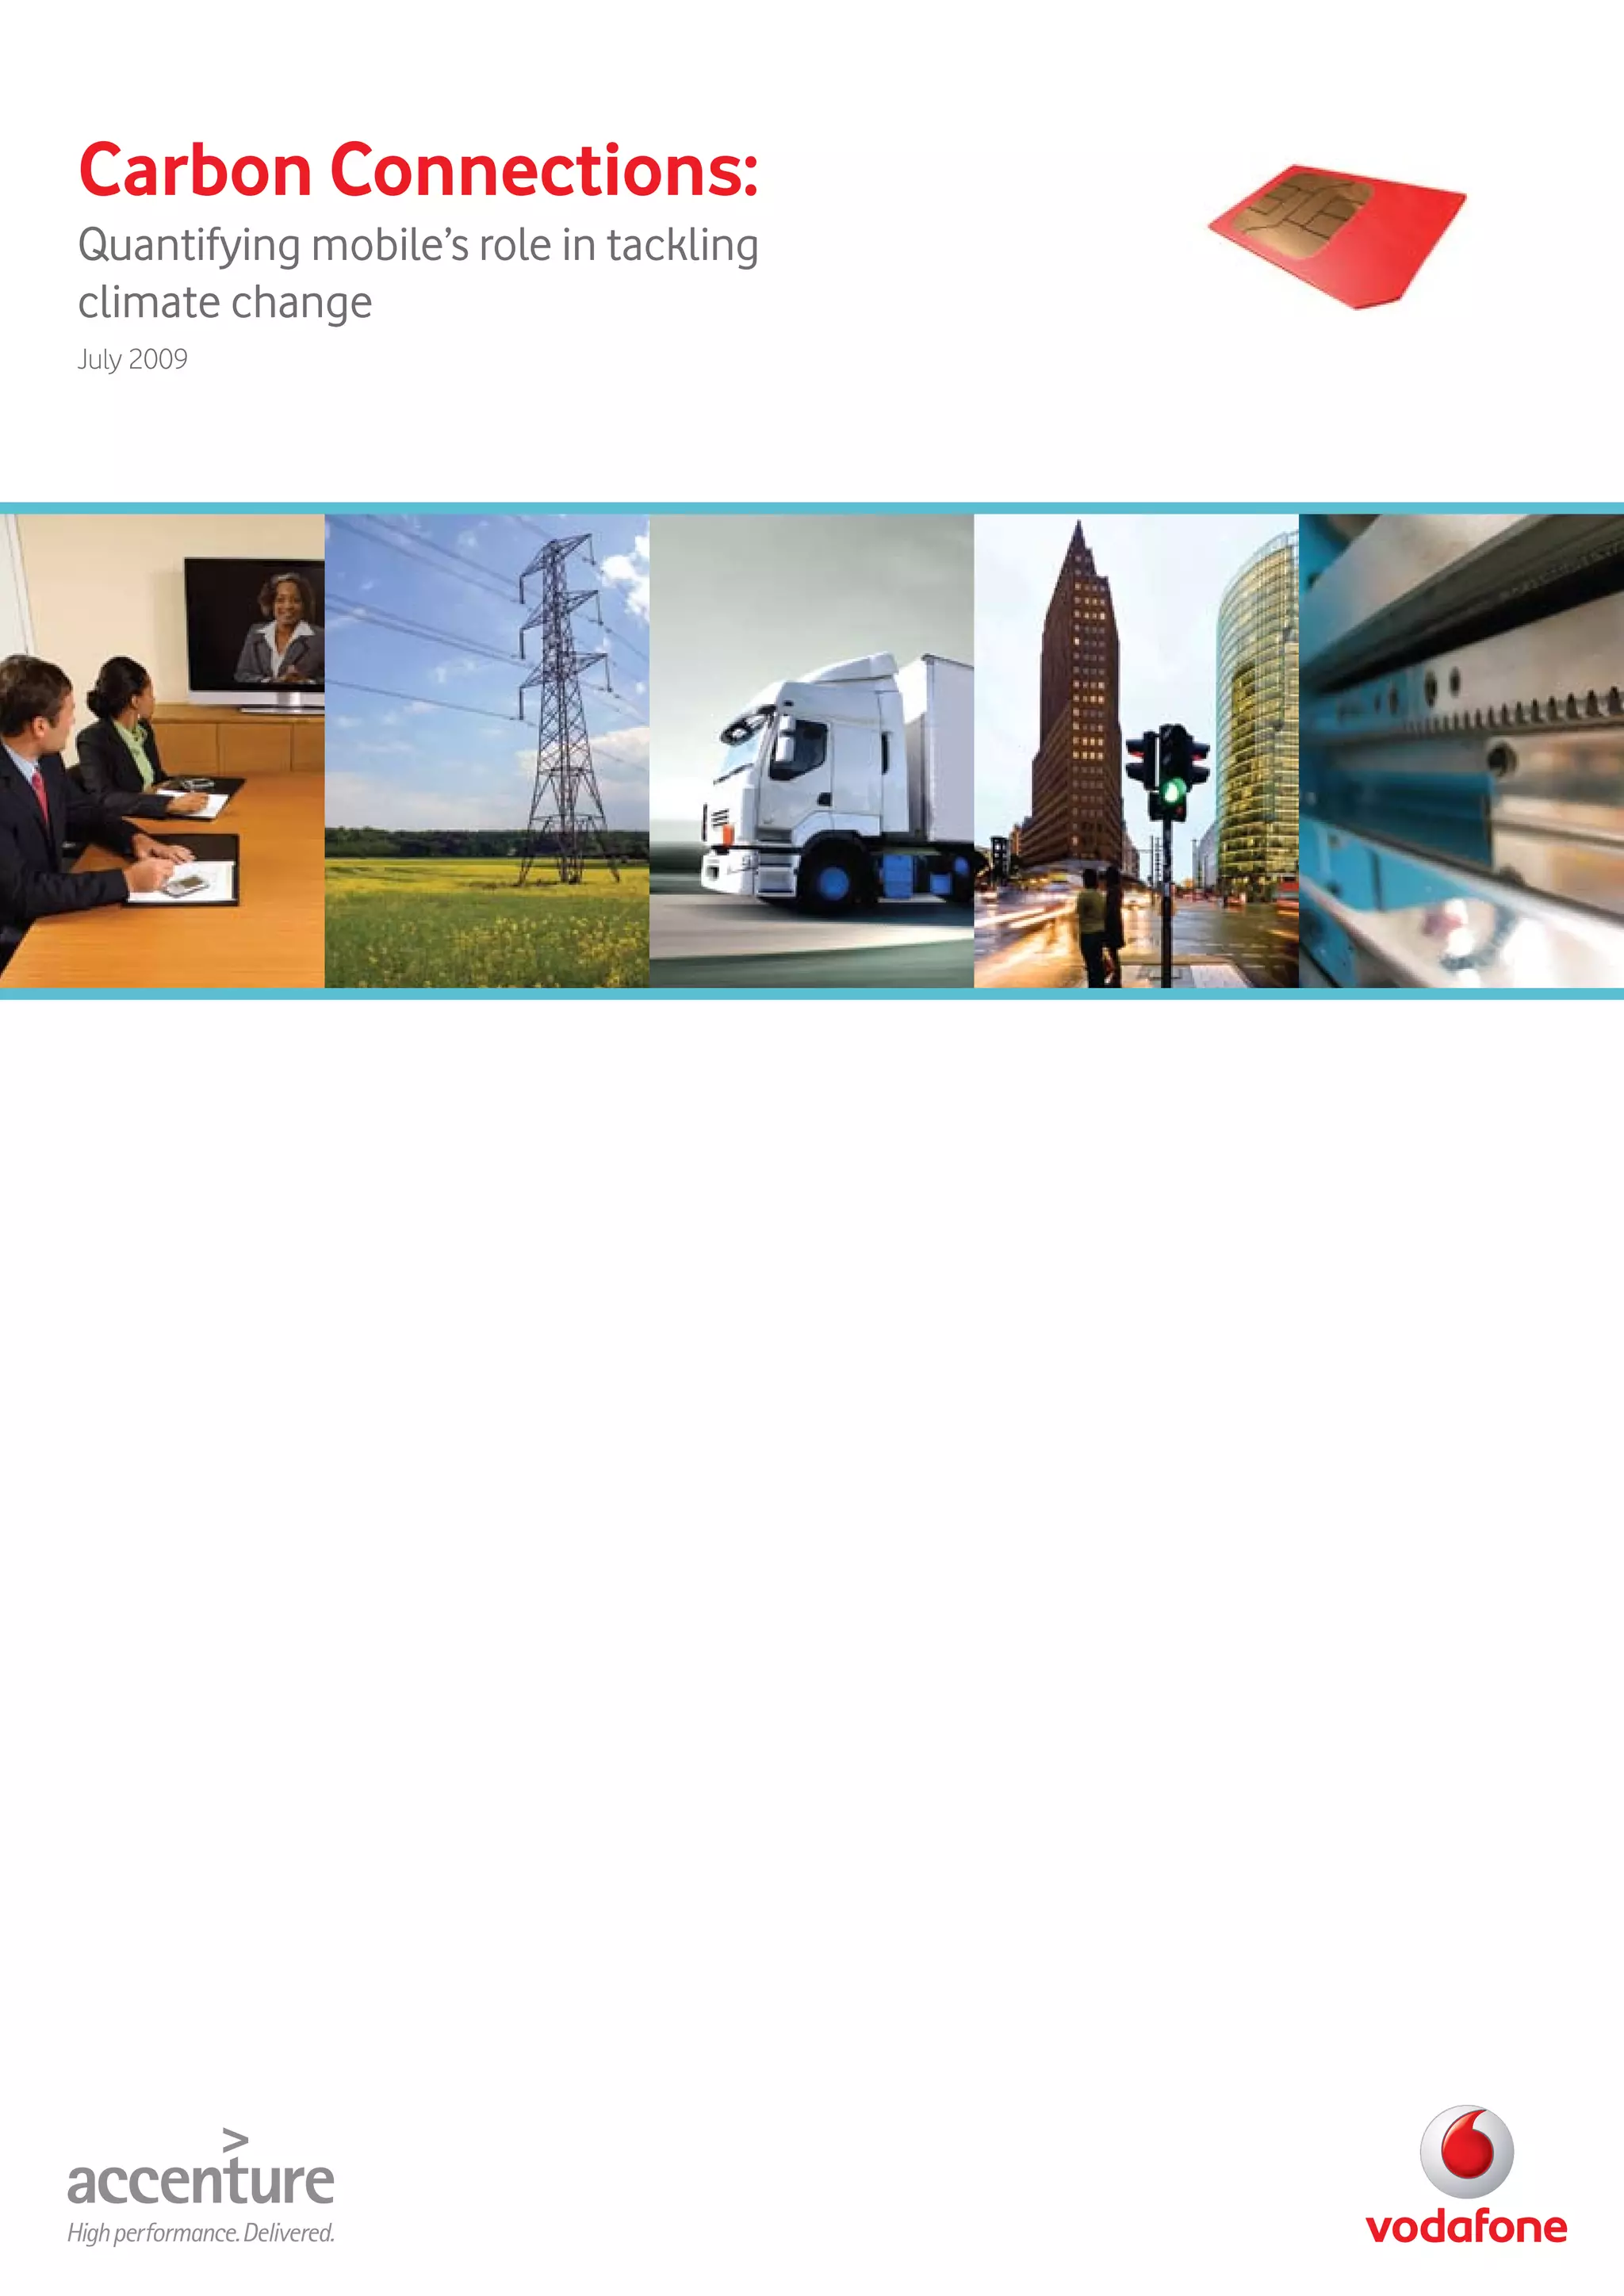
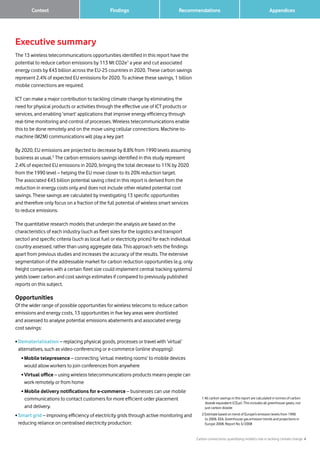
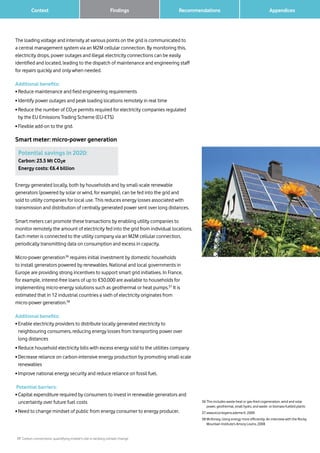
Germany and Spain – offer the greatest carbon and cost savings potential (Figure 25):
• Spain: 1.8 Mt CO2e and €499 million
• Italy: 1.7 Mt CO2e and €656 million
• Germany: 1.3 Mt CO2e and €570 million.
The number of connections generated by smart traffic systems is proportional to the
size of the network in high-density zones. France would need the most connections
as it has the biggest road network in the EU, with 618,928 km in high density areas.51
Key findings for EU-25 countries in 2020
• Total carbon abatement potential:
10.5 Mt CO2e
• Total fuel procurement cost savings potential:
€3.7 billion
• Total connections required to achieve these savings:
3.3 million
51 2009 projection based on 2005 Eurostat data
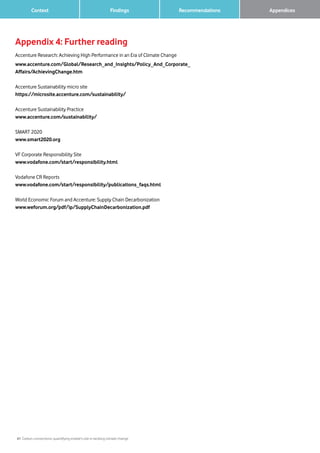
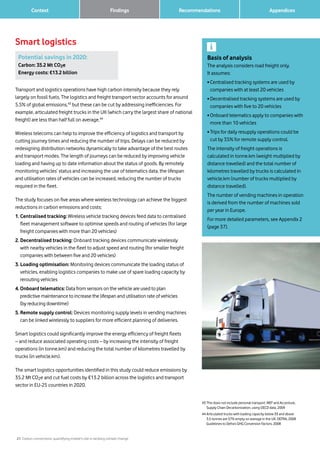
Figure 25. Comparison of the 2020 savings potential of
synchronised traffic and alert system for a selection of
EU-25 countries
Potential savings (@million), required connections (million)
and potential carbon savings (Mt CO2e)
Numberofconnections(million)
End consumer cost savings (€ million)
Potential carbon savings [Mt CO2e]
0.0
0.5
1.0
0 175 350 525 700
France 1.3
United Kingdom
0.5
Germany 1.3
Spain 1.8 Italy 1.7
0 175 350 525 700
0.0
0.2
0.4
0.6
0.8
1.0](https://image.slidesharecdn.com/eecce52b-743d-4120-a04d-57150921933a-150316111110-conversion-gate01/85/Accenture_Carbon_Connections_Quantifying_Mobiles_Role_in_Tackling_Climate_Change-28-320.jpg)
![Carbon connections: quantifying mobile’s role in tackling climate change 30
Findings AppendicesRecommendations Context
Incentives and potential barriers
Some of the opportunities identified, particularly smart grid and smart cities, demand
relatively high capital expenditure and would take a number of years to deploy.
However, these opportunities yield significant returns over the longer term −
€11.4 billion a year for smart grid alone. Other opportunities such as virtual office
require relatively small investment with rapid payback, whereas the significant
investment required to install telematics and centralised tracking systems may mean
that although larger companies can recoup this expenditure, incentives for very small
companies may not be substantial enough.
The business case for other industries to invest in wireless ICT solutions would be
enhanced by a rising cost of carbon emissions (already €16 per tonne53
), which could
be achieved through the strengthening and extension of market-based measures
such as the EU Emissions Trading Scheme. Smart logistics could save transport
companies €563 million in carbon permits in 2020, as the EU Emissions Trading
Scheme is likely to be extended to the freight sector. Smart meters could also help
organisations meet their obligations under environmental regulations, such as the
UK Carbon Reduction Commitment. Other incentives include the additional benefits
offered by specific opportunities (see Findings, pages 11–29).
Smart grids and smart logistics often require the technology used to be compatible
with companies and network providers across different countries. Targeted industries,
system integrators, technology and telecom providers would need to collaborate
effectively and agree common operating standards to accelerate adoption. The EU
Commission is urging member states to agree to a minimum level of functionality54
for smart meters to support the interoperability of grids and electricity providers
across Europe. Currently few markets have set hard targets for the implementation of
smart grid technologies such as smart meters.
Sufficient next generation network coverage and bandwidth must be available to
enable the 1 billion mobile connections (87% of these M2M) required to achieve the
savings identified in this report. In addition, the licensing of mobile infrastructure
assets must recognise the longer lifecycle of an M2M SIM (compared with a person-
to-person [P2P] communications SIM) and infrastructure investment must be
planned on a longer term horizon.
Both governments and industry have an important role to play in overcoming these
potential barriers (see Recommendations, page 31).
53 May 2009 figure
54 EU communiqué, COM (2009) 111 final (12/03/2009)](https://image.slidesharecdn.com/eecce52b-743d-4120-a04d-57150921933a-150316111110-conversion-gate01/85/Accenture_Carbon_Connections_Quantifying_Mobiles_Role_in_Tackling_Climate_Change-31-320.jpg)