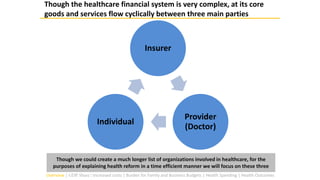
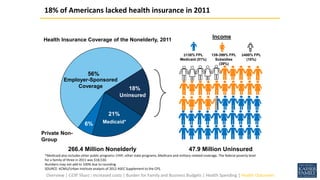
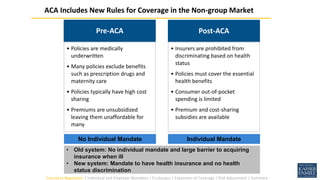
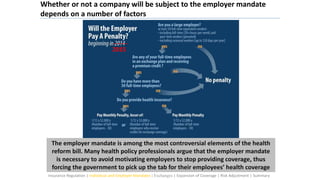
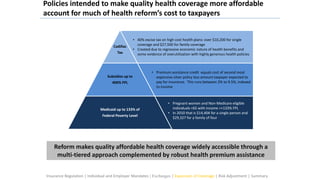
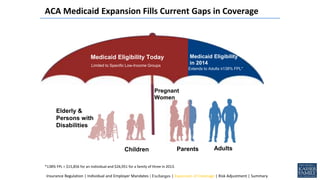
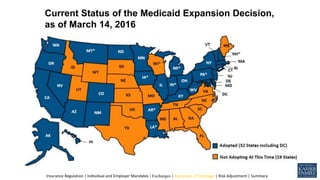
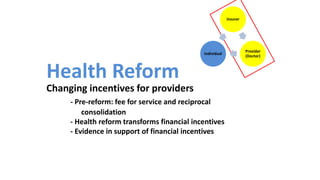
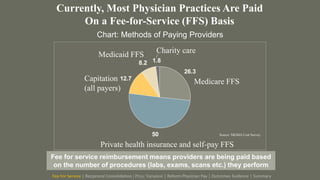
American Health Reform: Overview and Implications
EMRA
Agenda
► Why Health Reform Was (and still is) a National Priority
► Pre and Post-Reform: How Individuals Acquire Insurance
► Pre and Post-Reform: System From Insurer to Provider
► Pre and Post-Reform: Patient Care
Global Perspective
The Case for Reform
Insurer
Provider
(Doctor)
Individual
Though the healthcare financial system is very complex, at its core
goods and services flow cyclically between three main parties
Though we could create a much longer list of organizations involved in healthcare, for the
purposes of explaining health reform in a time efficient manner we will focus on these three
Overview | GDP Share | Increased costs | Burden for Family and Business Budgets | Health Spending | Health Outcomes
Healthcare costs are rising at a rate faster than national GDP growth
• Healthcare costs are
rising at an alarming
rate
• Projected to
account for over
25% of the US
GDP by the year
2025
Every year healthcare represents a bigger portion of the budgets of American
businesses and families and accounts for a larger share of the national GDP
Overview | GDP Share | Increased costs | Burden for Family and Business Budgets | Health Spending | Health Outcomes
From 2000 to 2007, family health insurance premiums rose 87 percent while
median family incomes increased by only 11 percent
Rising healthcare costs are an increasing burden for the budgets of
American families
Overview | GDP Share | Increased costs | Burden for Family and Business Budgets | Health Spending | Health Outcomes
• Large employers typically pay 15 percent of payroll for
health costs
– For comparison, German companies pay 8%
• Employer health care expenditures are growing faster than
the businesses themselves. Corporations report they
cannot drive down business costs and optimize margins
enough to keep absorbing these increases, and employer-
sponsored insurance is eroding as a result.
• Compared to GM, Toyota, which benefits from Japan’s
universal health system, “paid $1,400 less per vehicle on
healthcare”
• GM spent $4.6 billion on health care in 2007, more than it
paid for steel
Rising healthcare costs are an increasing burden for the budgets of
American businesses
Rising health costs inhibit the ability of American corporations to invest, expand,
compete internationally, and continue to offer health coverage to employees
Source: http://thinkprogress.org/politics/2008/12/05/33286/gm-health-care-reform/
Overview | GDP Share | Increased costs | Burden for Family and Business Budgets | Health Spending | Health Outcomes
Global Perspective
The Case for Reform
- Current spending patterns
- Drivers of increased health spending
Source: Achieving a High-Performance Health Care System with Universal
Access: What the United States Can Learn from Other Countries
Ann Intern Med. 2008;148(1):55-75. doi:10.7326/0003-4819-148-1-200801010-
00196
The nation's health dollar, calendar year 2005: where it went
Legend: “Other Spending” includes dentist services, other professional services,
home health, durable medical products, over-the-counter medicines and sundries,
public health, other personal health care, research, and structures and equipment.
Overview | GDP Share | Increased costs | Burden for Family and Business Budgets | Health Spending | Health Outcomes
7%
29%
48%
Drivers of increased health spending: one thought is
that new (expensive) technology is largely responsible
Causes of Growth in Real Per Capita Medical Spending, 1960-2007
Aging of population
Increase in
personal
income
Technological
change:
new drugs,
procedures,
devices,
increased
“intensity” of
care.
Source: Smith et al., 2009, Health Affairs.
More generous
Insurance coverage
11%
Medical price inflation
5%
Overview | GDP Share | Increased costs | Burden for Family and Business Budgets | Health Spending | Health Outcomes
Second driver of increased health spending: Chronic disease
prevalence is expected to increase significantly in the next decade
Given the large projected increase in healthcare costs associated with chronic conditions, many
efforts aim to achieve a better health outcome at a lower cost through improved prevention
and management of disease.
0 20,000 40,000 60,000
Pulmonary conditions
Hypertension
Mental disorders
Heart disease
Diabetes
Cancers
Stroke
Estimated cases in 2023 (thousands)
► Increasing disease burden resulting in rising
healthcare costs and reduced productivity
► Driven in large part by increased obesity and
aging of baby boomers
► 20% of people drive 80% of healthcare costs*
2.48
4.15
0
2
4
6
2013 2023
Projected annual Healthcare costs*
($ trillions)
Treatment
expenditures
Lost
productivity
Total (2023)
790 3,363 4,153
Healthcare costs in 2023 ($ billions)
* Includes productivity losses, which account for 70%
of costs
Source: Study by Milken Institute
*Source: Statistical Brief #73. March 2005.
Agency for Healthcare Research and Quality
Overview | GDP Share | Increased costs | Burden for Family and Business Budgets | Health Spending | Health Outcomes
Chronic Conditions Drive Health Spending
• 20% of people drive 80% of health spending
• Chronic conditions specifically are the main
drivers of health spending
• Daily medication management of chronic
conditions is relatively cheap
• Acute manifestations (ER visits and
hospitalizations) drive the expense
• A better health outcome can be achieved at
a lower cost by better managing chronic
conditions
Overview | GDP Share | Increased costs | Burden for Family and Business Budgets | Health Spending | Health Outcomes
Global Perspective
The Case for Reform
- What we get for health spending
18%
21%
6%
56%
*Medicaid also includes other public programs: CHIP, other state programs, Medicare and military-related coverage. The federal poverty level
for a family of three in 2011 was $18,530.
Numbers may not add to 100% due to rounding.
SOURCE: KCMU/Urban Institute analysis of 2012 ASEC Supplement to the CPS.
18% of Americans lacked health insurance in 2011
47.9 Million Uninsured266.4 Million Nonelderly
Employer-Sponsored
Coverage
Uninsured
Medicaid*
Private Non-
Group
Health Insurance Coverage of the Nonelderly, 2011
Income
≤138% FPL
Medicaid (51%)
139-399% FPL
Subsidies
(39%)
≥400% FPL
(10%)
Overview | GDP Share | Increased costs | Burden for Family and Business Budgets | Health Spending | Health Outcomes
Health outcomes: The US compares unfavorably to other countries
on a number of core health quality measures
Overview | GDP Share | Increased costs | Burden for Family and Business Budgets | Health Spending | Health Outcomes
Though per capita health spending in the US outpaces that of other
industrialized nations, the American healthcare system performs relatively
poorly in terms of health outcomes
Health outcomes: The US compares unfavorably to other
industrialized nations on measures of access and quality
Source “Annals of Internal Medicine”: http://annals.org/data/Journals/AIM/20151/8FF5.jpeg
Relative to the health systems of other industrialized nations, the US healthcare
system costs much more but compares poorly in terms of quality and access
Overview | GDP Share | Increased costs | Burden for Family and Business Budgets | Health Spending | Health Outcomes
Health Reform
Changing how individuals acquire insurance
- Insurance market reform
- Mandates
- Exchanges
- Subsidies for private coverage
- Medicaid expansion for low income
- Risk adjusted payouts to insurers
Insurer
Provider
(Doctor)
Individual
Pre-ACA
• Policies are medically
underwritten
• Many policies exclude benefits
such as prescription drugs and
maternity care
• Policies typically have high cost
sharing
• Premiums are unsubsidized
leaving them unaffordable for
many
Post-ACA
• Insurers are prohibited from
discriminating based on health
status
• Policies must cover the essential
health benefits
• Consumer out-of-pocket
spending is limited
• Premium and cost-sharing
subsidies are available
ACA Includes New Rules for Coverage in the Non-group Market
No Individual Mandate Individual Mandate
• Old system: No individual mandate and large barrier to acquiring
insurance when ill
• New system: Mandate to have health insurance and no health
status discrimination
Insurance Regulation | Individual and Employer Mandates | Exchanges | Expansion of Coverage | Risk Adjustment | Summary
Some employers will be legally bound to contribute to the health
coverage of their employees or pay a penalty
• Penalizes employers with =>50 employees who
do not offer coverage if any of its full-time
employees receives a premium assistance credit
for purchases over an exchange plan
• If more than 200 employees, new employees
automatically enrolled in employer’s plan, if any.
• If less than 200 employees, continue enrollment
of current employees and notify employees of
right to opt out.
– If don’t like employer’s plan, you can “opt out”and
receive a voucher to shop for plans in the exchange
Insurance Regulation | Individual and Employer Mandates | Exchanges | Expansion of Coverage | Risk Adjustment | Summary
The employer mandate is among the most controversial elements of the health
reform bill. Many health policy professionals argue that the employer mandate
is necessary to avoid motivating employers to stop providing coverage, thus
forcing the government to pick up the tab for their employees’ health coverage
Whether or not a company will be subject to the employer mandate
depends on a number of factors
2015
_____
Insurance Regulation | Individual and Employer Mandates | Exchanges | Expansion of Coverage | Risk Adjustment | Summary
Plan Type
“Actuarial
Value” Typical Deductible
Typical
Coinsurance
Maximum Out-of-
Pocket Cost
Bronze 60% $5,000 30% $6,350
Silver 70% $2,000 20% $6,350
Gold 80% $0 20% $6,350
Platinum 90% $0 10% $6,350
Catastrophic
(up to age 30)
NA $6,350 0% $6,350
All figures are for single coverage. Amounts for families would be double.
All plans must cover essential benefits: hospitalization, outpatient medical, emergency care, Rx drugs,
maternity, mental health, rehab, lab tests, preventive services, pediatric dental & vision.
Standardized Plans Sold through Exchanges Will Be Easier to Compare
Insurance Regulation | Individual and Employer Mandates | Exchanges | Expansion of Coverage | Risk Adjustment | Summary
• Pregnant women and Non-Medicare eligible
individuals <65 with income =<133% FPL
• In 2010 that is $14,404 for a single person and
$29,327 for a family of four
• Premium assistance credit equals cost of second most
expensive silver policy less amount taxpayer expected to
pay for insurance. This runs between 2% to 9.5%, indexed
to income
• 40% excise tax on high cost health plans: over $10,200 for single
coverage and $27,500 for family coverage
• Created due to regressive economic nature of health benefits and
some evidence of overutilization with highly generous health policies
Cadillac
Tax
Subsidies up to
400% FPL
Medicaid up to 133% of
Federal Poverty Level
Reform makes quality affordable health coverage widely accessible through a
multi-tiered approach complemented by robust health premium assistance
Policies intended to make quality health coverage more affordable
account for much of health reform’s cost to taxpayers
Insurance Regulation | Individual and Employer Mandates | Exchanges | Expansion of Coverage | Risk Adjustment | Summary
% FPL % of
income
Occupation Annual
salary
2nd lowest cost silver
Unsubsidized: $3,018 age 24
$3,857 age 40
$9,054 age 64
Bronze
Unsubsidized: $2,501 age 24
$3,197 age 40
$7,505 age 64
24 40 64 24 40 64
<133% 2% Fast food worker $14,500 $290 $290 $290 $0 $0 $0
133-150% 3% - 4% Retail clerk $17,000 $660 $660 $660 $143 $0 $0
150-200% 4% - 6.3% Dishwasher $18,930 $886 $886 $886 $369 $225 $0
200-250% 6.3% -
8.05%
Home health aide $24,320 $1,631 $1,631 $1,631 $1,115 $971 $82
250-300% 8.05% -
9.5%
Pre-school teacher $30,750 $2,633 $2,633 $2,633 $2,116 $1,972 $1,083
300-350% 9.5% Construction worker $38,380 $3,018 $3,646 $3,646 $2,501 $2,986 $2,096
350-400% 9.5% Reporter $45,120 $3,018 $3,857 $4,286 $2,501 $3,197 $2,737
Source: KFF Subsidy Calculator, http://www.kff.org/interactive/subsidy-calculator/
Most Consumers in Marketplaces Will Be Eligible for Subsidies to
Lower the Cost of Coverage
This chart indicates the maximum amount an individual will be
expected to pay out of pocket for health insurance
Insurance Regulation | Individual and Employer Mandates | Exchanges | Expansion of Coverage | Risk Adjustment | Summary
Government Subsidy Decreases With a
Person’s or Family’s Annual Income
Type of Insurance Person/ Government
person/family policy price family pays pays
Single male w/ $6,000 $500 $5,500
income of $18,000
Couple w/ $12,000 $1,800 $10,200
income of $30,000
Family of 4 w/ $12,000 $6,000 $6,000
income of $66,000
Though expensive, subsidies are at the heart of
making quality health coverage accessible
Insurance Regulation | Individual and Employer Mandates | Exchanges | Expansion of Coverage | Risk Adjustment | Summary
Medicaid Expansion
Estimated 16 million newly insured IF all states expand
eligibility (and it is clear now that not all states will)
 The income limit for Medicaid eligibility increases to 133%
of the poverty level. Many people who are currently
ineligible (e.g., childless adults, parents w/ low income in
“stingy” states) could now qualify.
 Federal government will fund all of the costs of newly
eligible members for the first few years before eventually
lowering their rate of support to 90%.
Insurance Regulation | Individual and Employer Mandates | Exchanges | Expansion of Coverage | Risk Adjustment | Summary
*138% FPL = $15,856 for an individual and $26,951 for a family of three in 2013.
ACA Medicaid Expansion Fills Current Gaps in Coverage
Adults
Elderly &
Persons with
Disabilities
Parents
Pregnant
Women
Children
Extends to Adults
≤138% FPL*
Medicaid Eligibility Today Medicaid Eligibility
in 2014Limited to Specific Low-Income Groups
Extends to Adults ≤138% FPL*
Insurance Regulation | Individual and Employer Mandates | Exchanges | Expansion of Coverage | Risk Adjustment | Summary
Current Status of the Medicaid Expansion Decision,
as of March 14, 2016
Insurance Regulation | Individual and Employer Mandates | Exchanges | Expansion of Coverage | Risk Adjustment | Summary
In States That Do Not Expand Medicaid, There Will Be Large Gaps in
Coverage for Low-Income Adults
Eligibility for Medicaid and Subsidies as of 2014 in 21 States Not Expanding Medicaid at this Time:
Current Medicaid Eligibility
Limit for Parents
Median of 21 States Not Expanding:
48% FPL
Insurance Regulation | Individual and Employer Mandates | Exchanges | Expansion of Coverage | Risk Adjustment | Summary
ACA Insurance Highlights Summary Slide
 Expands health insurance coverage to 32 million(?) people
through a combination of private and public sector initiatives.
 Creates state health insurance exchanges for individuals and
small employers.
 Carrots: private insurance subsidies offered to families making
up to about $88,000 per year.
 Mandates and sticks:
 Fine individuals $695 or 2.5% of household income in
2016 if don’t have health insurance. Low-income are
exempt. An estimated 4 million will pay fine.
 Fine employers $2,000/worker for not offering insurance.
Small employers (fewer than 50 employees) are exempt.
 Prohibitions on lifetime limits, pre-existing conditions,
and insurance cancellation when individuals becomes sick.
Health Reform
Changing incentives for providers
- Pre-reform: fee for service and reciprocal
consolidation
- Health reform transforms financial incentives
- Evidence in support of financial incentives
Insurer
Provider
(Doctor)
Individual
26.3
50
12.7
8.2 1.8
Private health insurance and self-pay FFS
Medicare FFSCapitation
(all payers)
Medicaid FFS Charity care
Source: MGMA Cost Survey.
Currently, Most Physician Practices Are Paid
On a Fee-for-Service (FFS) Basis
Fee For Service | Reciprocal Consolidation | Price Variation | Reform Physician Pay | Outcomes Evidence | Summary
Fee for service reimbursement means providers are being paid based
on the number of procedures (labs, exams, scans etc.) they perform
Chart: Methods of Paying Providers
The Dartmouth Institute for Health Policy and Clinical Practice conservatively
estimates that 30 percent or more of U.S. health care spending is on unnecessary
care.
Studies indicate that the number of services rendered per disease
manifestation vary wildly across the country with no subsequent
difference in health outcome
Regional differences in hospital admissions:
Fee For Service | Reciprocal Consolidation | Price Variation | Reform Physician Pay | Outcomes Evidence | Summary
Insurer
Provider
(Doctor)
Insurers and provider groups with increasingly large market shares have made
many markets non-competitive
In an effort to strengthen their negotiation positions, insurers and
providers have gone through periods of reciprocal consolidation
Fee For Service | Reciprocal Consolidation | Price Variation | Reform Physician Pay | Outcomes Evidence | Summary
U.S. Health
Insurance
Industry
Consolidated,
and
Consolidation
Increases
Bargaining
Power
Fee For Service | Reciprocal Consolidation | Price Variation | Reform Physician Pay | Outcomes Evidence | Summary
Source: New York Times, August 13, 2013.
Strategy #1: Gain Pricing Power
# of Mergers
Have Doubled
as Hospitals
Try to
Maintain
Pricing Power
Over
Insurers
Fee For Service | Reciprocal Consolidation | Price Variation | Reform Physician Pay | Outcomes Evidence | Summary
2,400
2,500
2,600
2,700
2,800
2,900
3,000
3,100
2001 2002 2003 2004 2005 2006 2007 2008 2009 2010 2011
Hospitals
Systems Can Negotiate Collectively With Private
Health Insurers and Drive Up Prices
# of Hospitals in Health Systems, 2001 – 2011
59% of hospitals
are in a system
Source: Avalere Health analysis of AHA Annual Survey data, 2012 for community
hospitals.
Individual hospitals are increasingly parts of larger health systems
that collectively wield greater negotiating power
Fee For Service | Reciprocal Consolidation | Price Variation | Reform Physician Pay | Outcomes Evidence | Summary
Empirical Studies: Hospital Market Power Matters
Fee For Service | Reciprocal Consolidation | Price Variation | Reform Physician Pay | Outcomes Evidence | Summary
Driving Up the Price Per Admission is Critical, Especially
When Admissions are Declining
Source: S&P Industry Surveys, Healthcare Facilities, 2013.
Change in Revenue Per Admission at For-Profit
Hospitals Between 2011 and 2012
0.2
0.3
2.4
3.0
4.6
6.1
Universal
HCA
Tenet
Community
LifePoint
HMA
Medicare
and Medicaid
are not raising
prices much
(or are dropping
them)
Health systems are using their enhanced negotiating power to
increase revenue per admission
Fee For Service | Reciprocal Consolidation | Price Variation | Reform Physician Pay | Outcomes Evidence | Summary
Source: Research Brief, Center for Studying Health System Change, September 2013.
Private Insurer Payments to Hospitals Vary
Substantially Both Across and Within Markets
Fee For Service | Reciprocal Consolidation | Price Variation | Reform Physician Pay | Outcomes Evidence | Summary
More Evidence of Price Variation Within a Market
• Negotiations between providers and insurers result in wildly
different prices for the same service at different hospitals
• Negotiations also result in wildly different prices for the same
service at the same hospital based on the market power of the
insurer
Fee For Service | Reciprocal Consolidation | Price Variation | Reform Physician Pay | Outcomes Evidence | Summary
Source: company documents of publicly traded managed care
plans.
4.9%
4.4%
3.8% 3.9%
4.9%
5.8%
6.9%
7.8%
6.6%
7.1%
7.5%
5.6%
5.0%
6.3% 6.5%
0%
1%
2%
3%
4%
5%
6%
7%
8%
9%
10%
1997 1998 1999 2000 2001 2002 2003 2004 2005 2006 2007 2008 2009 2010 2011
MedianOperatingMargins
Insurer Profit Actually Increased When They
Relaxed Cost Control Measures
Median Operating Margins for the 11
Largest Publicly Traded Insurers, 1997–2011
Reciprocally consolidated health markets are more profitable for
providers and insurers, but fail to control health costs for patients
Fee For Service | Reciprocal Consolidation | Price Variation | Reform Physician Pay | Outcomes Evidence | Summary
-2
0
2
4
6
8
10
12
14
16
18
90 91 92 93 94 95 96 97 98 99 '00 '01 '02 '03 '04 '05 '06 '07 '08 09 10 11 12 13
Source: Kaiser Family Foundation, Employer Health Benefits 2013
Annual Survey.
Percent
Change
Average annual % change in private health insurance premiums
4.0%
13.9%
Height of
managed care
4 Recent Health Insurance Eras
Providers strike back
Self-managed
care
Claims processing
Fee For Service | Reciprocal Consolidation | Price Variation | Reform Physician Pay | Outcomes Evidence | Summary
Instituting Reform
Reform encourages innovative reimbursement mechanisms for health
service providers intended to enhance quality and lower costs
The health reform bill created the Centers for Medicare and Medicaid Innovation
(CMMI) to fund research and help implement best practices in this rapidly
innovating field
• Pay for performance
• Pay for quality and
cost goals
• Pay per episode of
health care
• Pay globally for each
patient each year
• Pay a yearly salary
Many options available
to reimburse
strategically
Fee For Service | Reciprocal Consolidation | Price Variation | Reform Physician Pay | Outcomes Evidence | Summary
Source: Baicker and Levy, NEJM, August 2013.
New Medicare Policies Encourage MDs and Hospitals
to Coordinate and Consolidate. Effect on Prices?
Fee For Service | Reciprocal Consolidation | Price Variation | Reform Physician Pay | Outcomes Evidence | Summary
Example of innovative payment scheme: Medicare
Hospital Value-Based Purchasing in the ACA (type
of pay for performance program)
• Timing
– Hospitals are receiving SMALL value-based incentives
payments beginning in 2013 for processes of care in
certain disease areas.
– Hospitals with high (preventable) re-admissions or
hospital-acquired infection rates will also receive lower
payments.
– Physicians penalized for not providing data on quality.
• Funding: Program will be funded by reducing base
operating DRG payments for hospital discharges.
• Measures: clinical process, patient ratings, mortality.
Fee For Service | Reciprocal Consolidation | Price Variation | Reform Physician Pay | Outcomes Evidence | Summary
As Much as 6% of a Hospital’s Medicare
Payment Will Be at Risk in 2017
Source: Advisory Board, Next-Generation Clinical Integration, 2012.
Fee For Service | Reciprocal Consolidation | Price Variation | Reform Physician Pay | Outcomes Evidence | Summary
Evidence to support financial incentives: utilizing financial incentives
and disease management techniques lower costs and improve quality
A better health
outcome can be
achieved at a lower
cost by utilizing robust
incentive programs for
healthcare service
providers
Through improved management of chronic conditions, insurers have the opportunity to offer
the highest quality service at the lowest cost in the market
The more robust the
incentives the better
Quality
Score
Fee For Service | Reciprocal Consolidation | Price Variation | Reform Physician Pay | Outcomes Evidence | Summary
Program with most
incentives
Summary Slide: Changing Incentives for Providers
• Fee For Service payment fails to align payment with goals of
prevention and improved health
• Health reform encourages restructured financial incentives
intended to align goals of quality with financial efficiency
• Evidence from demonstration projects show that financial
incentive programs can work
• Whether or not these incentives will decrease large-scale cost
growth in often non-competitive health markets is an open
question. Research is ongoing.
Fee For Service | Reciprocal Consolidation | Price Variation | Reform Physician Pay | Outcomes Evidence | Summary
Health Reform
Working to improve patient care
- Health infrastructure
- Lack of care support systems
- Reform incents EHR use
- Infrastructure reform
- Vertical integration
- Summary
Insurer
Provider
(Doctor)
Individual
Hospitals have an increasingly low average inpatient occupancy rate. Outpatient visits are
increasing rapidly.
Many health policy professionals argue that our health infrastructure
is either overbuilt or that resources are invested inefficiently
Health Infrastructure| Lack of Care Support Systems | EHR | Reforming Infrastructure | Vertical Integration | Summary
“We find compelling evidence that a
positive, statistically significant relationship
exists between hospital bed availability and
inpatient hospitalization rates. Additionally,
the observed relationship is invariant with
changes in the geographic scale of analysis.”
http://www.plosone.org/article/info%3Adoi%2F10.1371%2Fjournal.pone.0054900
Evidence demonstrates that increased hospital bed availability is by
itself an incentive for increased health spending
• Nearly one-fourth of Medicare beneficiaries
have five or more chronic conditions. These
beneficiaries account for two-thirds of the
program’s spending
• These patients will have prescriptions from
multiple doctors that are not communicating
with one another to coordinate care
• These beneficiaries are part of the 20% of
patients that drive 80% of costs
The focus of health reform’s effort to improve patient care focuses on program and
infrastructure developments that will facilitate prevention
The lack of support systems that facilitate communication between
providers hurts patient care and increases costs
Health Infrastructure| Lack of Care Support Systems | EHR | Reforming Infrastructure | Vertical Integration | Summary
• Lack of care coordination—such as inefficient
communication between providers and lack of access to
medical records when specialists intervene—leads to
duplication of tests and inappropriate treatments that cost
$25 billion to $50 billion annually.
• Adverse Drug Events: any injuries resulting from medication
use, including physical harm, mental harm, or loss of
function
– 700,000 emergency department visits and 120,000
hospitalizations are due to ADEs annually
– $3.5 billion is spent on extra medical costs of ADEs annually;
– At least 40% of costs of ambulatory (non-hospital settings) ADEs
are estimated to be preventable
• Electronic systems can also be used to order drugs, which is
another step that commonly results in errors
Source: http://www.cdc.gov/medicationsafety/basics.html
Source: http://www.americanprogress.org/issues/2010/03/pdf/health_delivery.pdf
Lack of health information systems that support coordinated care
harm care quality in a number of ways
The lack of systems in place to coordinate care, lower the risk of adverse drug events, and help
providers communicate has serious quality and cost consequences
Health Infrastructure| Lack of Care Support Systems | EHR | Reforming Infrastructure | Vertical Integration | Summary
Instituting Reform
Patient
PatientNeeds
BestMedical
EvidenceAvailable
Provider
Interoperable
Electronic
Health Record
Health Infrastructure| Lack of Care Support Systems | EHR | Reforming Infrastructure | Vertical Integration | Summary
• EHRs and other health care IT, "tools can help
prevent medical errors and eliminate the
duplication of services and tests, saving lives
and money," and, "if widely adopted, health IT
would have the potential to save more than
250 lives and $452 million daily.“
Electronic Health Records (EHR) have a great deal of potential to help
improve quality and reduce costs
Health Infrastructure| Lack of Care Support Systems | EHR | Reforming Infrastructure | Vertical Integration | Summary
• With advances in technology, hospitals are
performing more outpatient procedures intended
to keep people from having to check into
hospitals for care in the first place.
• Changes in insurance reimbursement also have
put pressure on hospitals to cut costs and reduce
the length of a patient's stay.
• As more care shifts to outpatient clinics,
rehabilitation services and home health services,
hospitals are becoming a smaller and smaller
piece of the overall medical system.
Health reform’s focus on improved disease management has the
potential to impact how the infrastructure of health systems is
designed
As incentives shift in an attempt to transform our current sick-care system into a true
healthcare system, health infrastructure should see a complementary shift to a greater focus
on community outpatient treatment facilities rather than hospitals
Source: http://www.pressherald.com/business/empty-beds-may-signal-too-many-
hospitals_2012-12-17.html?pageType=mobile&id=4
Health Infrastructure| Lack of Care Support Systems | EHR | Reforming Infrastructure | Vertical Integration | Summary
Health systems across the country are increasingly
moving to employ physicians directly
Source: Securing Physician Alignment, Advisory Board, 2011.
Health systems are vertically integrating by employing providers directly in an
effort to align financial incentives with the quality of care
Health Infrastructure| Lack of Care Support Systems | EHR | Reforming Infrastructure | Vertical Integration | Summary
Summary: Provider to Patient
• Average hospital inpatient occupancy rate
trending in the low 60’s
• The health system lacks many support programs
that could help coordinate and improve care
• Reform incents and funds the creation of systems
that improve care
• Healthcare infrastructure is seeing a shift towards
focusing on outpatient treatment facilities
• Health systems are increasingly vertically
integrating
Health Infrastructure| Lack of Care Support Systems | EHR | Reforming Infrastructure | Vertical Integration | Summary
Health Reform
Appendix
Insurer
Provider
(Doctor)
Individual

ACA and Health Reform

  • 1.
    American Health Reform:Overview and Implications EMRA
  • 2.
    Agenda ► Why HealthReform Was (and still is) a National Priority ► Pre and Post-Reform: How Individuals Acquire Insurance ► Pre and Post-Reform: System From Insurer to Provider ► Pre and Post-Reform: Patient Care
  • 3.
  • 4.
    Insurer Provider (Doctor) Individual Though the healthcarefinancial system is very complex, at its core goods and services flow cyclically between three main parties Though we could create a much longer list of organizations involved in healthcare, for the purposes of explaining health reform in a time efficient manner we will focus on these three Overview | GDP Share | Increased costs | Burden for Family and Business Budgets | Health Spending | Health Outcomes
  • 5.
    Overview | GDPShare | Increased costs | Burden for Family and Business Budgets | Health Spending | Health Outcomes
  • 6.
    Healthcare costs arerising at a rate faster than national GDP growth • Healthcare costs are rising at an alarming rate • Projected to account for over 25% of the US GDP by the year 2025 Every year healthcare represents a bigger portion of the budgets of American businesses and families and accounts for a larger share of the national GDP Overview | GDP Share | Increased costs | Burden for Family and Business Budgets | Health Spending | Health Outcomes
  • 7.
    From 2000 to2007, family health insurance premiums rose 87 percent while median family incomes increased by only 11 percent Rising healthcare costs are an increasing burden for the budgets of American families Overview | GDP Share | Increased costs | Burden for Family and Business Budgets | Health Spending | Health Outcomes
  • 8.
    • Large employerstypically pay 15 percent of payroll for health costs – For comparison, German companies pay 8% • Employer health care expenditures are growing faster than the businesses themselves. Corporations report they cannot drive down business costs and optimize margins enough to keep absorbing these increases, and employer- sponsored insurance is eroding as a result. • Compared to GM, Toyota, which benefits from Japan’s universal health system, “paid $1,400 less per vehicle on healthcare” • GM spent $4.6 billion on health care in 2007, more than it paid for steel Rising healthcare costs are an increasing burden for the budgets of American businesses Rising health costs inhibit the ability of American corporations to invest, expand, compete internationally, and continue to offer health coverage to employees Source: http://thinkprogress.org/politics/2008/12/05/33286/gm-health-care-reform/ Overview | GDP Share | Increased costs | Burden for Family and Business Budgets | Health Spending | Health Outcomes
  • 9.
    Global Perspective The Casefor Reform - Current spending patterns - Drivers of increased health spending
  • 10.
    Source: Achieving aHigh-Performance Health Care System with Universal Access: What the United States Can Learn from Other Countries Ann Intern Med. 2008;148(1):55-75. doi:10.7326/0003-4819-148-1-200801010- 00196 The nation's health dollar, calendar year 2005: where it went Legend: “Other Spending” includes dentist services, other professional services, home health, durable medical products, over-the-counter medicines and sundries, public health, other personal health care, research, and structures and equipment. Overview | GDP Share | Increased costs | Burden for Family and Business Budgets | Health Spending | Health Outcomes
  • 11.
    7% 29% 48% Drivers of increasedhealth spending: one thought is that new (expensive) technology is largely responsible Causes of Growth in Real Per Capita Medical Spending, 1960-2007 Aging of population Increase in personal income Technological change: new drugs, procedures, devices, increased “intensity” of care. Source: Smith et al., 2009, Health Affairs. More generous Insurance coverage 11% Medical price inflation 5% Overview | GDP Share | Increased costs | Burden for Family and Business Budgets | Health Spending | Health Outcomes
  • 12.
    Second driver ofincreased health spending: Chronic disease prevalence is expected to increase significantly in the next decade Given the large projected increase in healthcare costs associated with chronic conditions, many efforts aim to achieve a better health outcome at a lower cost through improved prevention and management of disease. 0 20,000 40,000 60,000 Pulmonary conditions Hypertension Mental disorders Heart disease Diabetes Cancers Stroke Estimated cases in 2023 (thousands) ► Increasing disease burden resulting in rising healthcare costs and reduced productivity ► Driven in large part by increased obesity and aging of baby boomers ► 20% of people drive 80% of healthcare costs* 2.48 4.15 0 2 4 6 2013 2023 Projected annual Healthcare costs* ($ trillions) Treatment expenditures Lost productivity Total (2023) 790 3,363 4,153 Healthcare costs in 2023 ($ billions) * Includes productivity losses, which account for 70% of costs Source: Study by Milken Institute *Source: Statistical Brief #73. March 2005. Agency for Healthcare Research and Quality Overview | GDP Share | Increased costs | Burden for Family and Business Budgets | Health Spending | Health Outcomes
  • 13.
    Chronic Conditions DriveHealth Spending • 20% of people drive 80% of health spending • Chronic conditions specifically are the main drivers of health spending • Daily medication management of chronic conditions is relatively cheap • Acute manifestations (ER visits and hospitalizations) drive the expense • A better health outcome can be achieved at a lower cost by better managing chronic conditions Overview | GDP Share | Increased costs | Burden for Family and Business Budgets | Health Spending | Health Outcomes
  • 14.
    Global Perspective The Casefor Reform - What we get for health spending
  • 15.
    18% 21% 6% 56% *Medicaid also includesother public programs: CHIP, other state programs, Medicare and military-related coverage. The federal poverty level for a family of three in 2011 was $18,530. Numbers may not add to 100% due to rounding. SOURCE: KCMU/Urban Institute analysis of 2012 ASEC Supplement to the CPS. 18% of Americans lacked health insurance in 2011 47.9 Million Uninsured266.4 Million Nonelderly Employer-Sponsored Coverage Uninsured Medicaid* Private Non- Group Health Insurance Coverage of the Nonelderly, 2011 Income ≤138% FPL Medicaid (51%) 139-399% FPL Subsidies (39%) ≥400% FPL (10%) Overview | GDP Share | Increased costs | Burden for Family and Business Budgets | Health Spending | Health Outcomes
  • 16.
    Health outcomes: TheUS compares unfavorably to other countries on a number of core health quality measures Overview | GDP Share | Increased costs | Burden for Family and Business Budgets | Health Spending | Health Outcomes Though per capita health spending in the US outpaces that of other industrialized nations, the American healthcare system performs relatively poorly in terms of health outcomes
  • 17.
    Health outcomes: TheUS compares unfavorably to other industrialized nations on measures of access and quality Source “Annals of Internal Medicine”: http://annals.org/data/Journals/AIM/20151/8FF5.jpeg Relative to the health systems of other industrialized nations, the US healthcare system costs much more but compares poorly in terms of quality and access Overview | GDP Share | Increased costs | Burden for Family and Business Budgets | Health Spending | Health Outcomes
  • 18.
    Health Reform Changing howindividuals acquire insurance - Insurance market reform - Mandates - Exchanges - Subsidies for private coverage - Medicaid expansion for low income - Risk adjusted payouts to insurers Insurer Provider (Doctor) Individual
  • 19.
    Pre-ACA • Policies aremedically underwritten • Many policies exclude benefits such as prescription drugs and maternity care • Policies typically have high cost sharing • Premiums are unsubsidized leaving them unaffordable for many Post-ACA • Insurers are prohibited from discriminating based on health status • Policies must cover the essential health benefits • Consumer out-of-pocket spending is limited • Premium and cost-sharing subsidies are available ACA Includes New Rules for Coverage in the Non-group Market No Individual Mandate Individual Mandate • Old system: No individual mandate and large barrier to acquiring insurance when ill • New system: Mandate to have health insurance and no health status discrimination Insurance Regulation | Individual and Employer Mandates | Exchanges | Expansion of Coverage | Risk Adjustment | Summary
  • 20.
    Insurance Regulation |Individual and Employer Mandates | Exchanges | Expansion of Coverage | Risk Adjustment | Summary
  • 21.
    Some employers willbe legally bound to contribute to the health coverage of their employees or pay a penalty • Penalizes employers with =>50 employees who do not offer coverage if any of its full-time employees receives a premium assistance credit for purchases over an exchange plan • If more than 200 employees, new employees automatically enrolled in employer’s plan, if any. • If less than 200 employees, continue enrollment of current employees and notify employees of right to opt out. – If don’t like employer’s plan, you can “opt out”and receive a voucher to shop for plans in the exchange Insurance Regulation | Individual and Employer Mandates | Exchanges | Expansion of Coverage | Risk Adjustment | Summary
  • 22.
    The employer mandateis among the most controversial elements of the health reform bill. Many health policy professionals argue that the employer mandate is necessary to avoid motivating employers to stop providing coverage, thus forcing the government to pick up the tab for their employees’ health coverage Whether or not a company will be subject to the employer mandate depends on a number of factors 2015 _____ Insurance Regulation | Individual and Employer Mandates | Exchanges | Expansion of Coverage | Risk Adjustment | Summary
  • 23.
    Insurance Regulation |Individual and Employer Mandates | Exchanges | Expansion of Coverage | Risk Adjustment | Summary
  • 24.
    Plan Type “Actuarial Value” TypicalDeductible Typical Coinsurance Maximum Out-of- Pocket Cost Bronze 60% $5,000 30% $6,350 Silver 70% $2,000 20% $6,350 Gold 80% $0 20% $6,350 Platinum 90% $0 10% $6,350 Catastrophic (up to age 30) NA $6,350 0% $6,350 All figures are for single coverage. Amounts for families would be double. All plans must cover essential benefits: hospitalization, outpatient medical, emergency care, Rx drugs, maternity, mental health, rehab, lab tests, preventive services, pediatric dental & vision. Standardized Plans Sold through Exchanges Will Be Easier to Compare Insurance Regulation | Individual and Employer Mandates | Exchanges | Expansion of Coverage | Risk Adjustment | Summary
  • 25.
    • Pregnant womenand Non-Medicare eligible individuals <65 with income =<133% FPL • In 2010 that is $14,404 for a single person and $29,327 for a family of four • Premium assistance credit equals cost of second most expensive silver policy less amount taxpayer expected to pay for insurance. This runs between 2% to 9.5%, indexed to income • 40% excise tax on high cost health plans: over $10,200 for single coverage and $27,500 for family coverage • Created due to regressive economic nature of health benefits and some evidence of overutilization with highly generous health policies Cadillac Tax Subsidies up to 400% FPL Medicaid up to 133% of Federal Poverty Level Reform makes quality affordable health coverage widely accessible through a multi-tiered approach complemented by robust health premium assistance Policies intended to make quality health coverage more affordable account for much of health reform’s cost to taxpayers Insurance Regulation | Individual and Employer Mandates | Exchanges | Expansion of Coverage | Risk Adjustment | Summary
  • 26.
    % FPL %of income Occupation Annual salary 2nd lowest cost silver Unsubsidized: $3,018 age 24 $3,857 age 40 $9,054 age 64 Bronze Unsubsidized: $2,501 age 24 $3,197 age 40 $7,505 age 64 24 40 64 24 40 64 <133% 2% Fast food worker $14,500 $290 $290 $290 $0 $0 $0 133-150% 3% - 4% Retail clerk $17,000 $660 $660 $660 $143 $0 $0 150-200% 4% - 6.3% Dishwasher $18,930 $886 $886 $886 $369 $225 $0 200-250% 6.3% - 8.05% Home health aide $24,320 $1,631 $1,631 $1,631 $1,115 $971 $82 250-300% 8.05% - 9.5% Pre-school teacher $30,750 $2,633 $2,633 $2,633 $2,116 $1,972 $1,083 300-350% 9.5% Construction worker $38,380 $3,018 $3,646 $3,646 $2,501 $2,986 $2,096 350-400% 9.5% Reporter $45,120 $3,018 $3,857 $4,286 $2,501 $3,197 $2,737 Source: KFF Subsidy Calculator, http://www.kff.org/interactive/subsidy-calculator/ Most Consumers in Marketplaces Will Be Eligible for Subsidies to Lower the Cost of Coverage This chart indicates the maximum amount an individual will be expected to pay out of pocket for health insurance Insurance Regulation | Individual and Employer Mandates | Exchanges | Expansion of Coverage | Risk Adjustment | Summary
  • 27.
    Government Subsidy DecreasesWith a Person’s or Family’s Annual Income Type of Insurance Person/ Government person/family policy price family pays pays Single male w/ $6,000 $500 $5,500 income of $18,000 Couple w/ $12,000 $1,800 $10,200 income of $30,000 Family of 4 w/ $12,000 $6,000 $6,000 income of $66,000 Though expensive, subsidies are at the heart of making quality health coverage accessible Insurance Regulation | Individual and Employer Mandates | Exchanges | Expansion of Coverage | Risk Adjustment | Summary
  • 28.
    Medicaid Expansion Estimated 16million newly insured IF all states expand eligibility (and it is clear now that not all states will)  The income limit for Medicaid eligibility increases to 133% of the poverty level. Many people who are currently ineligible (e.g., childless adults, parents w/ low income in “stingy” states) could now qualify.  Federal government will fund all of the costs of newly eligible members for the first few years before eventually lowering their rate of support to 90%. Insurance Regulation | Individual and Employer Mandates | Exchanges | Expansion of Coverage | Risk Adjustment | Summary
  • 29.
    *138% FPL =$15,856 for an individual and $26,951 for a family of three in 2013. ACA Medicaid Expansion Fills Current Gaps in Coverage Adults Elderly & Persons with Disabilities Parents Pregnant Women Children Extends to Adults ≤138% FPL* Medicaid Eligibility Today Medicaid Eligibility in 2014Limited to Specific Low-Income Groups Extends to Adults ≤138% FPL* Insurance Regulation | Individual and Employer Mandates | Exchanges | Expansion of Coverage | Risk Adjustment | Summary
  • 30.
    Current Status ofthe Medicaid Expansion Decision, as of March 14, 2016 Insurance Regulation | Individual and Employer Mandates | Exchanges | Expansion of Coverage | Risk Adjustment | Summary
  • 31.
    In States ThatDo Not Expand Medicaid, There Will Be Large Gaps in Coverage for Low-Income Adults Eligibility for Medicaid and Subsidies as of 2014 in 21 States Not Expanding Medicaid at this Time: Current Medicaid Eligibility Limit for Parents Median of 21 States Not Expanding: 48% FPL Insurance Regulation | Individual and Employer Mandates | Exchanges | Expansion of Coverage | Risk Adjustment | Summary
  • 32.
    ACA Insurance HighlightsSummary Slide  Expands health insurance coverage to 32 million(?) people through a combination of private and public sector initiatives.  Creates state health insurance exchanges for individuals and small employers.  Carrots: private insurance subsidies offered to families making up to about $88,000 per year.  Mandates and sticks:  Fine individuals $695 or 2.5% of household income in 2016 if don’t have health insurance. Low-income are exempt. An estimated 4 million will pay fine.  Fine employers $2,000/worker for not offering insurance. Small employers (fewer than 50 employees) are exempt.  Prohibitions on lifetime limits, pre-existing conditions, and insurance cancellation when individuals becomes sick.
  • 33.
    Health Reform Changing incentivesfor providers - Pre-reform: fee for service and reciprocal consolidation - Health reform transforms financial incentives - Evidence in support of financial incentives Insurer Provider (Doctor) Individual
  • 34.
    26.3 50 12.7 8.2 1.8 Private healthinsurance and self-pay FFS Medicare FFSCapitation (all payers) Medicaid FFS Charity care Source: MGMA Cost Survey. Currently, Most Physician Practices Are Paid On a Fee-for-Service (FFS) Basis Fee For Service | Reciprocal Consolidation | Price Variation | Reform Physician Pay | Outcomes Evidence | Summary Fee for service reimbursement means providers are being paid based on the number of procedures (labs, exams, scans etc.) they perform Chart: Methods of Paying Providers
  • 35.
    The Dartmouth Institutefor Health Policy and Clinical Practice conservatively estimates that 30 percent or more of U.S. health care spending is on unnecessary care. Studies indicate that the number of services rendered per disease manifestation vary wildly across the country with no subsequent difference in health outcome Regional differences in hospital admissions: Fee For Service | Reciprocal Consolidation | Price Variation | Reform Physician Pay | Outcomes Evidence | Summary
  • 36.
    Insurer Provider (Doctor) Insurers and providergroups with increasingly large market shares have made many markets non-competitive In an effort to strengthen their negotiation positions, insurers and providers have gone through periods of reciprocal consolidation Fee For Service | Reciprocal Consolidation | Price Variation | Reform Physician Pay | Outcomes Evidence | Summary
  • 37.
    U.S. Health Insurance Industry Consolidated, and Consolidation Increases Bargaining Power Fee ForService | Reciprocal Consolidation | Price Variation | Reform Physician Pay | Outcomes Evidence | Summary
  • 38.
    Source: New YorkTimes, August 13, 2013. Strategy #1: Gain Pricing Power # of Mergers Have Doubled as Hospitals Try to Maintain Pricing Power Over Insurers Fee For Service | Reciprocal Consolidation | Price Variation | Reform Physician Pay | Outcomes Evidence | Summary
  • 39.
    2,400 2,500 2,600 2,700 2,800 2,900 3,000 3,100 2001 2002 20032004 2005 2006 2007 2008 2009 2010 2011 Hospitals Systems Can Negotiate Collectively With Private Health Insurers and Drive Up Prices # of Hospitals in Health Systems, 2001 – 2011 59% of hospitals are in a system Source: Avalere Health analysis of AHA Annual Survey data, 2012 for community hospitals. Individual hospitals are increasingly parts of larger health systems that collectively wield greater negotiating power Fee For Service | Reciprocal Consolidation | Price Variation | Reform Physician Pay | Outcomes Evidence | Summary
  • 40.
    Empirical Studies: HospitalMarket Power Matters Fee For Service | Reciprocal Consolidation | Price Variation | Reform Physician Pay | Outcomes Evidence | Summary
  • 41.
    Driving Up thePrice Per Admission is Critical, Especially When Admissions are Declining Source: S&P Industry Surveys, Healthcare Facilities, 2013. Change in Revenue Per Admission at For-Profit Hospitals Between 2011 and 2012 0.2 0.3 2.4 3.0 4.6 6.1 Universal HCA Tenet Community LifePoint HMA Medicare and Medicaid are not raising prices much (or are dropping them) Health systems are using their enhanced negotiating power to increase revenue per admission Fee For Service | Reciprocal Consolidation | Price Variation | Reform Physician Pay | Outcomes Evidence | Summary
  • 42.
    Source: Research Brief,Center for Studying Health System Change, September 2013. Private Insurer Payments to Hospitals Vary Substantially Both Across and Within Markets Fee For Service | Reciprocal Consolidation | Price Variation | Reform Physician Pay | Outcomes Evidence | Summary
  • 43.
    More Evidence ofPrice Variation Within a Market • Negotiations between providers and insurers result in wildly different prices for the same service at different hospitals • Negotiations also result in wildly different prices for the same service at the same hospital based on the market power of the insurer Fee For Service | Reciprocal Consolidation | Price Variation | Reform Physician Pay | Outcomes Evidence | Summary
  • 44.
    Source: company documentsof publicly traded managed care plans. 4.9% 4.4% 3.8% 3.9% 4.9% 5.8% 6.9% 7.8% 6.6% 7.1% 7.5% 5.6% 5.0% 6.3% 6.5% 0% 1% 2% 3% 4% 5% 6% 7% 8% 9% 10% 1997 1998 1999 2000 2001 2002 2003 2004 2005 2006 2007 2008 2009 2010 2011 MedianOperatingMargins Insurer Profit Actually Increased When They Relaxed Cost Control Measures Median Operating Margins for the 11 Largest Publicly Traded Insurers, 1997–2011 Reciprocally consolidated health markets are more profitable for providers and insurers, but fail to control health costs for patients Fee For Service | Reciprocal Consolidation | Price Variation | Reform Physician Pay | Outcomes Evidence | Summary
  • 45.
    -2 0 2 4 6 8 10 12 14 16 18 90 91 9293 94 95 96 97 98 99 '00 '01 '02 '03 '04 '05 '06 '07 '08 09 10 11 12 13 Source: Kaiser Family Foundation, Employer Health Benefits 2013 Annual Survey. Percent Change Average annual % change in private health insurance premiums 4.0% 13.9% Height of managed care 4 Recent Health Insurance Eras Providers strike back Self-managed care Claims processing Fee For Service | Reciprocal Consolidation | Price Variation | Reform Physician Pay | Outcomes Evidence | Summary
  • 46.
  • 47.
    Reform encourages innovativereimbursement mechanisms for health service providers intended to enhance quality and lower costs The health reform bill created the Centers for Medicare and Medicaid Innovation (CMMI) to fund research and help implement best practices in this rapidly innovating field • Pay for performance • Pay for quality and cost goals • Pay per episode of health care • Pay globally for each patient each year • Pay a yearly salary Many options available to reimburse strategically Fee For Service | Reciprocal Consolidation | Price Variation | Reform Physician Pay | Outcomes Evidence | Summary
  • 48.
    Source: Baicker andLevy, NEJM, August 2013. New Medicare Policies Encourage MDs and Hospitals to Coordinate and Consolidate. Effect on Prices? Fee For Service | Reciprocal Consolidation | Price Variation | Reform Physician Pay | Outcomes Evidence | Summary
  • 49.
    Example of innovativepayment scheme: Medicare Hospital Value-Based Purchasing in the ACA (type of pay for performance program) • Timing – Hospitals are receiving SMALL value-based incentives payments beginning in 2013 for processes of care in certain disease areas. – Hospitals with high (preventable) re-admissions or hospital-acquired infection rates will also receive lower payments. – Physicians penalized for not providing data on quality. • Funding: Program will be funded by reducing base operating DRG payments for hospital discharges. • Measures: clinical process, patient ratings, mortality. Fee For Service | Reciprocal Consolidation | Price Variation | Reform Physician Pay | Outcomes Evidence | Summary
  • 50.
    As Much as6% of a Hospital’s Medicare Payment Will Be at Risk in 2017 Source: Advisory Board, Next-Generation Clinical Integration, 2012. Fee For Service | Reciprocal Consolidation | Price Variation | Reform Physician Pay | Outcomes Evidence | Summary
  • 51.
    Evidence to supportfinancial incentives: utilizing financial incentives and disease management techniques lower costs and improve quality A better health outcome can be achieved at a lower cost by utilizing robust incentive programs for healthcare service providers Through improved management of chronic conditions, insurers have the opportunity to offer the highest quality service at the lowest cost in the market The more robust the incentives the better Quality Score Fee For Service | Reciprocal Consolidation | Price Variation | Reform Physician Pay | Outcomes Evidence | Summary Program with most incentives
  • 52.
    Summary Slide: ChangingIncentives for Providers • Fee For Service payment fails to align payment with goals of prevention and improved health • Health reform encourages restructured financial incentives intended to align goals of quality with financial efficiency • Evidence from demonstration projects show that financial incentive programs can work • Whether or not these incentives will decrease large-scale cost growth in often non-competitive health markets is an open question. Research is ongoing. Fee For Service | Reciprocal Consolidation | Price Variation | Reform Physician Pay | Outcomes Evidence | Summary
  • 53.
    Health Reform Working toimprove patient care - Health infrastructure - Lack of care support systems - Reform incents EHR use - Infrastructure reform - Vertical integration - Summary Insurer Provider (Doctor) Individual
  • 54.
    Hospitals have anincreasingly low average inpatient occupancy rate. Outpatient visits are increasing rapidly. Many health policy professionals argue that our health infrastructure is either overbuilt or that resources are invested inefficiently Health Infrastructure| Lack of Care Support Systems | EHR | Reforming Infrastructure | Vertical Integration | Summary
  • 55.
    “We find compellingevidence that a positive, statistically significant relationship exists between hospital bed availability and inpatient hospitalization rates. Additionally, the observed relationship is invariant with changes in the geographic scale of analysis.” http://www.plosone.org/article/info%3Adoi%2F10.1371%2Fjournal.pone.0054900 Evidence demonstrates that increased hospital bed availability is by itself an incentive for increased health spending
  • 56.
    • Nearly one-fourthof Medicare beneficiaries have five or more chronic conditions. These beneficiaries account for two-thirds of the program’s spending • These patients will have prescriptions from multiple doctors that are not communicating with one another to coordinate care • These beneficiaries are part of the 20% of patients that drive 80% of costs The focus of health reform’s effort to improve patient care focuses on program and infrastructure developments that will facilitate prevention The lack of support systems that facilitate communication between providers hurts patient care and increases costs Health Infrastructure| Lack of Care Support Systems | EHR | Reforming Infrastructure | Vertical Integration | Summary
  • 57.
    • Lack ofcare coordination—such as inefficient communication between providers and lack of access to medical records when specialists intervene—leads to duplication of tests and inappropriate treatments that cost $25 billion to $50 billion annually. • Adverse Drug Events: any injuries resulting from medication use, including physical harm, mental harm, or loss of function – 700,000 emergency department visits and 120,000 hospitalizations are due to ADEs annually – $3.5 billion is spent on extra medical costs of ADEs annually; – At least 40% of costs of ambulatory (non-hospital settings) ADEs are estimated to be preventable • Electronic systems can also be used to order drugs, which is another step that commonly results in errors Source: http://www.cdc.gov/medicationsafety/basics.html Source: http://www.americanprogress.org/issues/2010/03/pdf/health_delivery.pdf Lack of health information systems that support coordinated care harm care quality in a number of ways The lack of systems in place to coordinate care, lower the risk of adverse drug events, and help providers communicate has serious quality and cost consequences Health Infrastructure| Lack of Care Support Systems | EHR | Reforming Infrastructure | Vertical Integration | Summary
  • 58.
  • 59.
    Patient PatientNeeds BestMedical EvidenceAvailable Provider Interoperable Electronic Health Record Health Infrastructure|Lack of Care Support Systems | EHR | Reforming Infrastructure | Vertical Integration | Summary
  • 60.
    • EHRs andother health care IT, "tools can help prevent medical errors and eliminate the duplication of services and tests, saving lives and money," and, "if widely adopted, health IT would have the potential to save more than 250 lives and $452 million daily.“ Electronic Health Records (EHR) have a great deal of potential to help improve quality and reduce costs Health Infrastructure| Lack of Care Support Systems | EHR | Reforming Infrastructure | Vertical Integration | Summary
  • 61.
    • With advancesin technology, hospitals are performing more outpatient procedures intended to keep people from having to check into hospitals for care in the first place. • Changes in insurance reimbursement also have put pressure on hospitals to cut costs and reduce the length of a patient's stay. • As more care shifts to outpatient clinics, rehabilitation services and home health services, hospitals are becoming a smaller and smaller piece of the overall medical system. Health reform’s focus on improved disease management has the potential to impact how the infrastructure of health systems is designed As incentives shift in an attempt to transform our current sick-care system into a true healthcare system, health infrastructure should see a complementary shift to a greater focus on community outpatient treatment facilities rather than hospitals Source: http://www.pressherald.com/business/empty-beds-may-signal-too-many- hospitals_2012-12-17.html?pageType=mobile&id=4 Health Infrastructure| Lack of Care Support Systems | EHR | Reforming Infrastructure | Vertical Integration | Summary
  • 62.
    Health systems acrossthe country are increasingly moving to employ physicians directly Source: Securing Physician Alignment, Advisory Board, 2011. Health systems are vertically integrating by employing providers directly in an effort to align financial incentives with the quality of care Health Infrastructure| Lack of Care Support Systems | EHR | Reforming Infrastructure | Vertical Integration | Summary
  • 63.
    Summary: Provider toPatient • Average hospital inpatient occupancy rate trending in the low 60’s • The health system lacks many support programs that could help coordinate and improve care • Reform incents and funds the creation of systems that improve care • Healthcare infrastructure is seeing a shift towards focusing on outpatient treatment facilities • Health systems are increasingly vertically integrating Health Infrastructure| Lack of Care Support Systems | EHR | Reforming Infrastructure | Vertical Integration | Summary
  • 64.

Editor's Notes

  • #3 You can read this slide to yourselves. We will break this down in detail later, what I’m going to say now is my goal for the presentation
  • #7 Increasing obesity rates and aging of baby boomers will lead to significant increase in chronic disease prevalence (in next decade)
  • #8 The #1 reason for declaration of bankruptcy in US The average annual premium for family coverage amounts to $12,106 in 2007, of which $3,281 is paid by the worker. (The employer picks up the rest.) That is up from $11,480 last year, of which the worker paid $2,973, according to the survey of nearly 2,000 employers. The $12,106 average cost of family coverage this year is roughly equivalent to a year's salary for a full-time worker earning the minimum wage, which is $12,168.
  • #9 Healthcare for current employees added $1528 to the cost of every GM vehicle in 2004, compared to $201 for every Toyota Health care costs add $1,525 to the price tag of every GM car; the company spent $4.6 billion on health care in 2007, more than it paid for steel. Warren Buffet has called GM “a health and benefits company with an auto company attached.”
  • #11 The nation's health dollar, calendar year 2005: where it went. “Physician and Clinical Services” includes offices of physicians, outpatient care centers, and medical and diagnostic laboratories. “Other Spending” includes dentist services, other professional services, home health, durable medical products, over-the-counter medicines and sundries, public health, other personal health care, research, and structures and equipment. Source: Centers for Medicare & Medicaid Services, Office of the Actuary, National Health Statistics Group.
  • #13 Increasing obesity rates and aging of baby boomers will lead to significant increase in chronic disease prevalence (in next decade) Lost productivity is people not working because they’re sick
  • #20 There are way more new rules There are only 2 options to make a system: No mandate and you make it hard for sick people to people buying insurance, or the opposite for those 2 variables Why people attack individual mandate
  • #24 3 healthcare markets per state
  • #25 Subsidies are tied to income levels and the price of the second-lowest cost silvertiered plan available to an individual.
  • #26 Subsidies are tied to income levels and the price of the second-lowest cost silvertiered plan available to an individual.
  • #27 Subsidies are tied to income levels and the price of the second-lowest cost silver tiered plan available to an individual.
  • #32 Lack of Medicaid Expansion Leaves 87% of State's Poor Adults Without Coverage Nola.com Eighty-seven percent of all non-elderly Louisiana adults living in poverty will not have access to government subsidized health insurance in 2014 despite a new national health-care law that was designed to extend coverage to more people.
  • #35 The financial incentive to do more may increase costs
  • #36 Defend your profession: number of services rendered per disease manifestation varies in more ambiguous clinical scenarios where docs don’t know exactly what to do Bash your profession (CT scanners): docs who own their own CT scanners are 3 times more likely to scan a patient than those who don’t http://www.dartmouthatlas.org/data/map.aspx?ind=65&loct=3&ch=32,125 But it is the findings of the Dartmouth Institute for Health Policy and Clinical Practice that have generated the most excitement in the Obama administration, all the way up to the Oval Office. For more than a decade, the New Hampshire researchers have documented and mapped wide variations in the cost and types of care given to American seniors through the Medicare program, concluding that spending more on health care has not resulted in better health. In the final two years of a patient's life, for example, they found that Medicare spent an average of $46,412 per beneficiary nationwide, with the typical patient spending 19.6 days in the hospital, including 5.1 in the intensive-care unit. Green Bay patients cost $33,334 with 14.1 days in the hospital and just 2.1 days in the ICU, while in Miami and Los Angeles, the average cost of care exceeded $71,000, and total hospitalization was about 28 days with 12 in the ICU.
  • #38 http://www.americanprogress.org/issues/2009/06/pdf/health_competitiveness.pdf
  • #44 Will vary by a factor of 3 within a market Will vary by a factor of 3 within a HOSPITAL based on the insurer
  • #52 HEDIS is a quality measure Every insurer is trying to be the low cost player in the market in this capacity. They have luxury packages available, but no one tries to be the expensive health insurer at baseline
  • #56 Old model: hospital focused. Sick care system. Check out Maine’s hospitals
  • #58 Depending on facility size, hospital costs annually for all ADEs are estimated to be as much as $5.6 million per hospital http://www.ahrq.gov/research/findings/factsheets/errors-safety/aderia/index.html#Costs
  • #63 Kicker: VI and outpatient clinics