This document describes the characterization and purification of lactate dehydrogenase (LDH) from bovine myocardium tissue. The authors developed quantitative assays to analyze and purify LDH activity extracted from the tissue. Through a series of fractionation and chromatography steps, including ammonium sulfate fractionation, ion exchange chromatography, and affinity chromatography, the authors were able to purify LDH from the myocardial extract into near homogeneity. They also determined physical and enzymatic characteristics of the purified LDH through assays and SDS-PAGE gel electrophoresis analysis.


![8
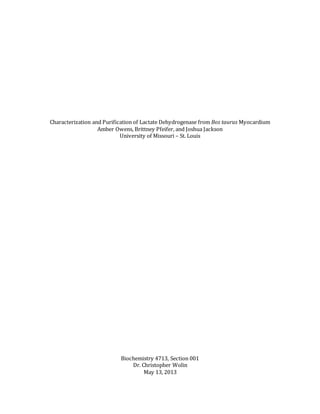
AffinityChromatography
To perform affinity chromatography, the LDH-containing solution that had been previously purified
by IEX was pipetted into a column containing Cibacron Blue matrix pre-equilibrated in 30mM Tris-
Cl, pH 8.5 + 0.2M NaCl. The column valve was then opened and the breakthrough (74ml) was
collectedin a beaker until the sample was just abovethe top of the gel bed. Next, in order to elute
LDH from the column, the columnwas washed with 50ml of 30mM Tris-Cl, pH 8.5 + 0.2M NaCl and
the 0.2M NaCl wash (49.5ml) was also collected in a clean beaker. Finally, the column was washed
with 40ml of 30mM Tris-Cl, pH 8.5 + 1M NaCl (to raise salt concentration) and 5ml fractions were
collectedinto test tubes as the sample was eluted from the column. These fractions were then
assayed forLDH activity and the three fractions containing the highest LDH activity werepooled
(12ml worth)and stored at 4°C for further analysis. The column was then re-equilibrated with
50ml of 30mM Tris-Cl, pH 8.5.
After the affinity chromatography was completed, the IEX sample, Cibacron Blue breakthrough, IEX
pooled 0.2M NaCl sample, and Cibacron Blue pooled 1M NaCl sample were all assayed forLDH
activity and protein concentration.
Characterization of Purified LDH
SodiumDodecyl Sulfate-PolyacrylamideGel Electrophoresis(SDS-PAGE)
To determine how many proteins (and their molecular weights) were in the purified LDH sample,
an SDS-PAGE was run on pure heart-derived LDH, myocardial extract, 65% dialyzed pellet, .2M
NaCl eluted IEX pooled sample, and 1M NaCl eluted Cibacron Blue pooled sample as follows.First,
20l samples were made containing 38μg of protein fromeach solution (all samples were diluted to
20l with diH2O). Next, 80μl of acetone and 4μl of 6X SDS sample buffer [125mM Tris-Cl, pH 6.8,
4%(wt/vol)SDS 20%(vol/vol)Glycerol,.02%(wt/vol)bromophenolblue, and 5% b-
mercaptoethanol] were added to each tube. The tubes were then spun in a microfuge at maximum
speed for a minute to make a protein pellet at the bottom of the tube. After that, the tubes were
heated for5 minutes at 90°C to evaporate any liquid that remained. The tubes were then cooledon
ice fora few minutes before being spun again for a minute. The samples were then put on ice until
they were ready to be utilized in the SDS-PAGE.
The SDS-PAGE was prepared in 1X running buffer. The wells were loaded with 15μl aliquots of
each sample as follows:
1: Molecular Weight Marker
2: Pure Heart-derived LDH
3: 38μg MyocardialExtract solution
4: 38μg 65% DialyzedPellet solution
5: 38μg .2M NaCl eluted IEX pooled solution
6: 38μg 1M NaCl eluted Cibacron Blue pooled solution
The gel was then leftto run fora little over an hour until the dye reached the bottom of the gel.
Once the gel was finished running, it was developed using the SilverSNAP Satin Kit II. After the gel
was stained, band distances were measured and a standard curve was derived from the molecular
weight markers. Using the standard curve,the molecular weight of the most purified band was
determined and compared to the theoretical weight of LDH to ensure that the correctprotein had
been purified.](https://image.slidesharecdn.com/6d4e440a-b42c-4da6-bef4-f73951d83799-150827002120-lva1-app6891/85/ABJ-Biochemistry-Manuscript-8-320.jpg)

![12
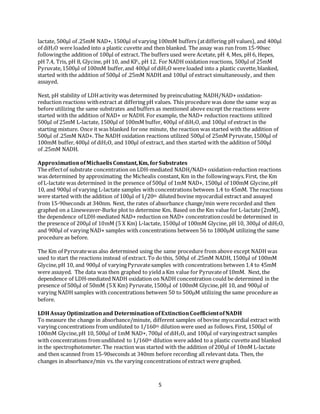
Figure6.
Figure7.
y = 18.881x + 10.232
R² = 0.9871
0.0
5.0
10.0
15.0
20.0
25.0
0.000 0.100 0.200 0.300 0.400 0.500 0.600 0.700 0.800
1/v,(Abs340nm/min)-1
1/[L-lactate] (mM-1)
Lineweaver-Burke Plot for 1mM NAD+-
Dependence on 2mM L-lactate
y = 2,355.3x + 10.8
R² = 1.0
0.0
10.0
20.0
30.0
40.0
50.0
60.0
0.0000 0.0020 0.0040 0.0060 0.0080 0.0100 0.0120 0.0140 0.0160 0.0180 0.0200
1/v,(Abs340nm/min)-1
1/[NAD+] (M-1)
Lineweaver-Burke Plot for 1mM NAD+-
Dependence on 10mM L-lactate](https://image.slidesharecdn.com/6d4e440a-b42c-4da6-bef4-f73951d83799-150827002120-lva1-app6891/85/ABJ-Biochemistry-Manuscript-12-320.jpg)
![13
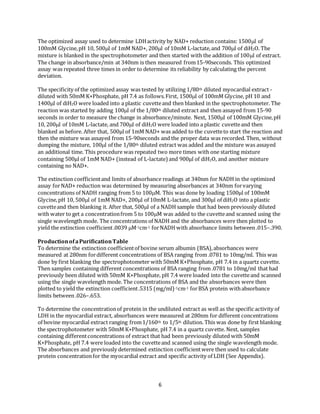
Figure8.
Figure9.
LDHAssayOptimizationand Determination ofExtinctionCoefficientofNADH
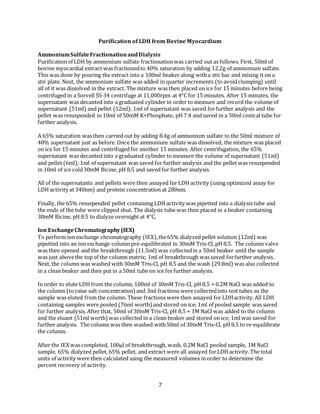
First, differentconcentrations (from undiluted to 1/160 diluted) of bovinemyocardial extract were
used to find the absorbance change/minute. The changes in absorbance/min vs. the concentration
of extract are graphed in Figure 10. The hyperbolic curveindicates the non-linear nature of the
assay, whichmeans it does not obey the Beer-Lambert law. However,the inner graph is linear and
tells us that the limits of the absorbance values/minute of all future assays must be between 0.015-
0.390.
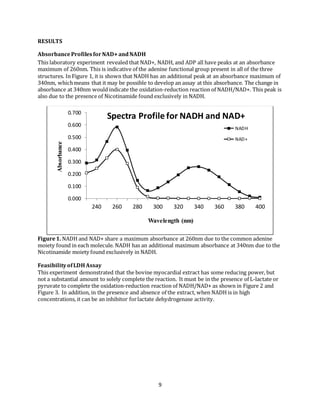
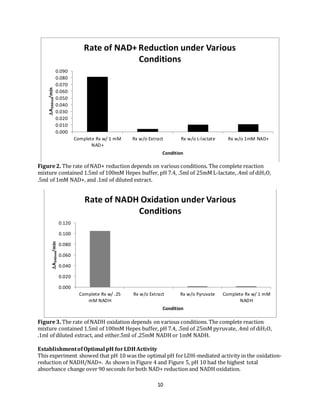
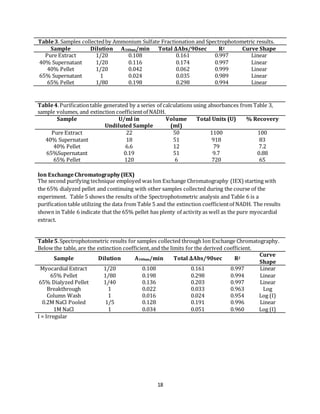
In testing the feasibility of the LDHassay, it was shown in Figure 2 and Figure 3 that there was an
increase in absorbance when extract and either L-lactateor pyruvate was present at 340nm. This
was retested at the optimal conditions to see whether LDH-dependent absorbances should be
considered when determining enzymatic activity during the purification process. The specificity of
the optimized assay was retested using 1/80th diluted extract under optimal conditions to see
y = 51.8x + 7.8
R² = 1.0
0.0
10.0
20.0
30.0
40.0
50.0
0.000 0.100 0.200 0.300 0.400 0.500 0.600 0.700 0.800
1/v,(Abs340nm/min)-1
1/[Pyruvate] (mM-1)
Lineweaver-Burke Plot for .25mM NADH-
Dependence on 6mM Pyruvate
y = 9,334.5x - 11.9
R² = 1.0
0.0
20.0
40.0
60.0
80.0
100.0
0.000 0.002 0.004 0.006 0.008 0.010 0.012
1/v,(Abs340nm/min)-1
1/[NADH] (M-1)
Lineweaver-Burke Plot for .25mM NADH-
Dependence on 50 mM Pyruvate](https://image.slidesharecdn.com/6d4e440a-b42c-4da6-bef4-f73951d83799-150827002120-lva1-app6891/85/ABJ-Biochemistry-Manuscript-13-320.jpg)
![14
whether anything is limited by complete optimization. As shown in Figure 11, the complete reaction
had the highest absorbance, whichindicates that reactions withoutextract wouldresult in very low
or non-present absorbances. Optimization is a limiting factorwhen it comes to non-specificity.
The reliability of the optimized assay was also tested by performing triplicates of the assay
containing 1/80th diluted extract, as shown in Table 1, in order to determine a percent deviation.
The overall percent deviation was 2.23%, with an average value of 0.0403 +/- 0.00087/min. The
percent deviation is acceptable because it is within the 5% error acceptability for reliability.
The relationship between the concentration of NADH and the absorbance at 340nm is shown in
Figure 12. Utilizing the slope of this graph, the extinction coefficient() .0039M-1cm-1, forNADH
was determined.
Figure10.
0
0.1
0.2
0.3
0.4
0.5
0.6
0 0.2 0.4 0.6 0.8 1 1.2
Abs340nm/min
[Extract], Fraction of Original
Concentration of Extract vs. The Rate of
Reaction
y = 2.9854x + 0.0076
R² = 0.9996
0
0.02
0.04
0.06
0.08
0.1
0 0.01 0.02 0.03](https://image.slidesharecdn.com/6d4e440a-b42c-4da6-bef4-f73951d83799-150827002120-lva1-app6891/85/ABJ-Biochemistry-Manuscript-14-320.jpg)
![15
Figure11. The optimized assay was tested for specificity under varying conditions. The complete
optimized assay reaction mixture contained 1.5ml of 100mM Glycine, pH 10, .2ml of 10mM L-
lactate, .7ml of diH2O, .5ml of 1mM NAD+, and .1ml of 1/80th diluted extract.
Table1. This data represents the reproducibility and error tested using 1/80th diluted extract.
The assay was repeated three times in order to make sure the percent and standard deviations
were reasonable.
Trial
Number
Rate of Absorbance
Change A340/min
Total Absorbance
Change over 90 secs.
Pearson's
Coefficient
(R2)
Curve Shape
1 0.041 0.061 0.99 Linear, slight noise
2 0.039 0.059 0.995 Linear, slight noise
3 0.041 0.061 0.99 Linear, slight noise
0.000
0.005
0.010
0.015
0.020
0.025
0.030
0.035
0.040
0.045
0.050
A340nm/min
Testing Optimized Assay for Specificity
y = 0.0039x - 0.0028
R² = 0.9994
0.000
0.050
0.100
0.150
0.200
0.250
0.300
0.350
0.400
0.450
0 20 40 60 80 100 120
TotalAbsorbanceat340nm
[NADH], M
Determination of Extinction Coefficient of
NADH in Optimized Assay](https://image.slidesharecdn.com/6d4e440a-b42c-4da6-bef4-f73951d83799-150827002120-lva1-app6891/85/ABJ-Biochemistry-Manuscript-15-320.jpg)
![16
Figure12. The extinction coefficientforNADH is .0039 M-1cm-1 withabsorbance limits
between .015–.390.
ProductionofaPurificationTable
Determination of protein concentration was done multiple ways. First, absorbances were measured
at 280nm for varying concentrations of Bovine Serum Albumin (BSA) protein. The concentrations
and absorbance readings that did not obey the Beer-Lambert law were excluded from the data. The
relationship between the final concentration of BSA and absorbance at 280nm is shown in Figure
13. As the final concentrationof BSA (mg/ml) increases, so does the absorbance. Utilizing the slope
of this graph, the extinction coefficient(),0.5315(mg/ml)-1cm-1 forBSA was determined.
Next, the concentration of protein in the undiluted extract was determined along with the specific
activity of LDH by measuring absorbances at 280nm fordifferent dilutions of extract, whichis
shown in Figure 14.
Finally, all of the values obtained during the course of the experiment were utilized to complete a
purification table, Table 2.
Figure13. The extinction coefficientforBSA protein is .5315 (mg/ml)-1cm-1 with absorbance limits
between .026–.653.
y = 0.5315x - 0.0081
R² = 0.9996
0.000
0.100
0.200
0.300
0.400
0.500
0.600
0.700
0 0.2 0.4 0.6 0.8 1 1.2 1.4
Absorbanceat280nm
Final [BSA], (mg/mL)
Determination of Extinction Coefficient of
BSA Protein in 50mM K+Phosphate, pH 7.4](https://image.slidesharecdn.com/6d4e440a-b42c-4da6-bef4-f73951d83799-150827002120-lva1-app6891/85/ABJ-Biochemistry-Manuscript-16-320.jpg)

![19
Table6.Purificationtable generated by a series of calculations using absorbance values from Table
5, sample volumes, and extinction coefficientof NADH.
Sample
U/ml in
Undiluted Sample
Volume
(mL)
Total Units
(U)
% Recovery
Myocardial Extract 22 50 1100 100
65% Pellet 120 6 732 67
65% Dialyzed Pellet 42 12 500 45
Column Breakthrough 0.17 11.5 2 0.18
Column Wash 0.12 29.8 4 0.36
0.2M NaCl Pooled 4.9 76 370 34
1M NaCl 0.26 51 13 1.2
AffinityChromatography
The final purifying technique employed was Affinity Chromatography. This form of
chromatography uses a substrate analog, in this case, a dye called Cibacron Blue, to bind to the
enzyme. The Cibacron Blue binds to NAD+, and then NADH is removed before LDH activity is
determined for the samples. After running LDH and protein assays on each sample, the values in
Table 7 couldbe calculated. The results from Table 7 indicate that the 65% Pellet, the Cibacron Blue
1M NaCl Pooledand 0.2M Pooledsamples have the highest fold purifications of Lactate
Dehydrogenase activity.
Table7.Purificationtable forsamples generated from Affinity Chromatography.
Sample
U/ml in
Undiluted
Sample
[Protein]
(mg/ml)
Specific
Activity
(U/mg)
Fold
Purification
% Recovery
Myocardial
Extract
22 72 0.31 1 100
65% Pellet 120 44 2.9 9.4 67
65% Dialyzed
Pellet
42 31 1.4 4.5 45
IEX Pooled 3.1 2.3 1.3 4.2 21
Cibacron
Breakthrough
0.2 0.85 0.24 0.77 1.4
Cibacron
Wash/0.2M NaCl
1.1 0.25 4.4 14 5
Cibacron 1M
NaCl Pooled
4.5 2 2.3 7.4 5
CharacterizationofPurifiedLDH
SodiumDodecyl Sulfate-PolyacrylamideGel Electrophoresis(SDS-PAGE)
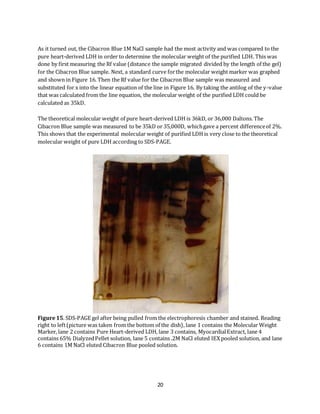
In order to characterizethe purified LDH, a Sodium DodecylSulfate PolyacrylamideGel
Electrophoresis (SDS-PAGE)was generated as shown in Figure 15. By utilizing the SDS-PAGE,the
molecular weight of the polypeptide present in the enzymatic activity could be determined.](https://image.slidesharecdn.com/6d4e440a-b42c-4da6-bef4-f73951d83799-150827002120-lva1-app6891/85/ABJ-Biochemistry-Manuscript-19-320.jpg)

![23
APPENDIX
SampleCalculationforthe65% DialyzedPelletshowninTables6and7
(Abs/min)/ (M-1cm-1)(Lcm)=(.136/min)/(.0039M-1cm-1)(1cm) = 35M/min
(M/min)(Rx volume in L)= (35M/min)(.003L) = .11mol/min=.11 U
U/(volumeof extract in ml) = .11 U/.1ml = 1.05U/mL
(U/ml)(DilutionFactor)= (1.05U/ml)(40) = 42U/mL
(U/ml in undiluted extract)(Volume of extract in ml) = (42 U/ml)(12 ml) = 500 U
% Recovery of LDHActivity = (Total Units in Sample/Total Units of Extract) x 100 = 500/1100 =
45%
[Protein] = Abs/((mg/ml)-1cm-1)(Lcm) =.208/(.5315mg/ml-1cm-1)(1cm)(80) = 31mg/ml
Specific Activity = (U/ml in Undiluted Sample)/[Protein] = (42 U/ml)/(31 mg/ml) = 1.4 U/mg
Fold Purification= (Specific Activity of Sample)/(Specific Activity of Extract) = (1.4 U/mg)/(.31
U/mg) = 4.5](https://image.slidesharecdn.com/6d4e440a-b42c-4da6-bef4-f73951d83799-150827002120-lva1-app6891/85/ABJ-Biochemistry-Manuscript-23-320.jpg)


