Download to read offline

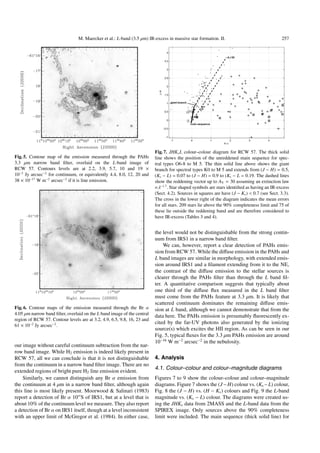

This document summarizes a survey of the massive star forming region RCW 57 (NGC 3576) using JHKs and L-band (3.5 μm) infrared data. Over 50% of the sources detected showed infrared excess emission, indicating the presence of circumstellar disks. Comparison to other regions supported a very high initial disk fraction (>80%) around massive stars, though disks may dissipate faster around high-mass stars. 33 sources only detected at L-band indicated heavily embedded, massive Class I protostars. Diffuse polycyclic aromatic hydrocarbon emission was also detected throughout the region.


