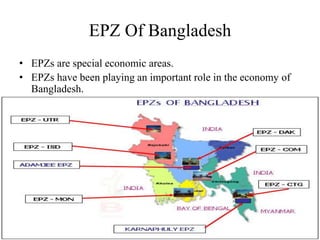
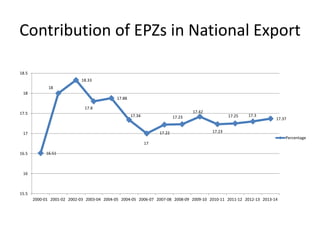
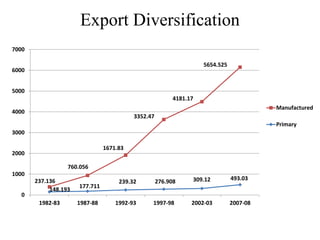
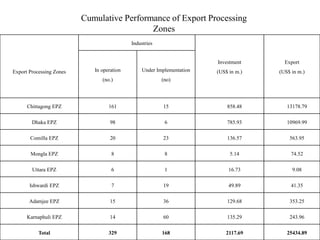
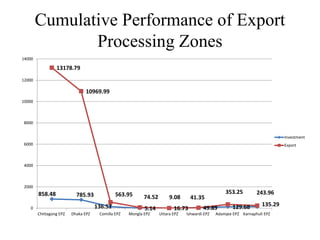
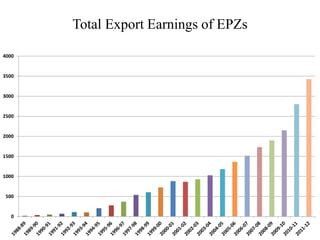
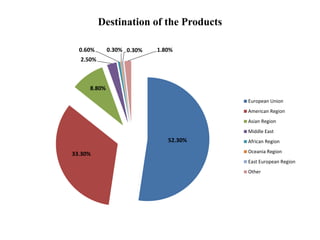
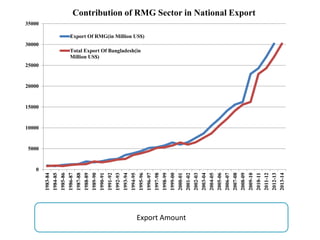
An analysis of the Export
Performance of Bangladesh
A Study Based on the Export
Processing Zones
Export promotion has always been a major
concern for Bangladesh.
Numerous steps have been taken over the years
to attract FDI.
Foreign Private Investment Act was enacted in
1980.
BEPZA Act was enacted in 1980.
Bangladesh started The EPZ Program in 1983.
EPZ Have been Key to the rapid rise of exports.
Average growth of export has been 23%.
Objectives
• To analyze the export performance of
Bangladesh Export processing zones.
• To analyze export diversification.
• To Analyze export performance of RMG sector
of Bangladesh.
Research design
• This is not a fundamental research.
• Data's were collected from various sources.
• Data have been extracted, systemized,
investigated and interpreted in this paper with
proper reasoning.
Data Sources
• The Board of Investment (BOI).
• Bangladesh Export Processing Zones
Authority(BEPZA).
• The Ministry of commerce (MOC) of
Bangladesh.
• Bangladesh Bureau of statistics.
• Bangladesh export of statistics.
• Bangladesh Export Promotion Bureau.
Limitations
• Lack of time.
• Limited availability and access to data.
• Personal barriers such as inability to
understand certain terms created some
problems.
EPZ Of Bangladesh
• EPZs are special economic areas.
• EPZs have been playing an important role in the economy of
Bangladesh.
Mode of Investments in EPZs
8.2
1.8
2.4
Type A
Type B
Type C
Total Investment in EPZS
• The total investment in EPZs is 3057.11 million.
0
50
100
150
200
250
300
350
400
450
0
5000
10000
15000
20000
25000
30000
35000
40000
2000-01 2001-02 2002-03 2003-04 2004-05 2004-05 2006-07 2007-08 2008-09 2009-10 2010-11 2011-12 2012-13 2013-14
Total Export of Bangladesh
(US$m)
Total Export of EPZs
(US$m)
Contribution of EPZs in National Export
16.51
18
18.33
17.8
17.88
17.34
17
17.22
17.23
17.42
17.23
17.25 17.3
17.37
15.5
16
16.5
17
17.5
18
18.5
2000-01 2001-02 2002-03 2003-04 2004-05 2004-05 2006-07 2007-08 2008-09 2009-10 2010-11 2011-12 2012-13 2013-14
Percentage
Crude Fertilizer
Agricultural Products
Raw Jute
Tea
Frozen Food
Animal Casings
Leather
RMG
Jute Goods
Chemical Products
Petroleum by Products
Paper & Allied Products
Engineering Products
Primary Commodities Manufacture Commodities
Export Diversification
148.193
177.711
239.32 276.908 309.12 493.03237.136
760.056
1671.83
3352.47
4181.17
5654.525
0
1000
2000
3000
4000
5000
6000
7000
1982-83 1987-88 1992-93 1997-98 2002-03 2007-08
Manufactured
Primary
PRODUCT UNIT
INVESTMENT
(US$ m)
EXPORT
US$
GARMENTS 58 343.461 1016.64
TEXTILE 28 305.245 476.18
TERRY TOWEL 16 39.886 57.83
KNIT & OTHER TEXTILE 25 124.268 213.41
GARMENTS ACCS. 32 142.008 201.65
CAPS 6 42.421 112.42
TENT 5 23.869 59.67
ELEC & ELECTRONICS 16 54.359 52.18
FOOTWARE & LEATHER 12 57.830 54.94
PLASTIC GOODS 14 22.052 15.88
PAPER PRODUCT 2 0.837 0.94
ROPE 2 6.134 5.64
MISCELLANEOUS 23 36.524 12.78
Gr. Total 264 1262.16 2322.63
Export Earning By Different Sector
0
200
400
600
800
1000
1200
1400
1600
Export
Investment
Major Exported Products
46.53
28.25
5.13
3.24
2.78
1.59
1.05 0.21
11.22
Woven Garments
Knitwear
Frozen Food
Jute Products
Leather
Chemical Products
Raw Jute
Tea
Other
Cumulative Performance of Export Processing
Zones
Export Processing Zones
Industries
Investment
(US$ in m.)
Export
(US$ in m.)In operation
(no.)
Under Implementation
(no)
Chittagong EPZ 161 15 858.48 13178.79
Dhaka EPZ 98 6 785.93 10969.99
Comilla EPZ 20 23 136.57 563.95
Mongla EPZ 8 8 5.14 74.52
Uttara EPZ 6 1 16.73 9.08
Ishwardi EPZ 7 19 49.89 41.35
Adamjee EPZ 15 36 129.68 353.25
Karnaphuli EPZ 14 60 135.29 243.96
Total 329 168 2117.69 25434.89
Cumulative Performance of Export
Processing Zones
858.48 785.93
136.57 5.14 16.73 49.89 129.68 135.29
13178.79
10969.99
563.95 74.52 9.08 41.35
353.25 243.96
0
2000
4000
6000
8000
10000
12000
14000
Chittagong EPZ Dhaka EPZ Comilla EPZ Mongla EPZ Uttara EPZ Ishwardi EPZ Adamjee EPZ Karnaphuli EPZ
Investment
Export
Total Export Earnings of EPZs
0
500
1000
1500
2000
2500
3000
3500
4000
Destination of the Products
52.30%
33.30%
8.80%
2.50%
0.60% 0.30% 0.30% 1.80%
European Union
American Region
Asian Region
Middle East
African Region
Oceania Region
East European Region
Other
RMG Sector In Bangladesh
• RMG industry is the main source of foreign
earnings.
• 81% of export earning came from this industry.
• After 1990 it experienced exponential growth.
• This industry grew by more then 15% per annum.
• RMG sector replaced the tradition market.
• RMG industry injected dynamism in the export
sector.
Possibilities of the Garment Industries
• As a Least Development Country (LDC) Bangladesh has duty
free access to global market for garment products.
• Bangladeshi garment products are being exported different
countries.
• Bangladeshi garment industry is very much capable to ensure
proper quality of the product.
• Bangladeshi garment sector labor cost is comparatively cheap.
Contribution of RMG Sector in National Export
0
5000
10000
15000
20000
25000
30000
35000
1983-84
1984-85
1985-86
1986-87
1987-88
1988-89
1989-90
1990-91
1991-92
1992-93
1993-94
1994-95
1995-96
1996-97
1997-98
1998-99
1999-00
2000-01
2001-02
2002-03
2003-04
2004-05
2005-06
2006-07
2007-08
2008-09
2009-10
2010-11
2011-12
2012-13
2013-14
Export Of RMG(in Million US$)
Total Export Of Bangladesh(in
Million US$)
Export Amount
Contribution of RMG Sector in
National Export
75.14
76.57
75.01
74.79
74.15
75.06
75.64
75.83
79.33
77.12
78.15
78.6
79.61
81.13
70
72
74
76
78
80
82
2000-01 2001-02 2002-03 2003-04 2004-05 2005-06 2006-07 2007-08 2008-09 2009-10 2010-11 2011-12 2012-13 2013-14
Percentage
Value of Total Apparel Export
0
5000
10000
15000
20000
25000
Product Diversification
• The growth pattern of RMG exports can be
categorized into two distinct phases.
• During the initial phase it was the woven category
• Second phase is the emergence of knitwear products
• The entrepreneurs of the RMG sector have been able
to diversify the products.
• The value addition accrues mostly in the designer
items.
Growth of Major exported Products of
RMG sector
0
2000
4000
6000
8000
10000
12000
14000
Woven Knit
Major Destinations of RMG Export
49.77
33.67
16.57
EU
USA
Others
Regional Export Market Share
Major Destinations of RMG Export
0
500
1000
1500
2000
2500
3000
2009-10
2013-2014
Bangladesh RMG Export Scenario to
Targeted Countries
• Bangladesh targeted several potential countries to
export more RMG products.
• Despite the global recession the targeted countries
have experienced high growth rate.
• The recent trade experiences show a positive outlook
about Bangladesh’s possibility into the markets.
• The overall export performance of Bangladesh apparel
in these targeted markets has been significant over the
last ten years.
Problems of Ready Made Garment
Industries of Bangladesh
• Low wage of the workers
• Employees of garment industries are not well
trained.
• Lack of power supply.
• Unstable political situation hampers production.
• Bangladeshi garment owners do not have
developed technology.
• Promotion departments of garment industries
are not active.
• Government policies are not favorable.
Overcoming the challenges
• Development of local supply chain
• Development of infrastructure
• Separate zone for garments industry
• Low bank interest rate
• Sustainable energy supply
• Increase in the number of training center
Conclusion
• Bangladesh has develop its economy over the
years.
• Bangladesh is committed to attract foreign
invertors.
• Bangladesh has shown positive growth in
exports despite the global financial crisis.
• It has huge potential in the export sector.

A study based on the export processing zones

  • 1.
    An analysis ofthe Export Performance of Bangladesh A Study Based on the Export Processing Zones
  • 2.
    Export promotion hasalways been a major concern for Bangladesh. Numerous steps have been taken over the years to attract FDI. Foreign Private Investment Act was enacted in 1980. BEPZA Act was enacted in 1980. Bangladesh started The EPZ Program in 1983. EPZ Have been Key to the rapid rise of exports. Average growth of export has been 23%.
  • 3.
    Objectives • To analyzethe export performance of Bangladesh Export processing zones. • To analyze export diversification. • To Analyze export performance of RMG sector of Bangladesh.
  • 4.
    Research design • Thisis not a fundamental research. • Data's were collected from various sources. • Data have been extracted, systemized, investigated and interpreted in this paper with proper reasoning.
  • 5.
    Data Sources • TheBoard of Investment (BOI). • Bangladesh Export Processing Zones Authority(BEPZA). • The Ministry of commerce (MOC) of Bangladesh. • Bangladesh Bureau of statistics. • Bangladesh export of statistics. • Bangladesh Export Promotion Bureau.
  • 6.
    Limitations • Lack oftime. • Limited availability and access to data. • Personal barriers such as inability to understand certain terms created some problems.
  • 7.
    EPZ Of Bangladesh •EPZs are special economic areas. • EPZs have been playing an important role in the economy of Bangladesh.
  • 8.
    Mode of Investmentsin EPZs 8.2 1.8 2.4 Type A Type B Type C
  • 9.
    Total Investment inEPZS • The total investment in EPZs is 3057.11 million. 0 50 100 150 200 250 300 350 400 450
  • 10.
    0 5000 10000 15000 20000 25000 30000 35000 40000 2000-01 2001-02 2002-032003-04 2004-05 2004-05 2006-07 2007-08 2008-09 2009-10 2010-11 2011-12 2012-13 2013-14 Total Export of Bangladesh (US$m) Total Export of EPZs (US$m) Contribution of EPZs in National Export
  • 11.
    Contribution of EPZsin National Export 16.51 18 18.33 17.8 17.88 17.34 17 17.22 17.23 17.42 17.23 17.25 17.3 17.37 15.5 16 16.5 17 17.5 18 18.5 2000-01 2001-02 2002-03 2003-04 2004-05 2004-05 2006-07 2007-08 2008-09 2009-10 2010-11 2011-12 2012-13 2013-14 Percentage
  • 12.
    Crude Fertilizer Agricultural Products RawJute Tea Frozen Food Animal Casings Leather RMG Jute Goods Chemical Products Petroleum by Products Paper & Allied Products Engineering Products Primary Commodities Manufacture Commodities Export Diversification
  • 13.
    Export Diversification 148.193 177.711 239.32 276.908309.12 493.03237.136 760.056 1671.83 3352.47 4181.17 5654.525 0 1000 2000 3000 4000 5000 6000 7000 1982-83 1987-88 1992-93 1997-98 2002-03 2007-08 Manufactured Primary
  • 14.
    PRODUCT UNIT INVESTMENT (US$ m) EXPORT US$ GARMENTS58 343.461 1016.64 TEXTILE 28 305.245 476.18 TERRY TOWEL 16 39.886 57.83 KNIT & OTHER TEXTILE 25 124.268 213.41 GARMENTS ACCS. 32 142.008 201.65 CAPS 6 42.421 112.42 TENT 5 23.869 59.67 ELEC & ELECTRONICS 16 54.359 52.18 FOOTWARE & LEATHER 12 57.830 54.94 PLASTIC GOODS 14 22.052 15.88 PAPER PRODUCT 2 0.837 0.94 ROPE 2 6.134 5.64 MISCELLANEOUS 23 36.524 12.78 Gr. Total 264 1262.16 2322.63 Export Earning By Different Sector
  • 15.
    Export Earning ByDifferent Sector 0 200 400 600 800 1000 1200 1400 1600 Export Investment
  • 16.
    Major Exported Products 46.53 28.25 5.13 3.24 2.78 1.59 1.050.21 11.22 Woven Garments Knitwear Frozen Food Jute Products Leather Chemical Products Raw Jute Tea Other
  • 17.
    Cumulative Performance ofExport Processing Zones Export Processing Zones Industries Investment (US$ in m.) Export (US$ in m.)In operation (no.) Under Implementation (no) Chittagong EPZ 161 15 858.48 13178.79 Dhaka EPZ 98 6 785.93 10969.99 Comilla EPZ 20 23 136.57 563.95 Mongla EPZ 8 8 5.14 74.52 Uttara EPZ 6 1 16.73 9.08 Ishwardi EPZ 7 19 49.89 41.35 Adamjee EPZ 15 36 129.68 353.25 Karnaphuli EPZ 14 60 135.29 243.96 Total 329 168 2117.69 25434.89
  • 18.
    Cumulative Performance ofExport Processing Zones 858.48 785.93 136.57 5.14 16.73 49.89 129.68 135.29 13178.79 10969.99 563.95 74.52 9.08 41.35 353.25 243.96 0 2000 4000 6000 8000 10000 12000 14000 Chittagong EPZ Dhaka EPZ Comilla EPZ Mongla EPZ Uttara EPZ Ishwardi EPZ Adamjee EPZ Karnaphuli EPZ Investment Export
  • 19.
    Total Export Earningsof EPZs 0 500 1000 1500 2000 2500 3000 3500 4000
  • 20.
    Destination of theProducts 52.30% 33.30% 8.80% 2.50% 0.60% 0.30% 0.30% 1.80% European Union American Region Asian Region Middle East African Region Oceania Region East European Region Other
  • 21.
    RMG Sector InBangladesh • RMG industry is the main source of foreign earnings. • 81% of export earning came from this industry. • After 1990 it experienced exponential growth. • This industry grew by more then 15% per annum. • RMG sector replaced the tradition market. • RMG industry injected dynamism in the export sector.
  • 22.
    Possibilities of theGarment Industries • As a Least Development Country (LDC) Bangladesh has duty free access to global market for garment products. • Bangladeshi garment products are being exported different countries. • Bangladeshi garment industry is very much capable to ensure proper quality of the product. • Bangladeshi garment sector labor cost is comparatively cheap.
  • 23.
    Contribution of RMGSector in National Export 0 5000 10000 15000 20000 25000 30000 35000 1983-84 1984-85 1985-86 1986-87 1987-88 1988-89 1989-90 1990-91 1991-92 1992-93 1993-94 1994-95 1995-96 1996-97 1997-98 1998-99 1999-00 2000-01 2001-02 2002-03 2003-04 2004-05 2005-06 2006-07 2007-08 2008-09 2009-10 2010-11 2011-12 2012-13 2013-14 Export Of RMG(in Million US$) Total Export Of Bangladesh(in Million US$) Export Amount
  • 24.
    Contribution of RMGSector in National Export 75.14 76.57 75.01 74.79 74.15 75.06 75.64 75.83 79.33 77.12 78.15 78.6 79.61 81.13 70 72 74 76 78 80 82 2000-01 2001-02 2002-03 2003-04 2004-05 2005-06 2006-07 2007-08 2008-09 2009-10 2010-11 2011-12 2012-13 2013-14 Percentage
  • 25.
    Value of TotalApparel Export 0 5000 10000 15000 20000 25000
  • 26.
    Product Diversification • Thegrowth pattern of RMG exports can be categorized into two distinct phases. • During the initial phase it was the woven category • Second phase is the emergence of knitwear products • The entrepreneurs of the RMG sector have been able to diversify the products. • The value addition accrues mostly in the designer items.
  • 27.
    Growth of Majorexported Products of RMG sector 0 2000 4000 6000 8000 10000 12000 14000 Woven Knit
  • 28.
    Major Destinations ofRMG Export 49.77 33.67 16.57 EU USA Others Regional Export Market Share
  • 29.
    Major Destinations ofRMG Export 0 500 1000 1500 2000 2500 3000 2009-10 2013-2014
  • 30.
    Bangladesh RMG ExportScenario to Targeted Countries • Bangladesh targeted several potential countries to export more RMG products. • Despite the global recession the targeted countries have experienced high growth rate. • The recent trade experiences show a positive outlook about Bangladesh’s possibility into the markets. • The overall export performance of Bangladesh apparel in these targeted markets has been significant over the last ten years.
  • 31.
    Problems of ReadyMade Garment Industries of Bangladesh • Low wage of the workers • Employees of garment industries are not well trained. • Lack of power supply. • Unstable political situation hampers production. • Bangladeshi garment owners do not have developed technology. • Promotion departments of garment industries are not active. • Government policies are not favorable.
  • 32.
    Overcoming the challenges •Development of local supply chain • Development of infrastructure • Separate zone for garments industry • Low bank interest rate • Sustainable energy supply • Increase in the number of training center
  • 33.
    Conclusion • Bangladesh hasdevelop its economy over the years. • Bangladesh is committed to attract foreign invertors. • Bangladesh has shown positive growth in exports despite the global financial crisis. • It has huge potential in the export sector.