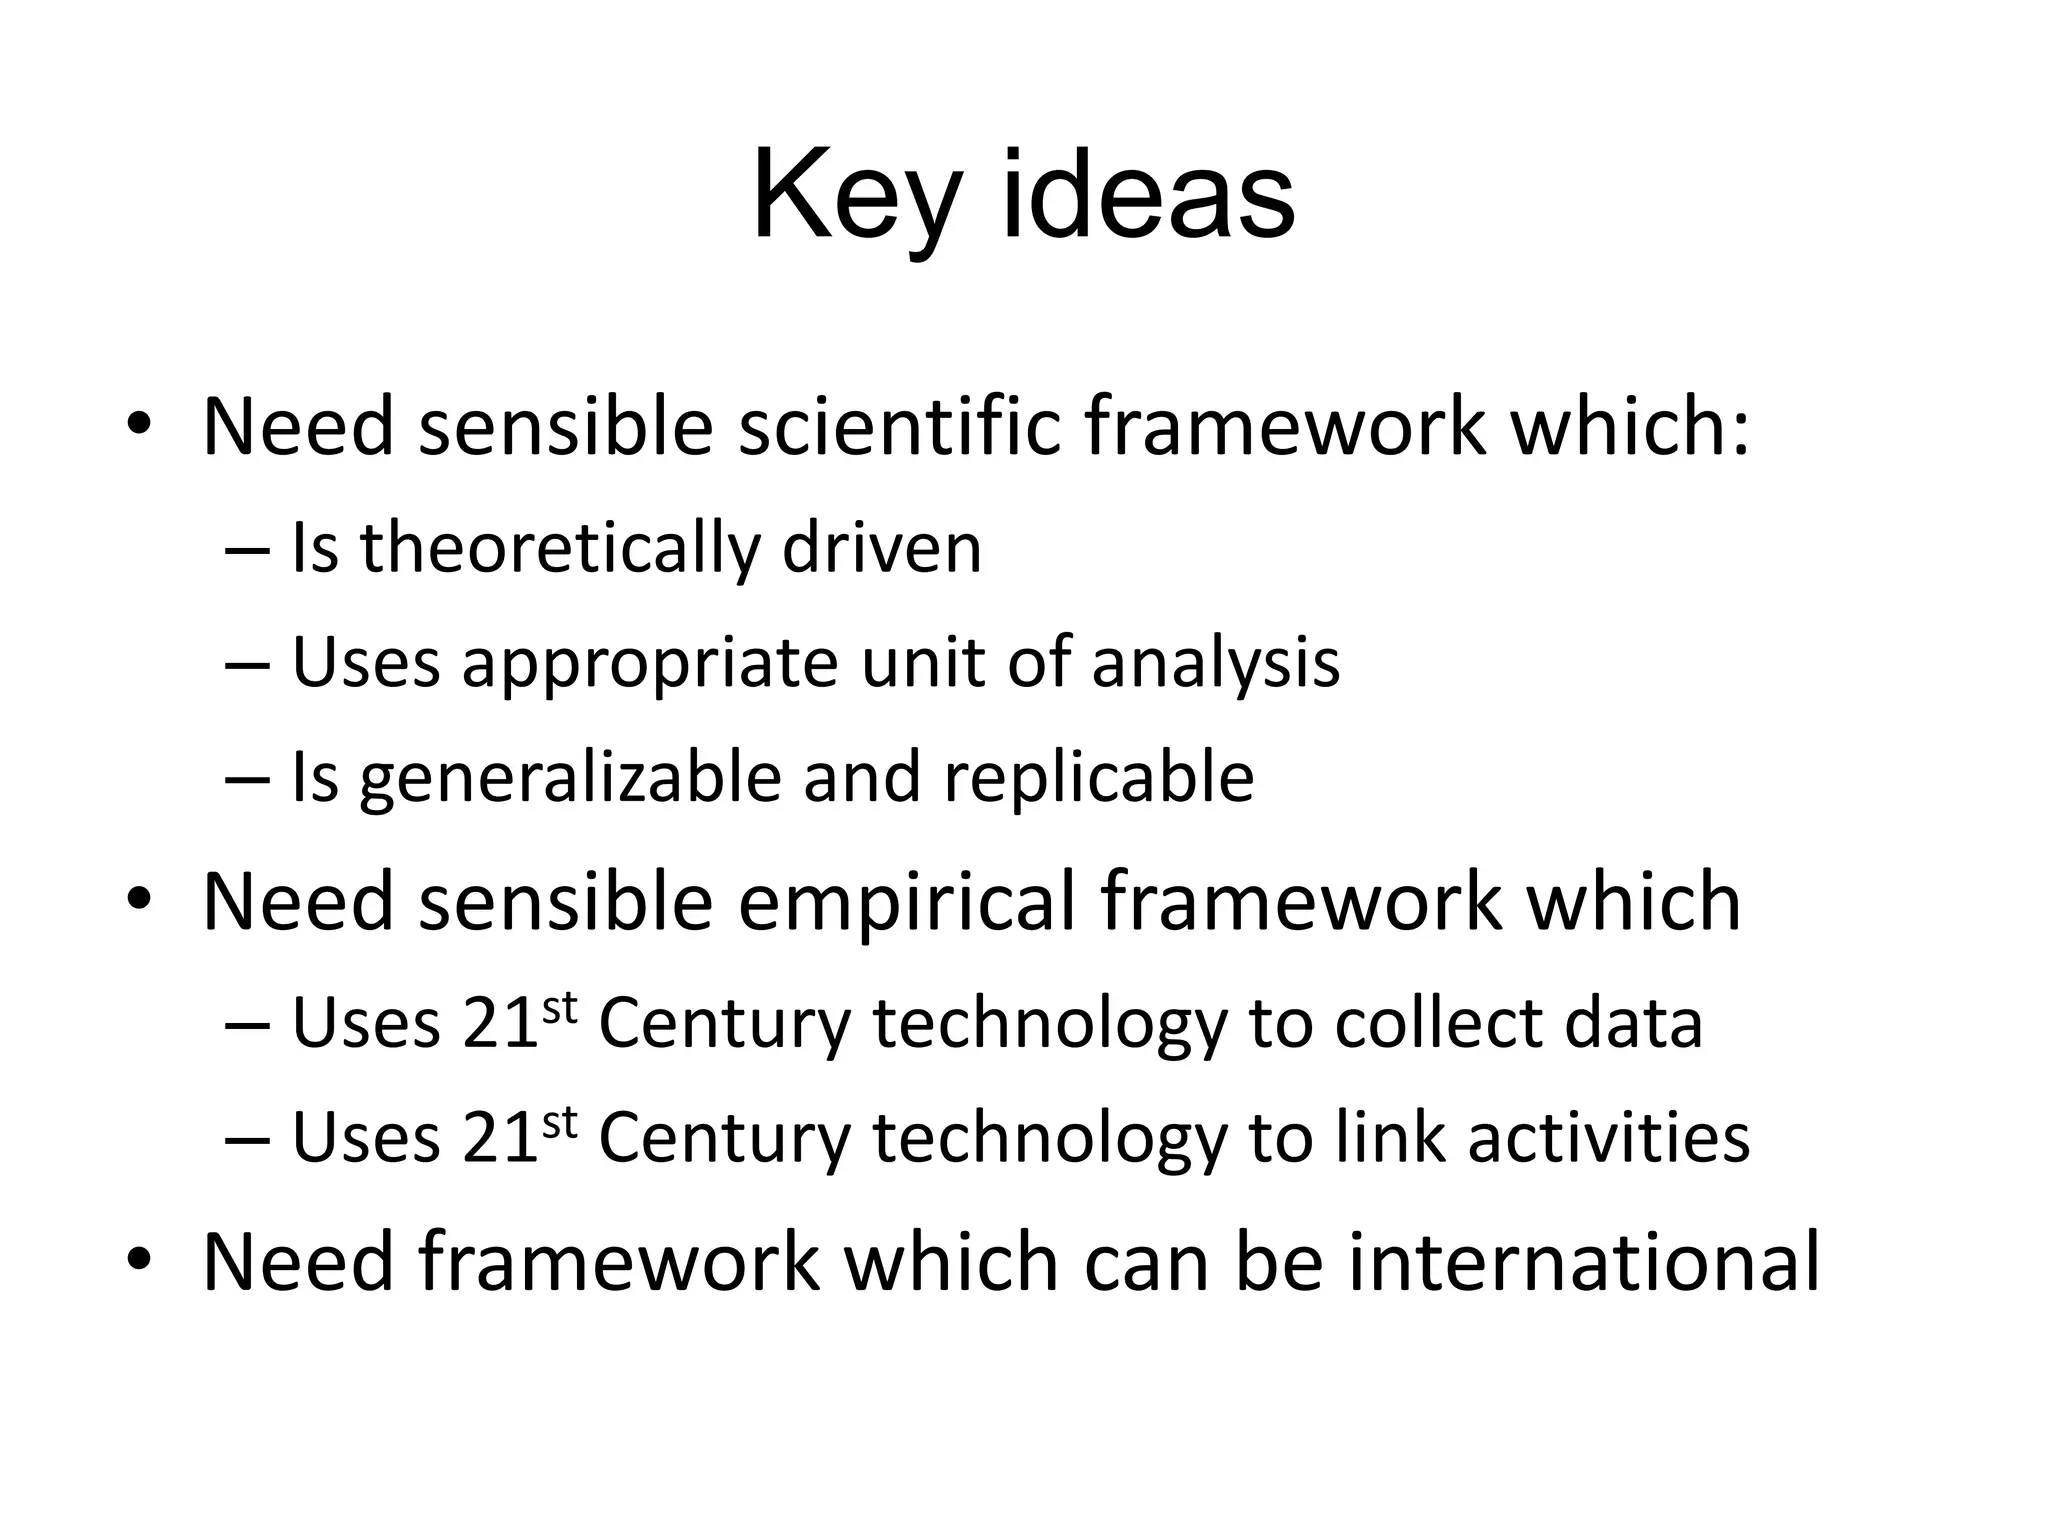
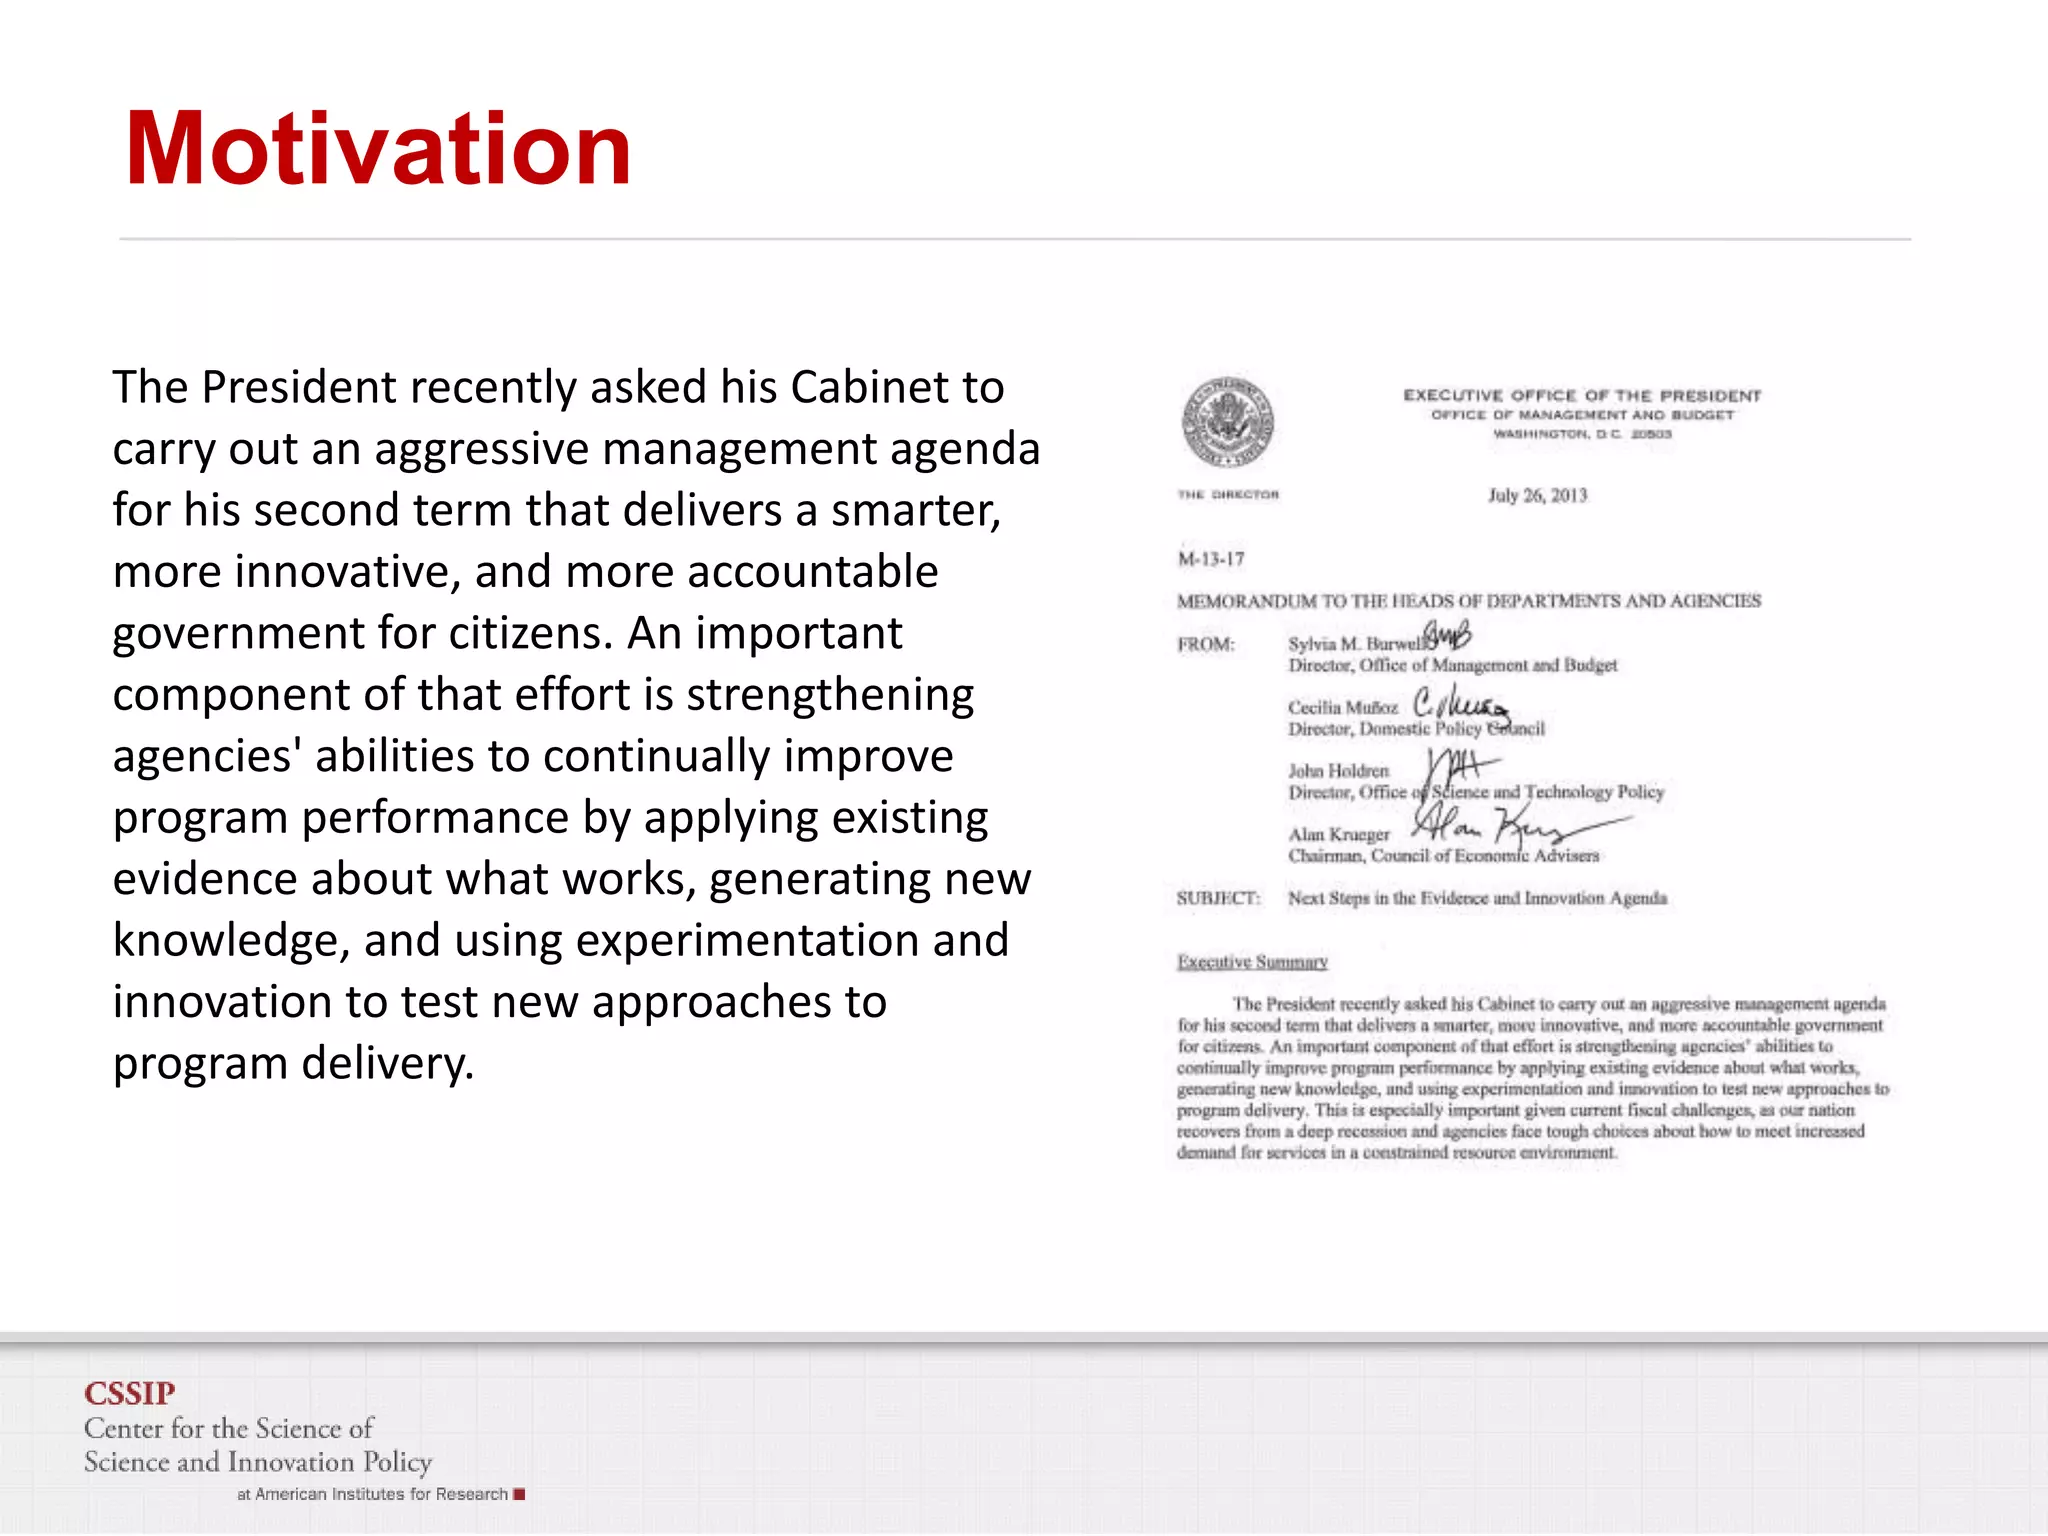
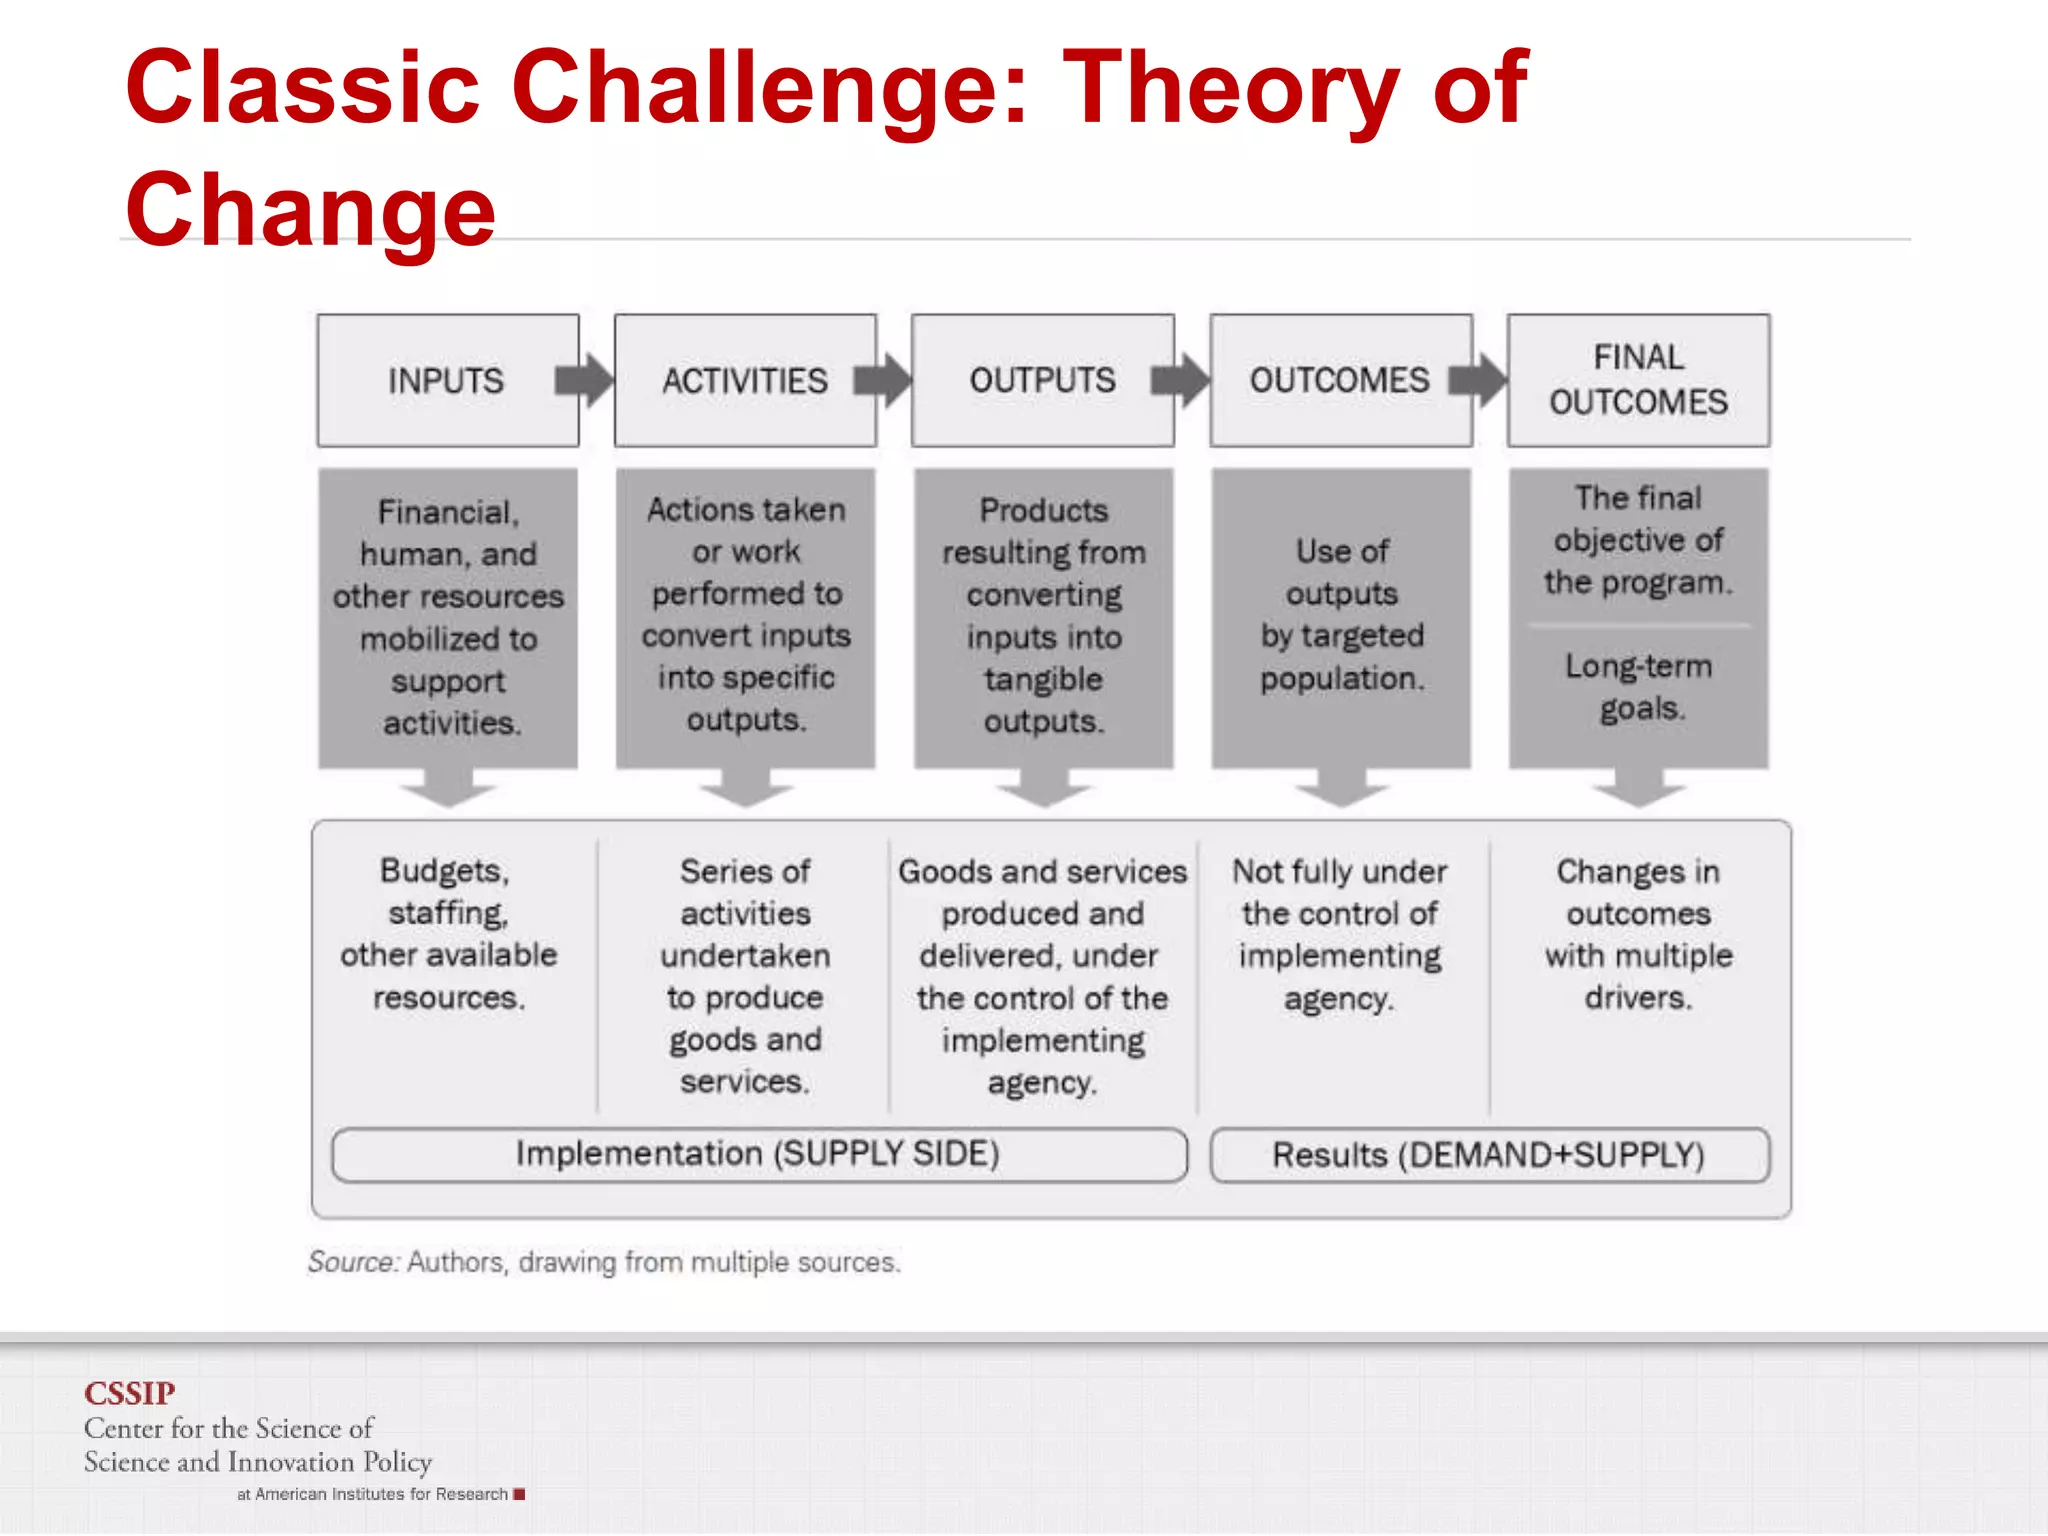
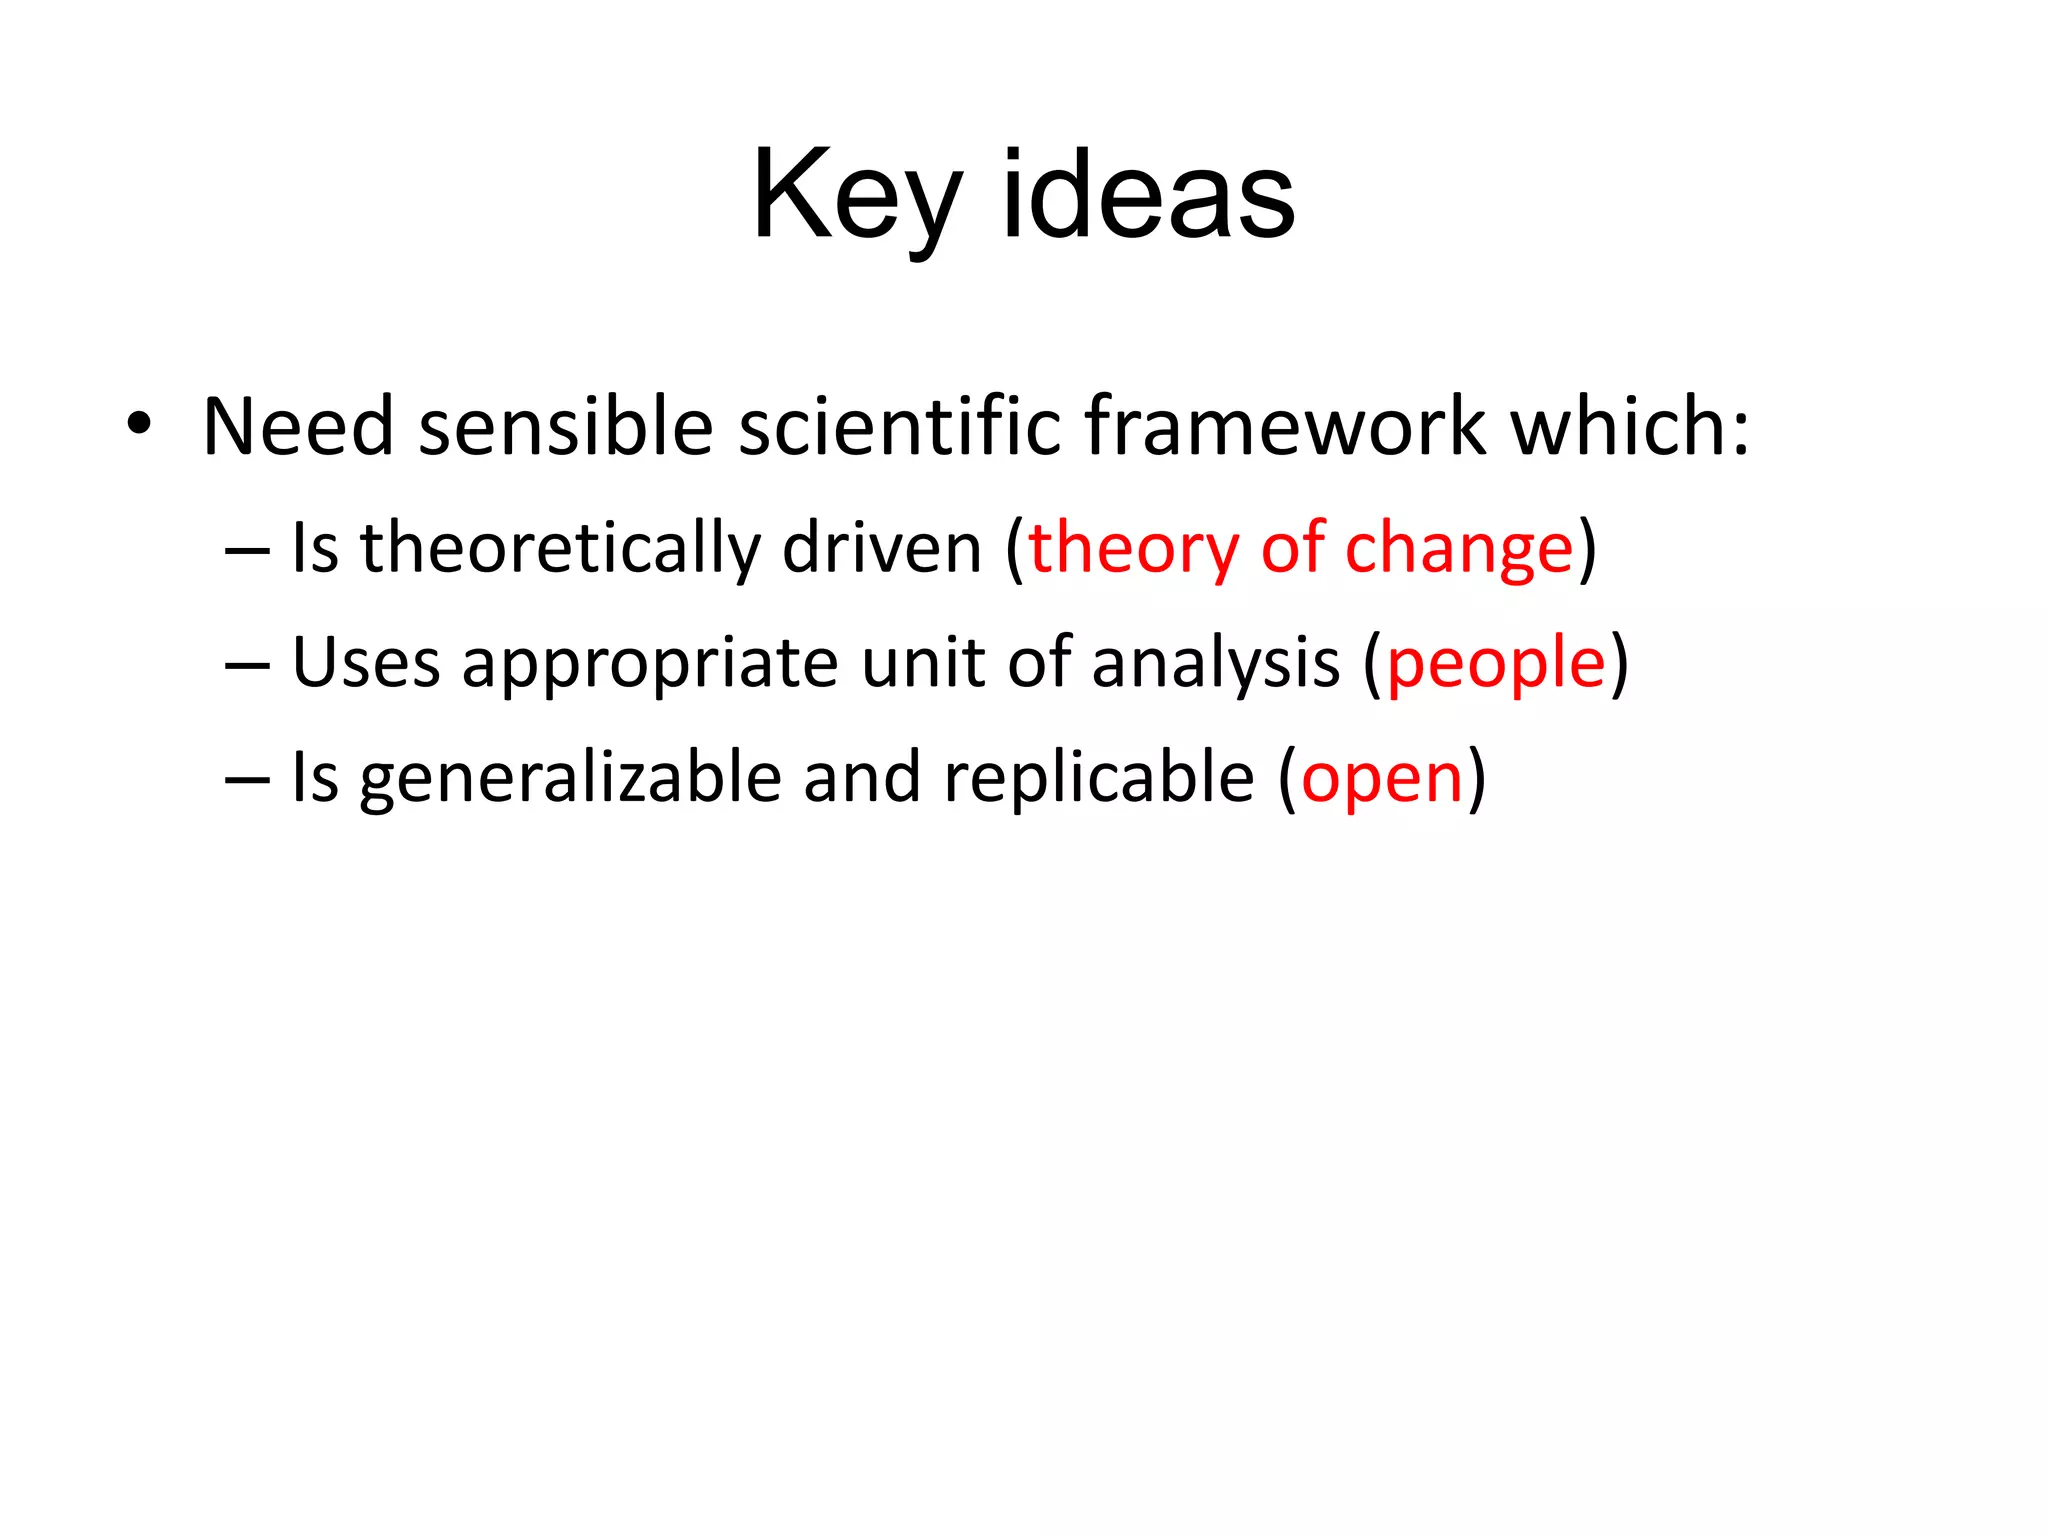
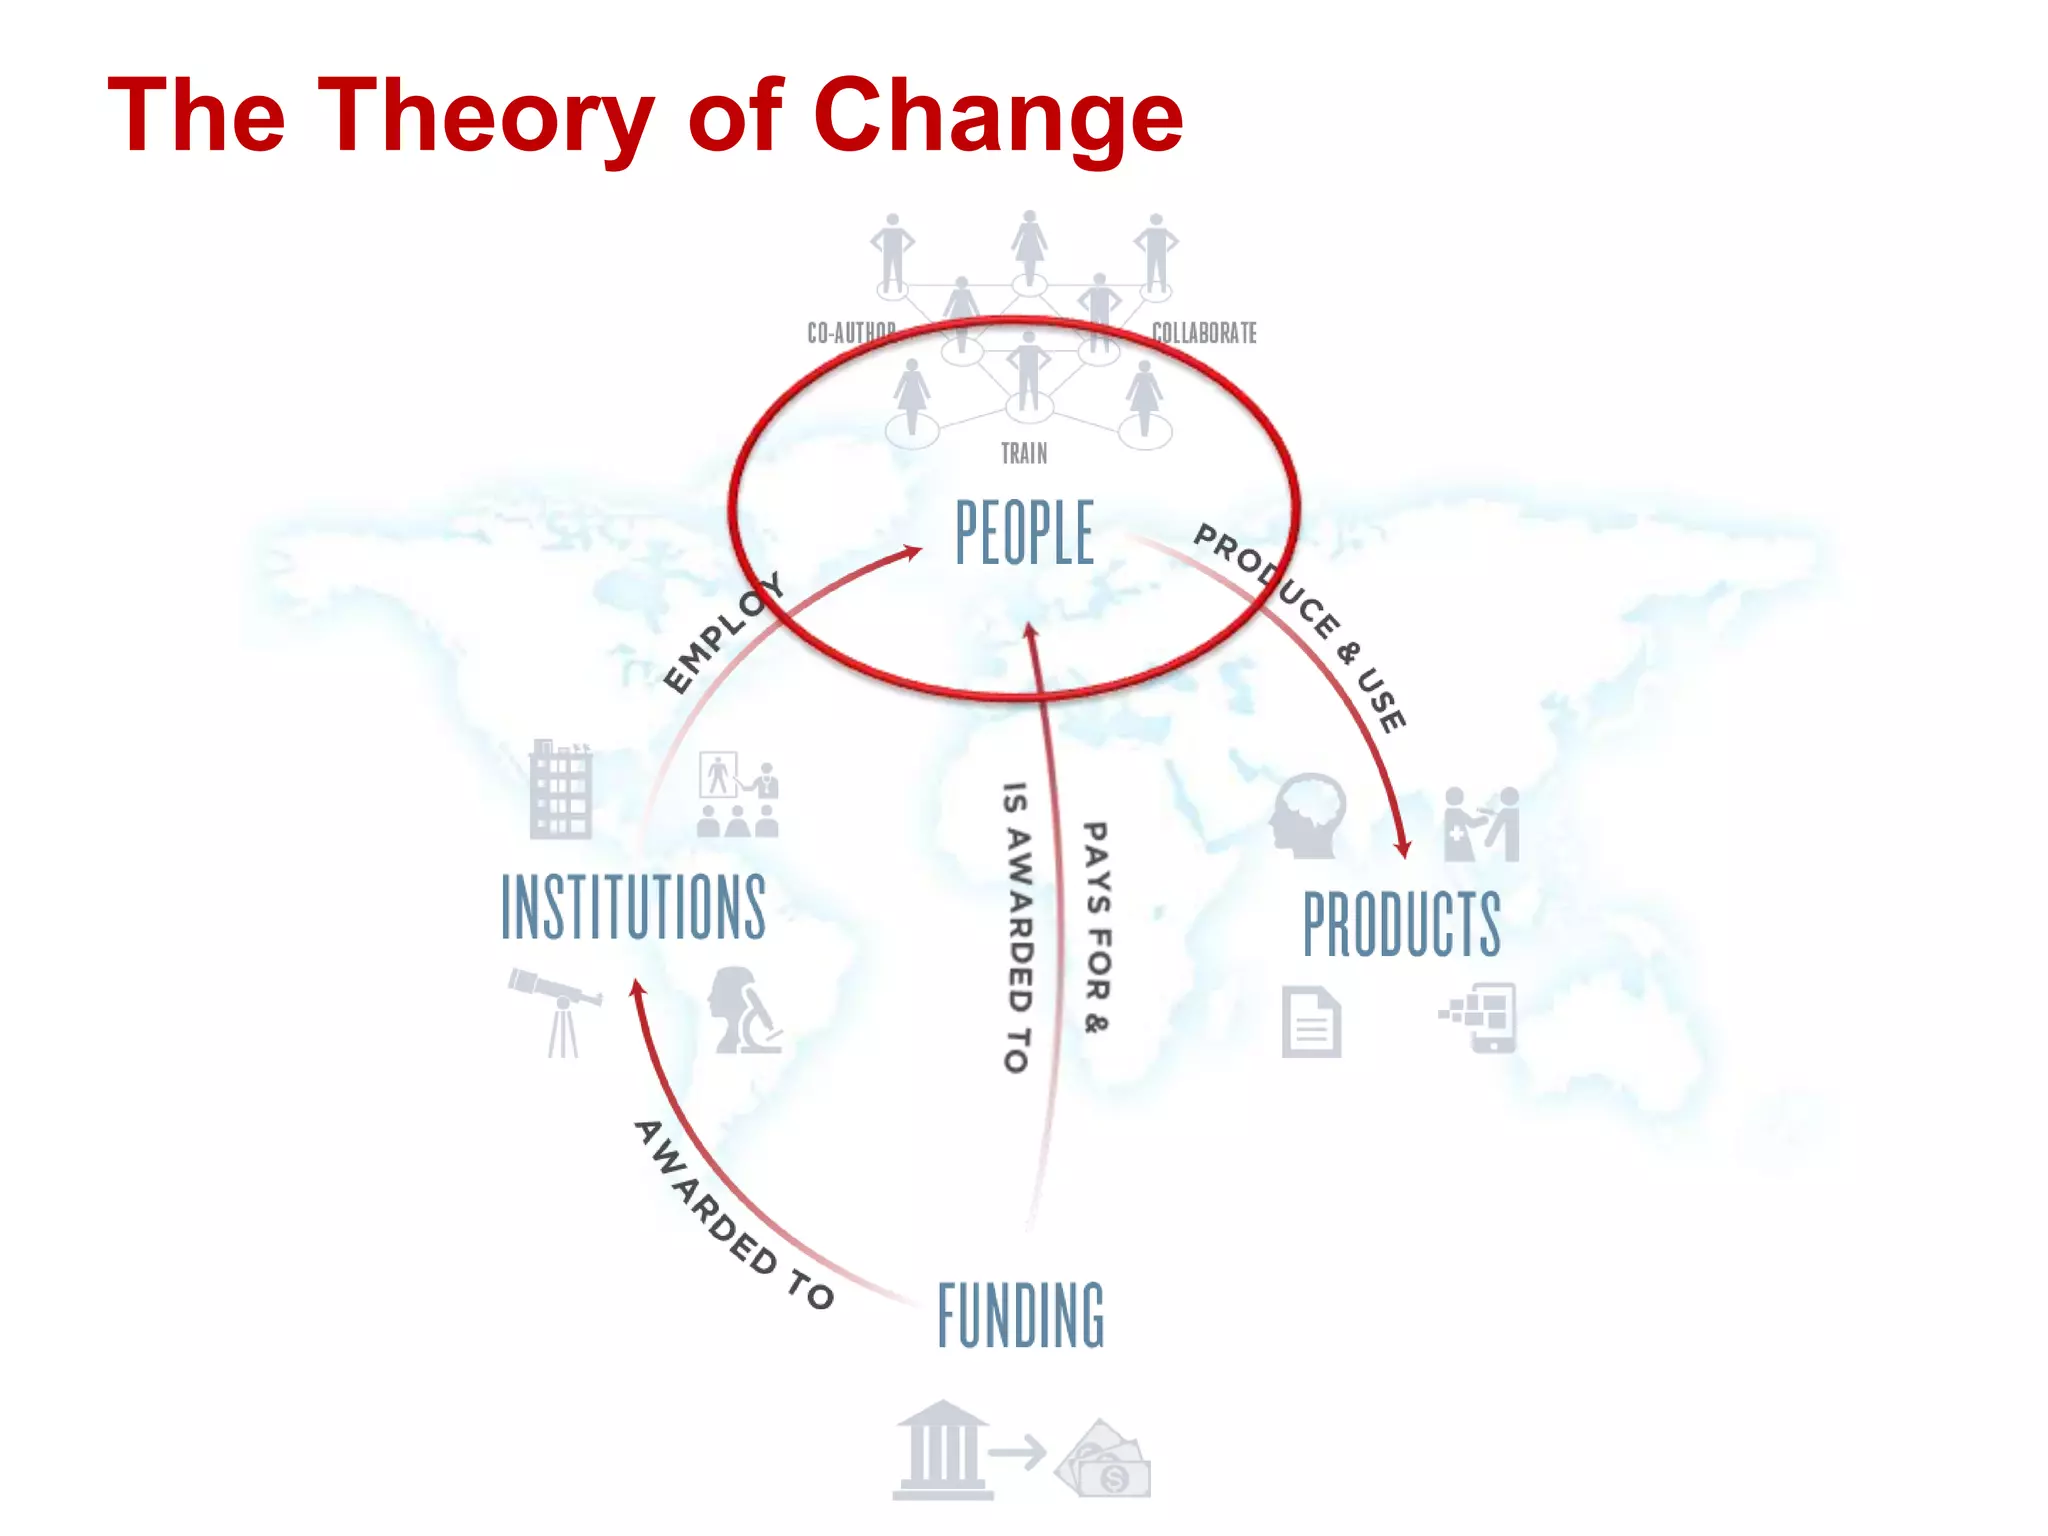
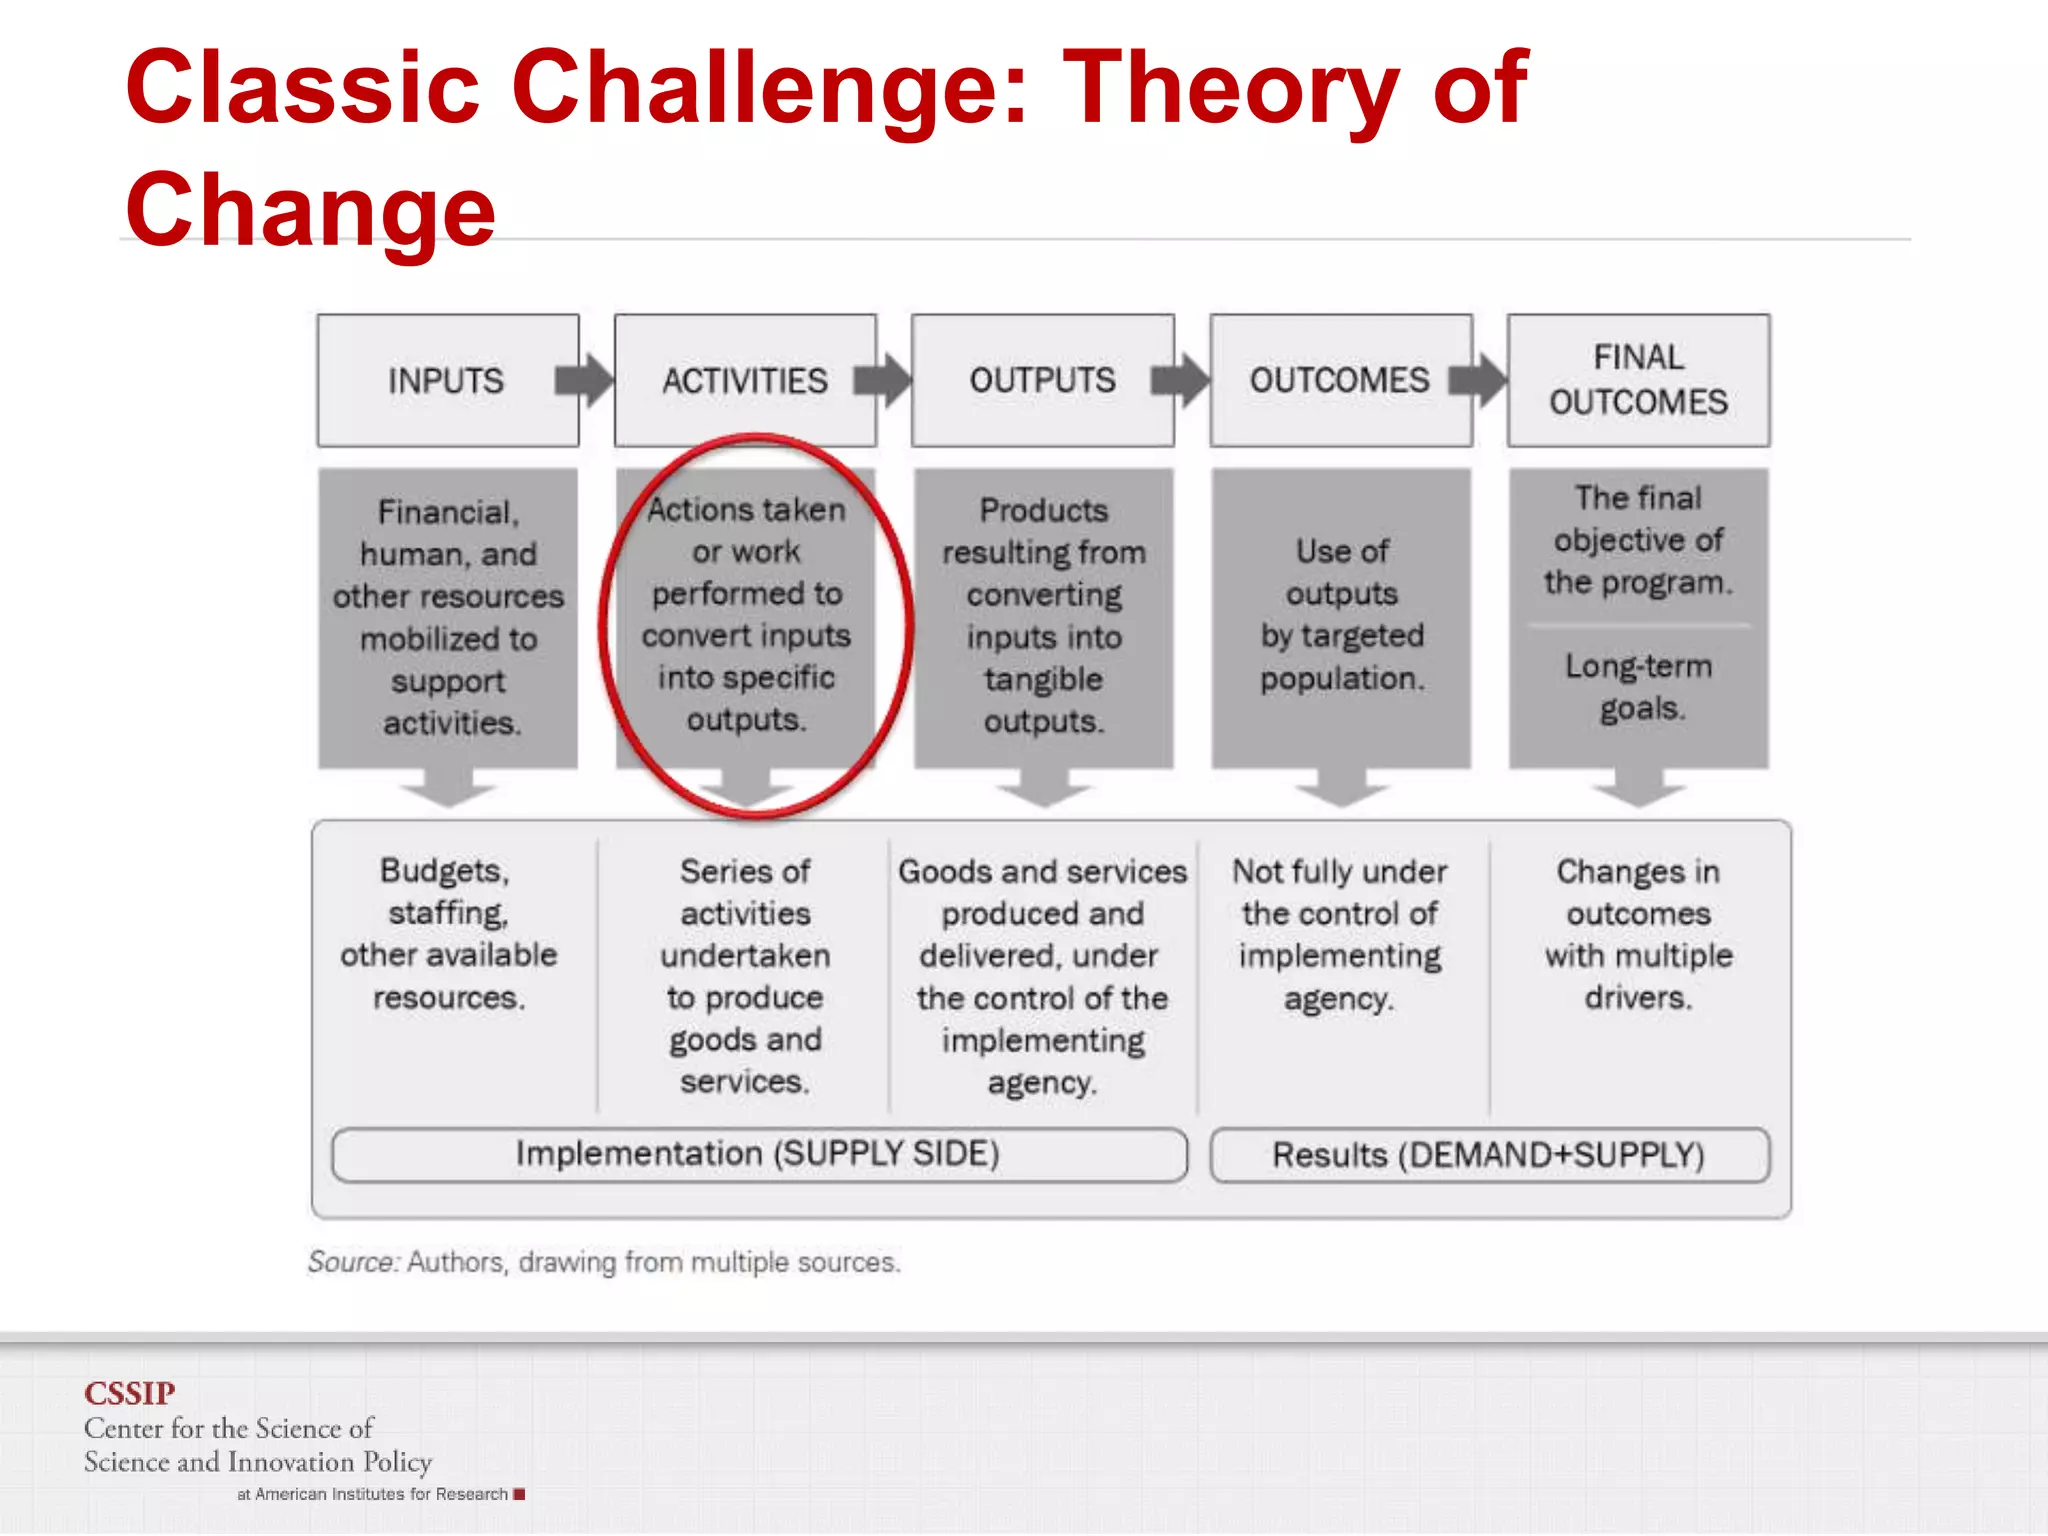
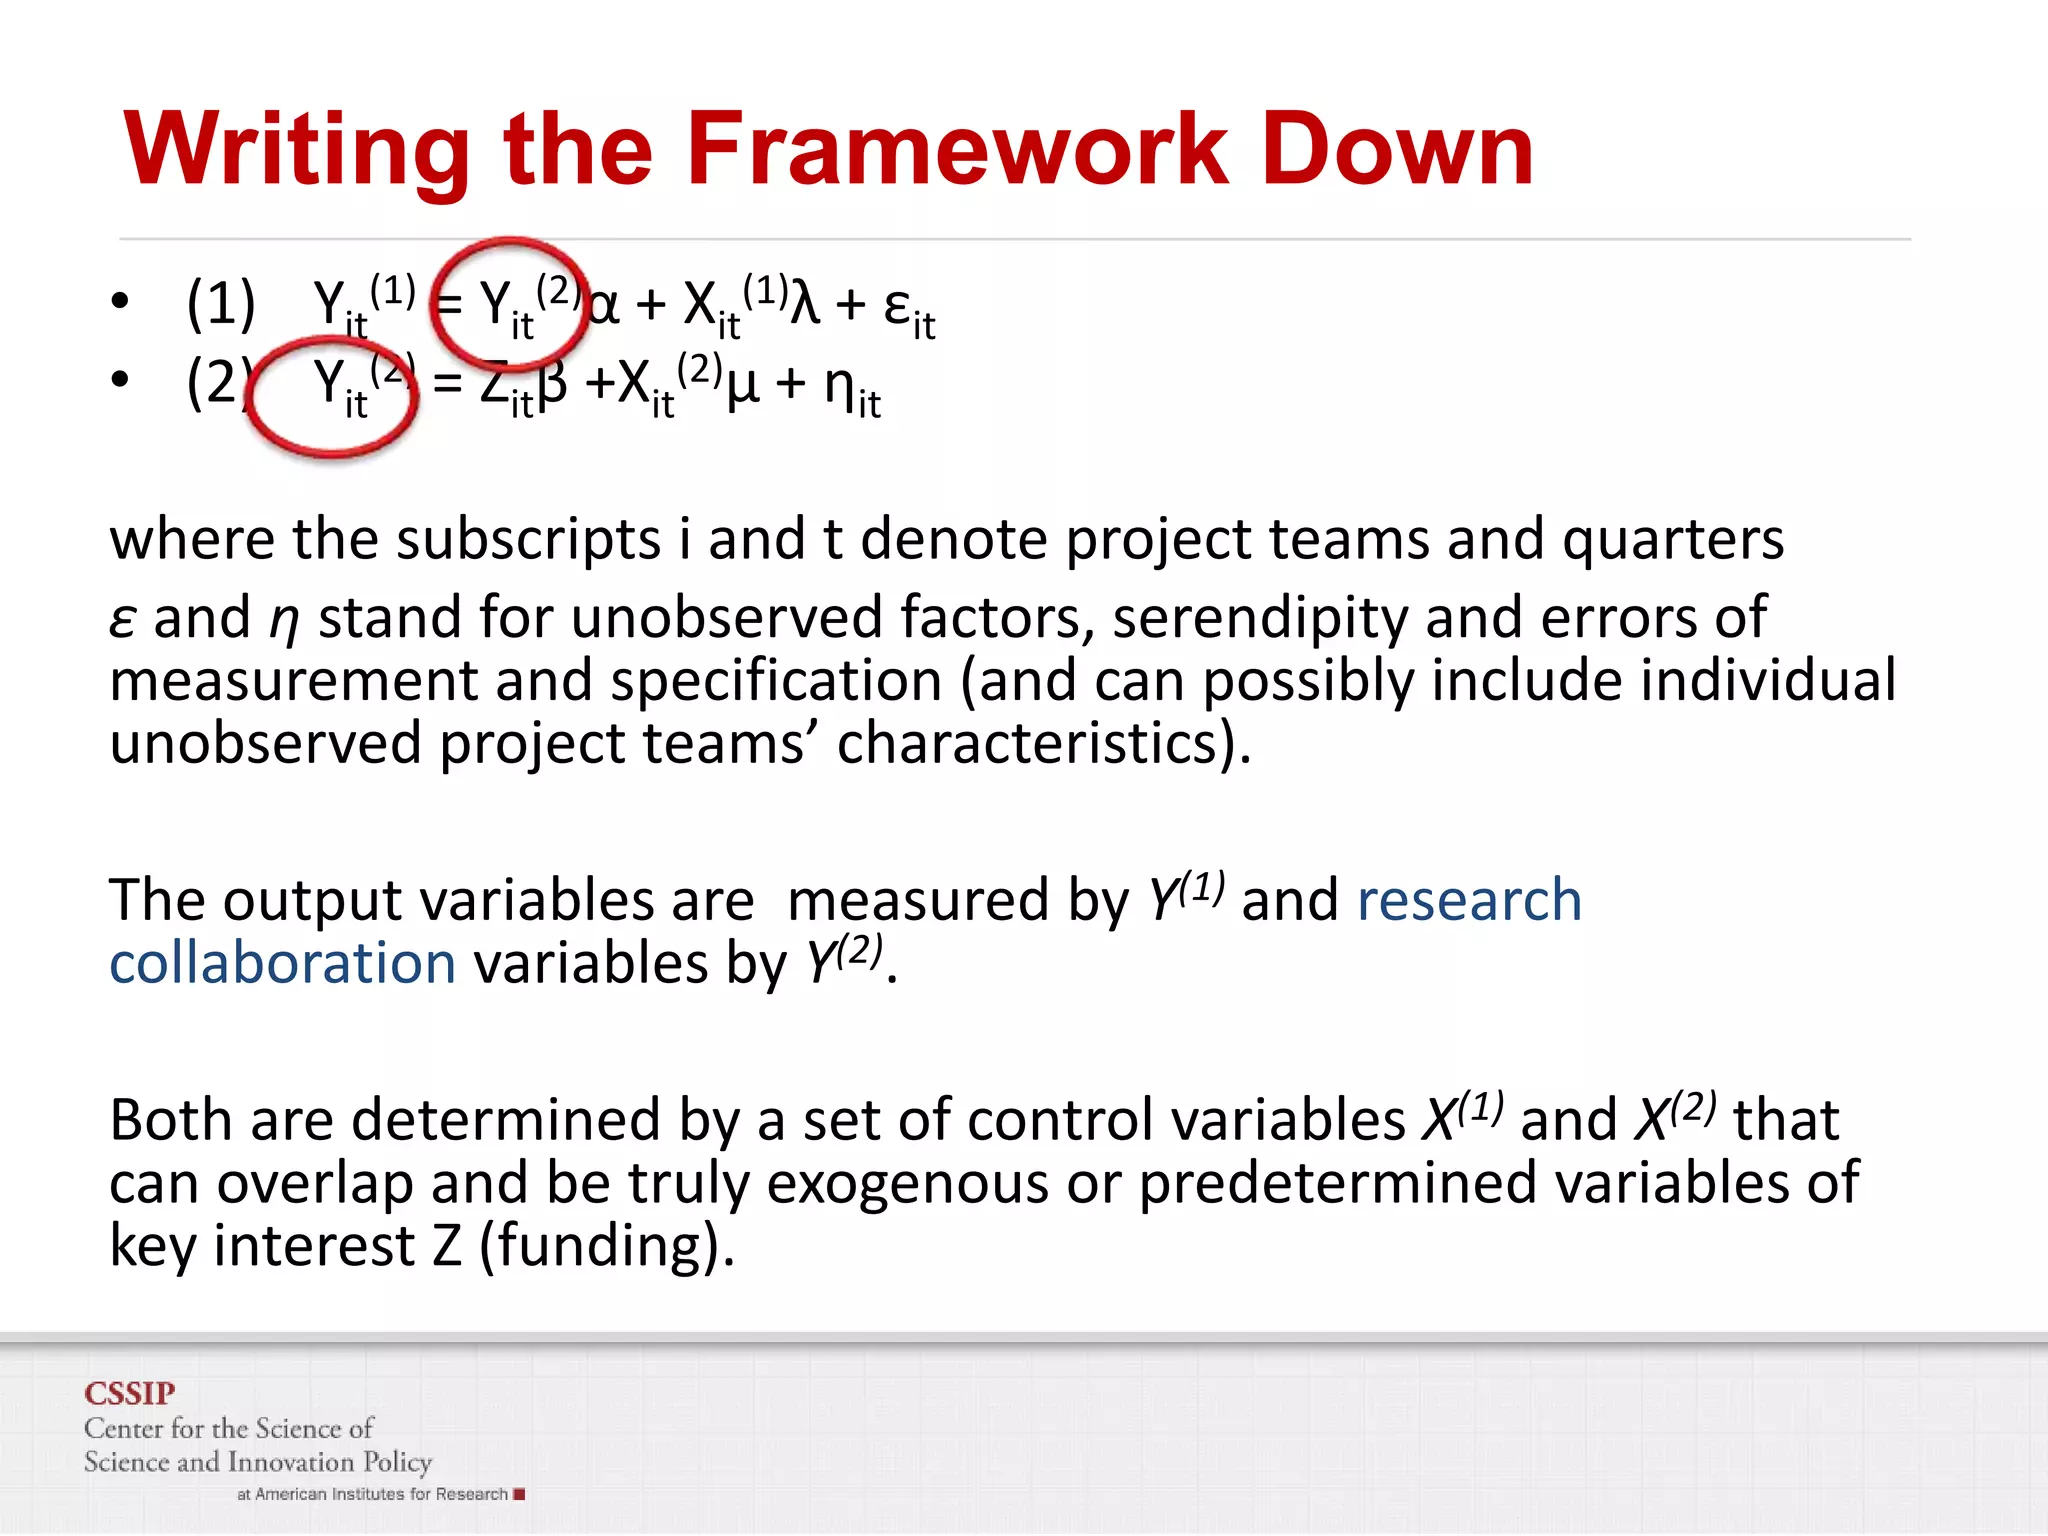
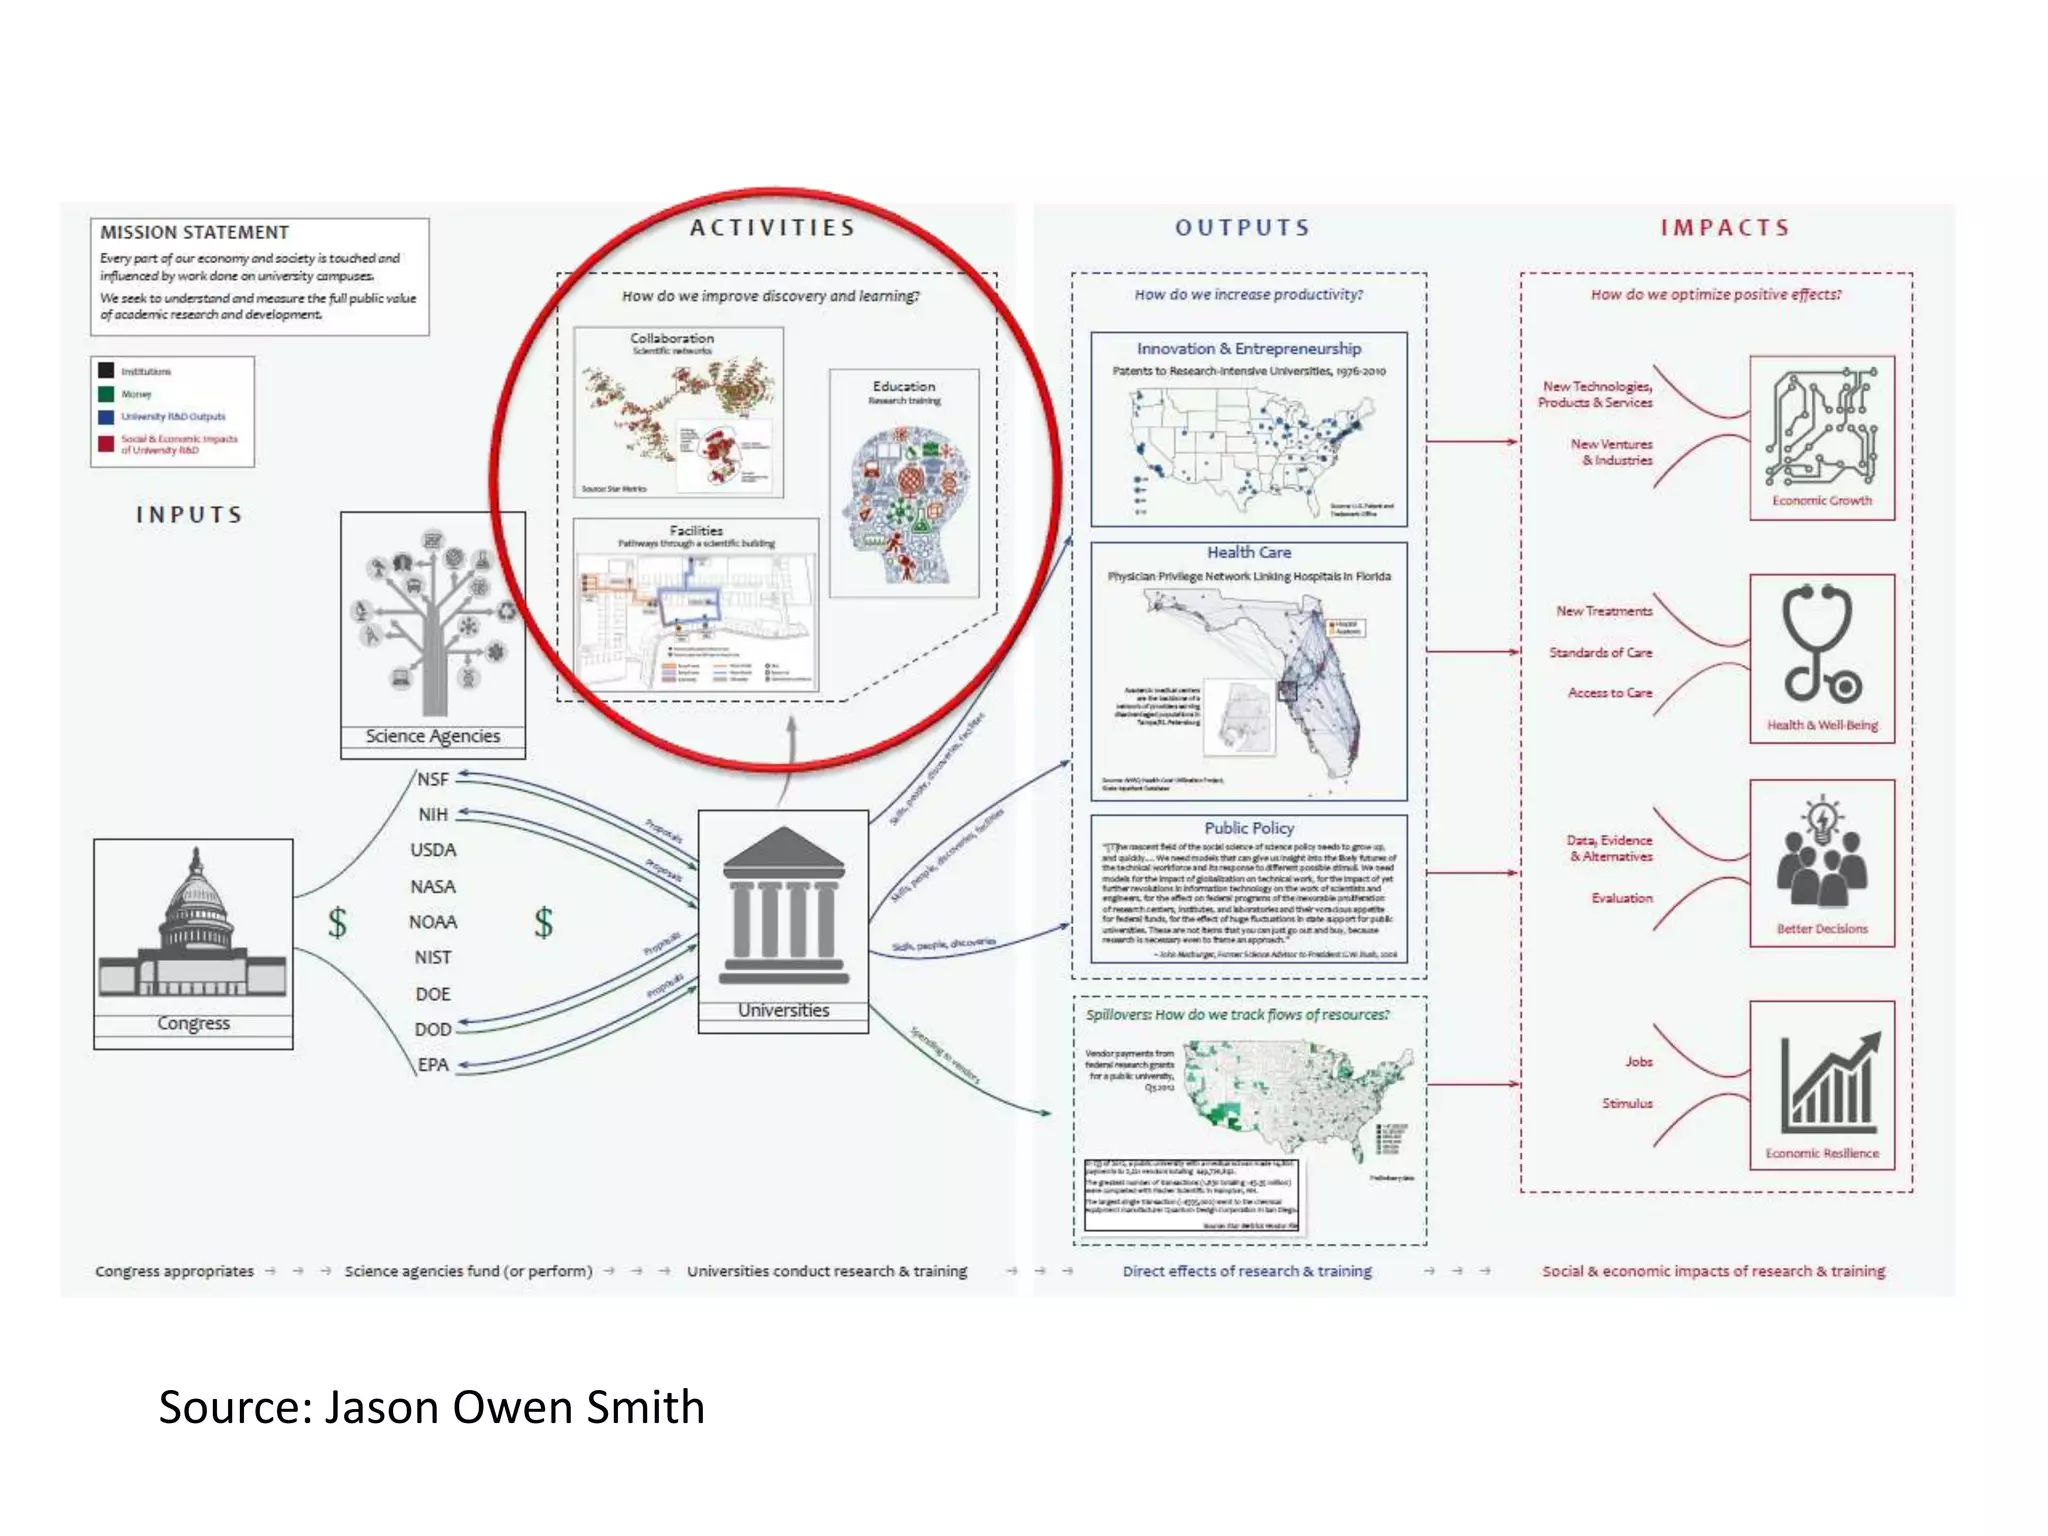
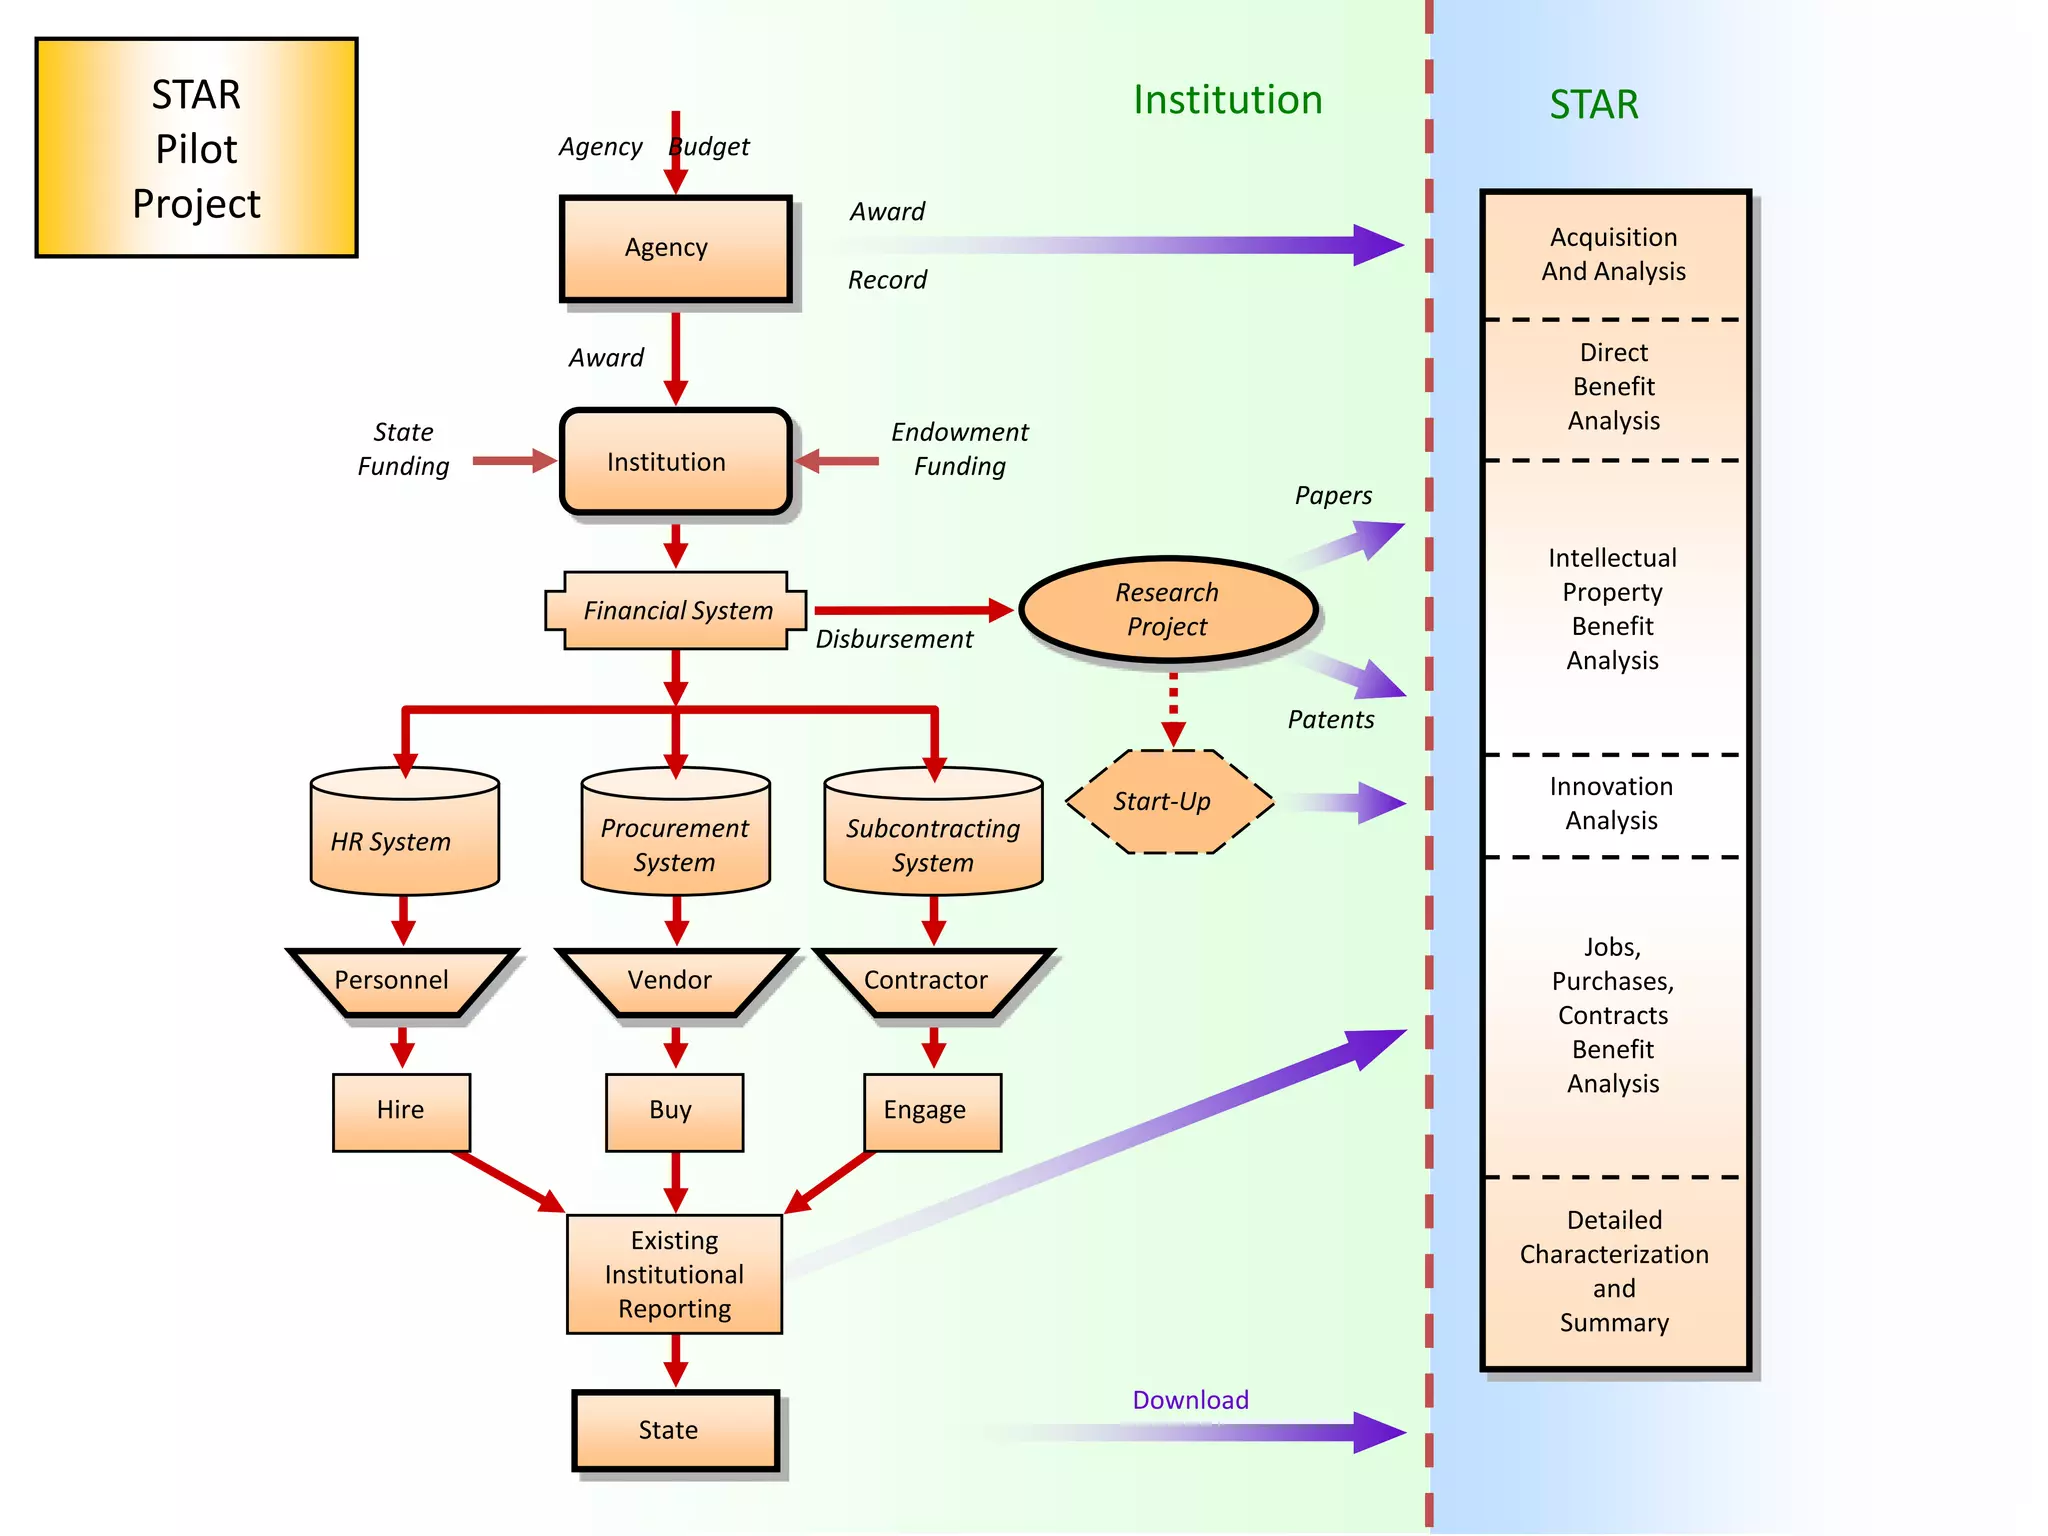
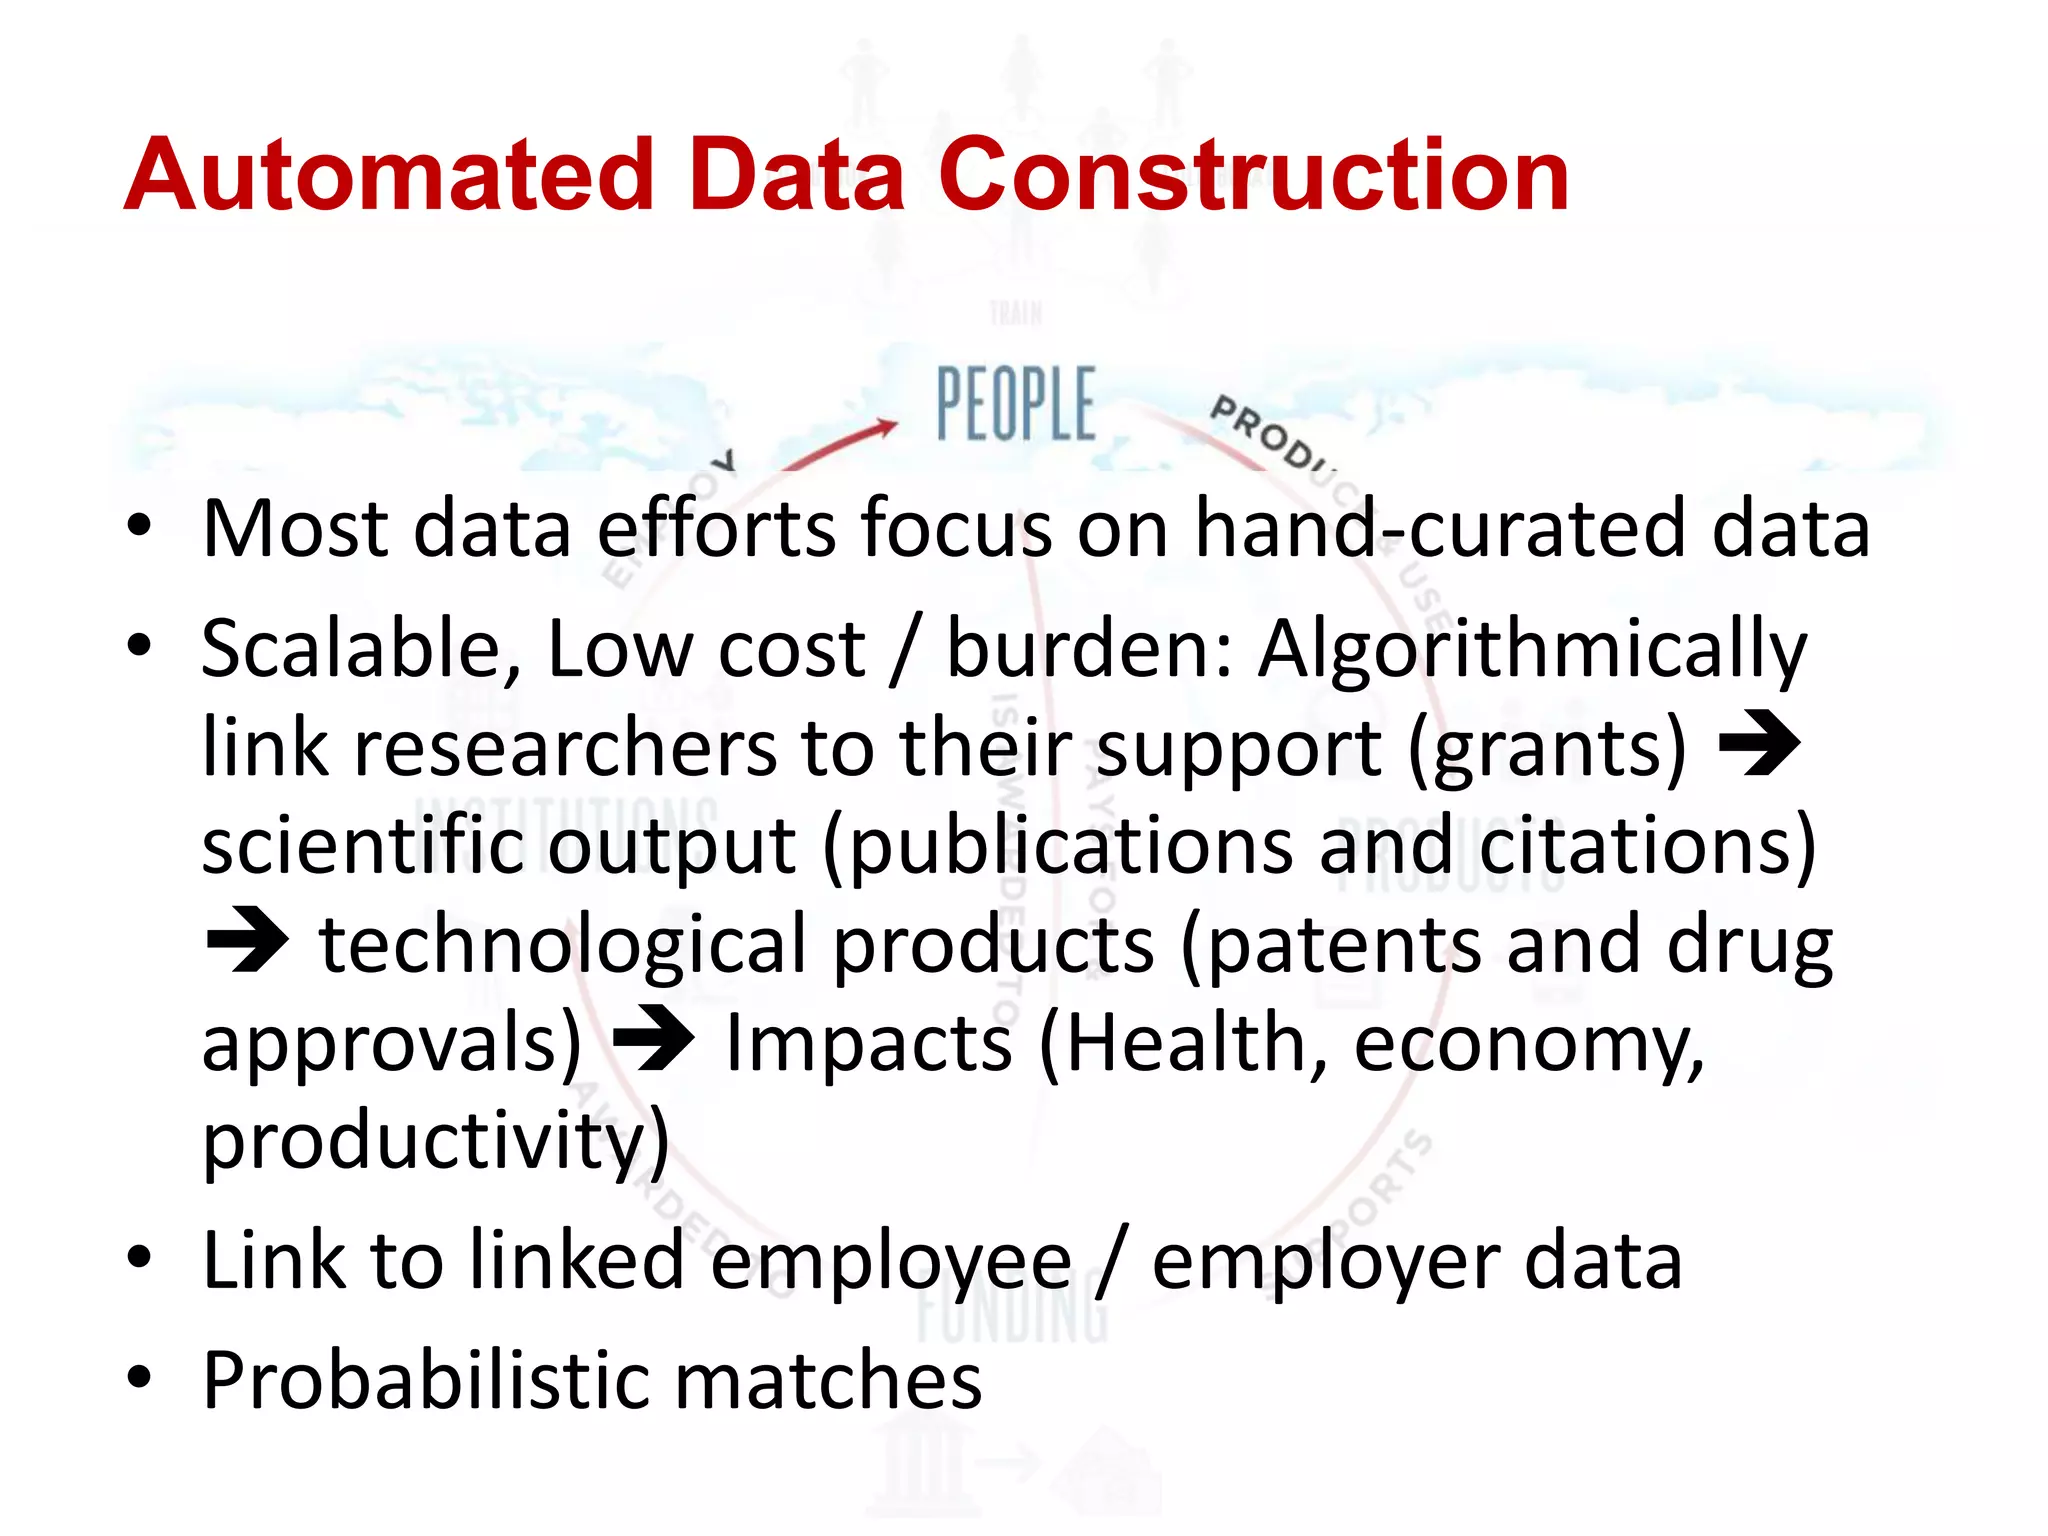
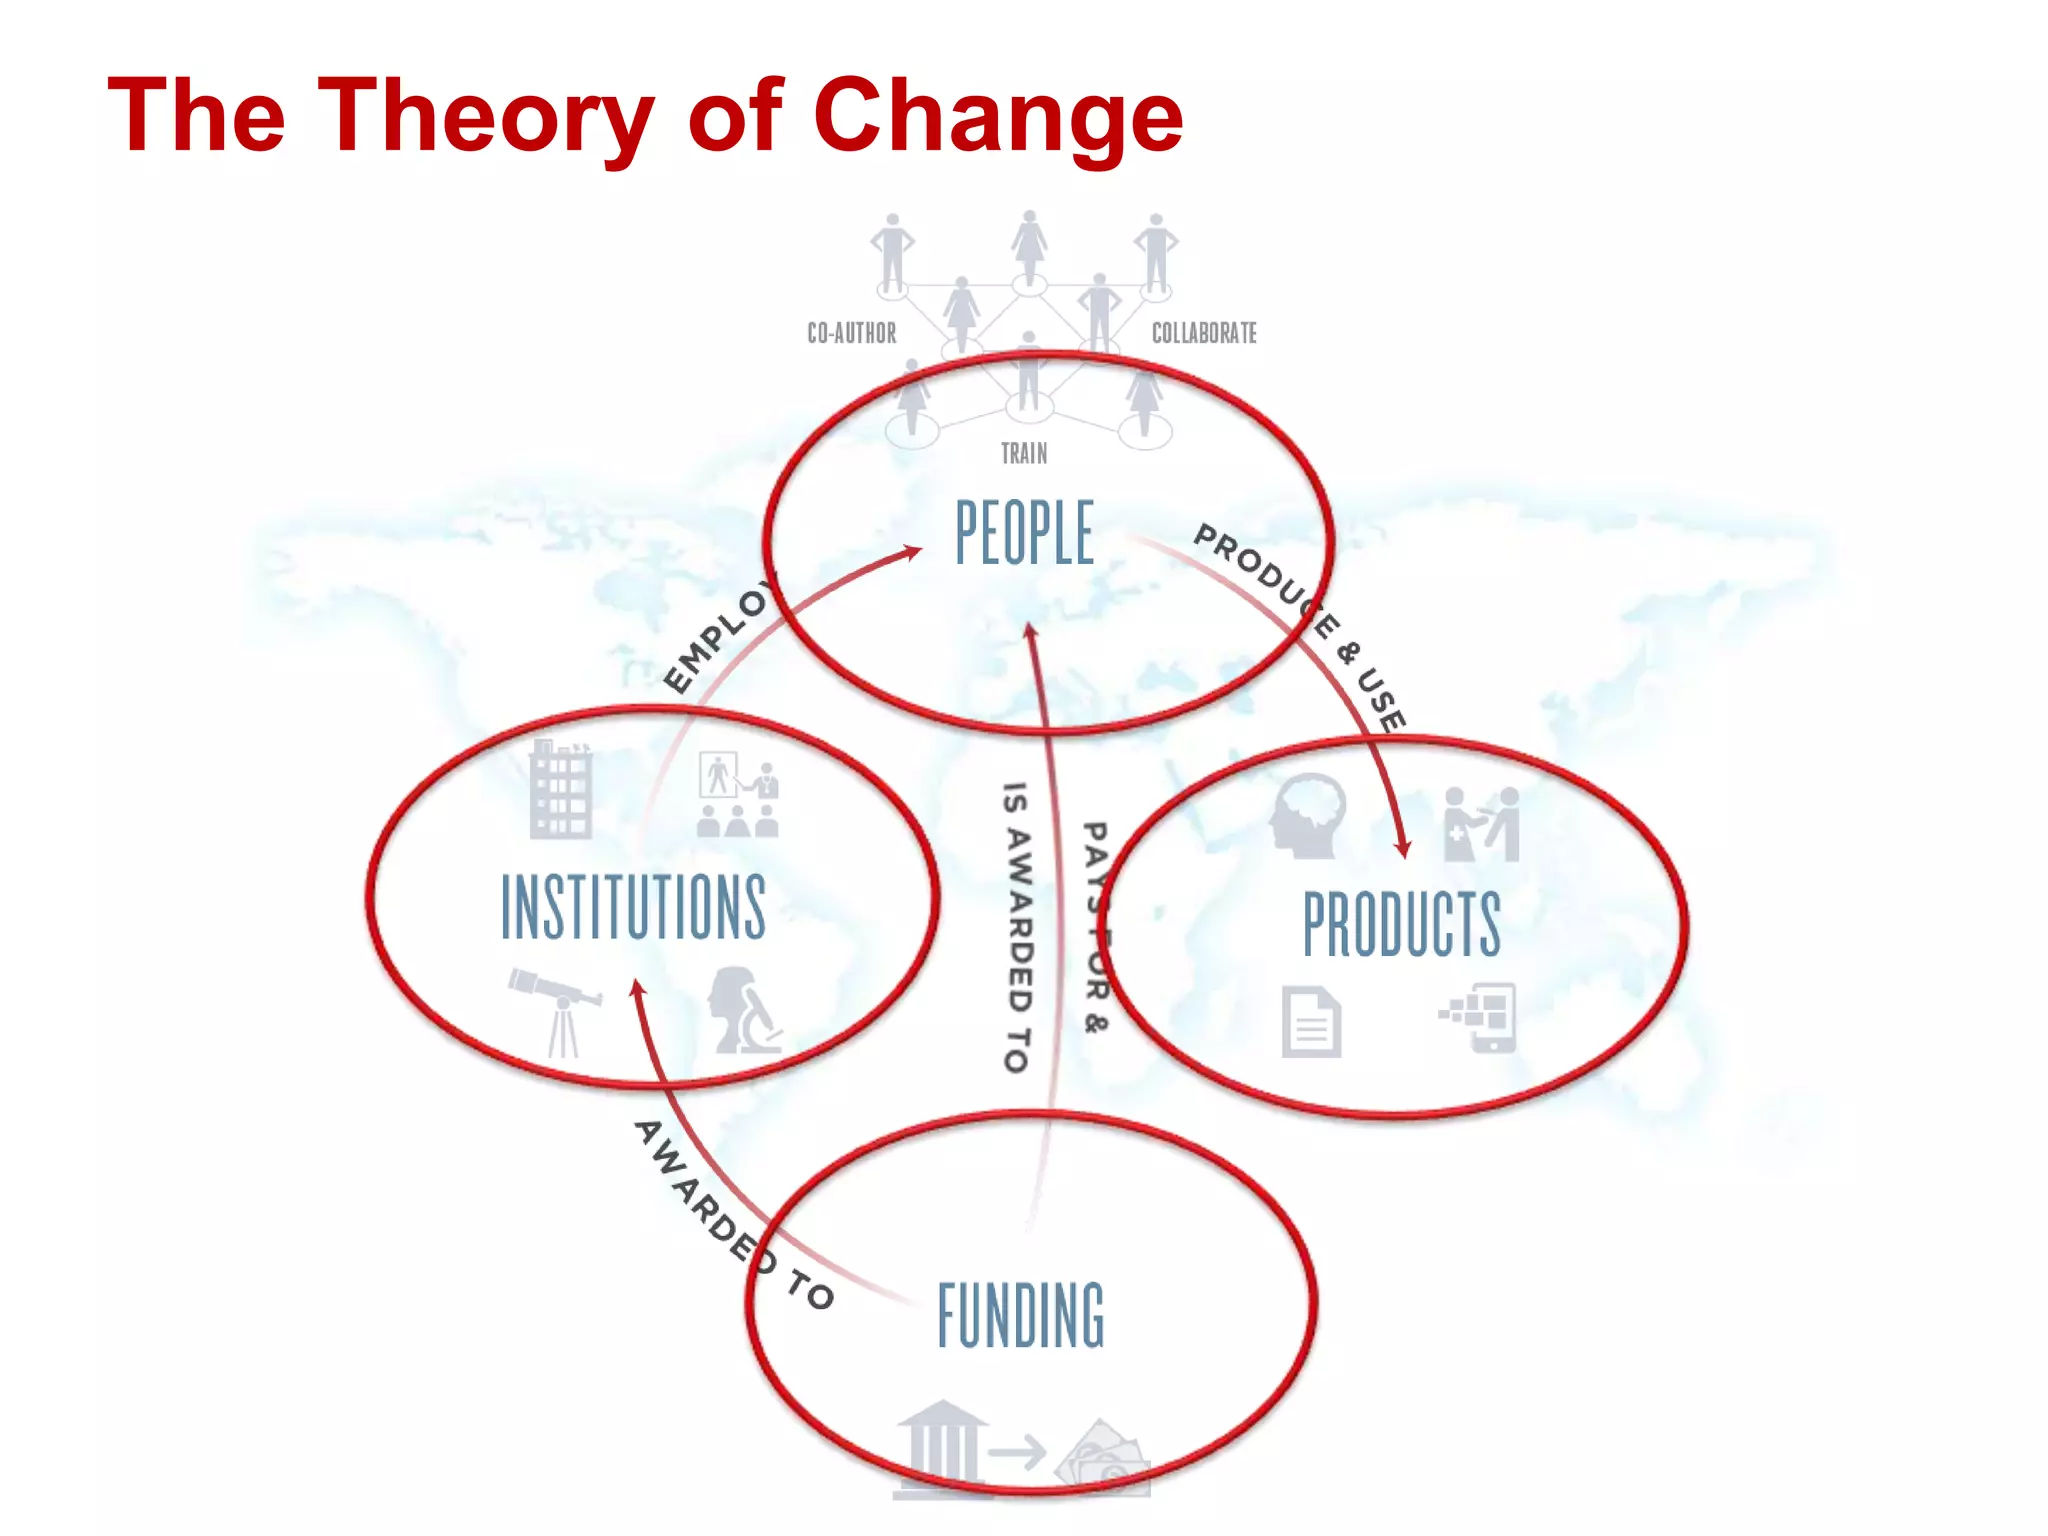
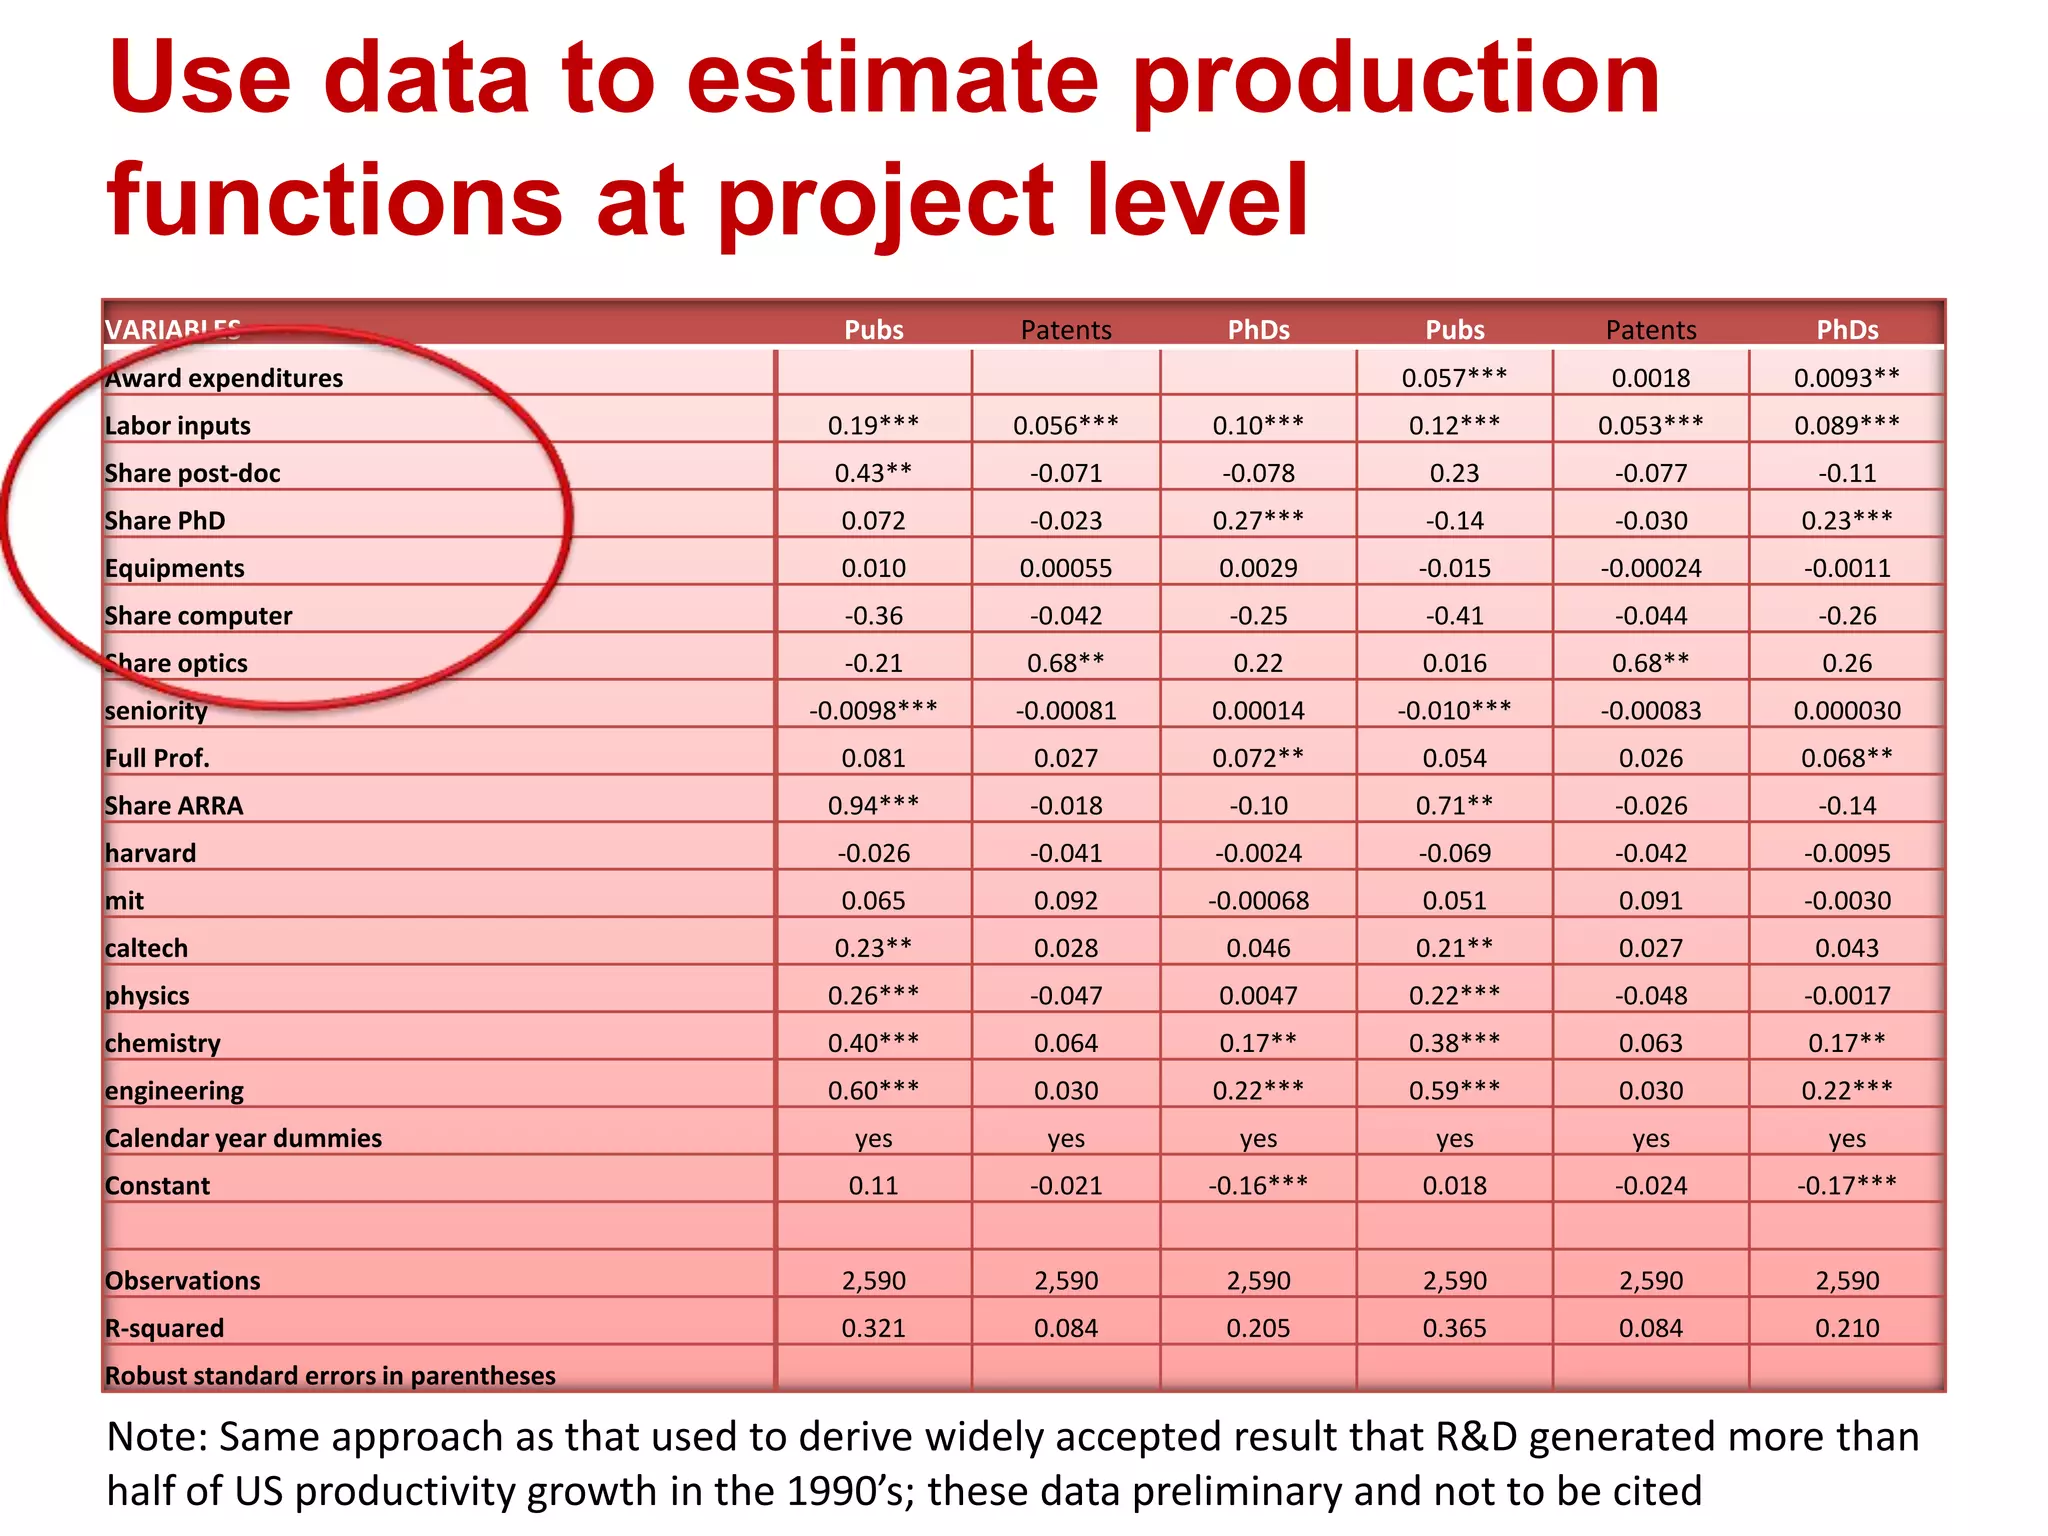
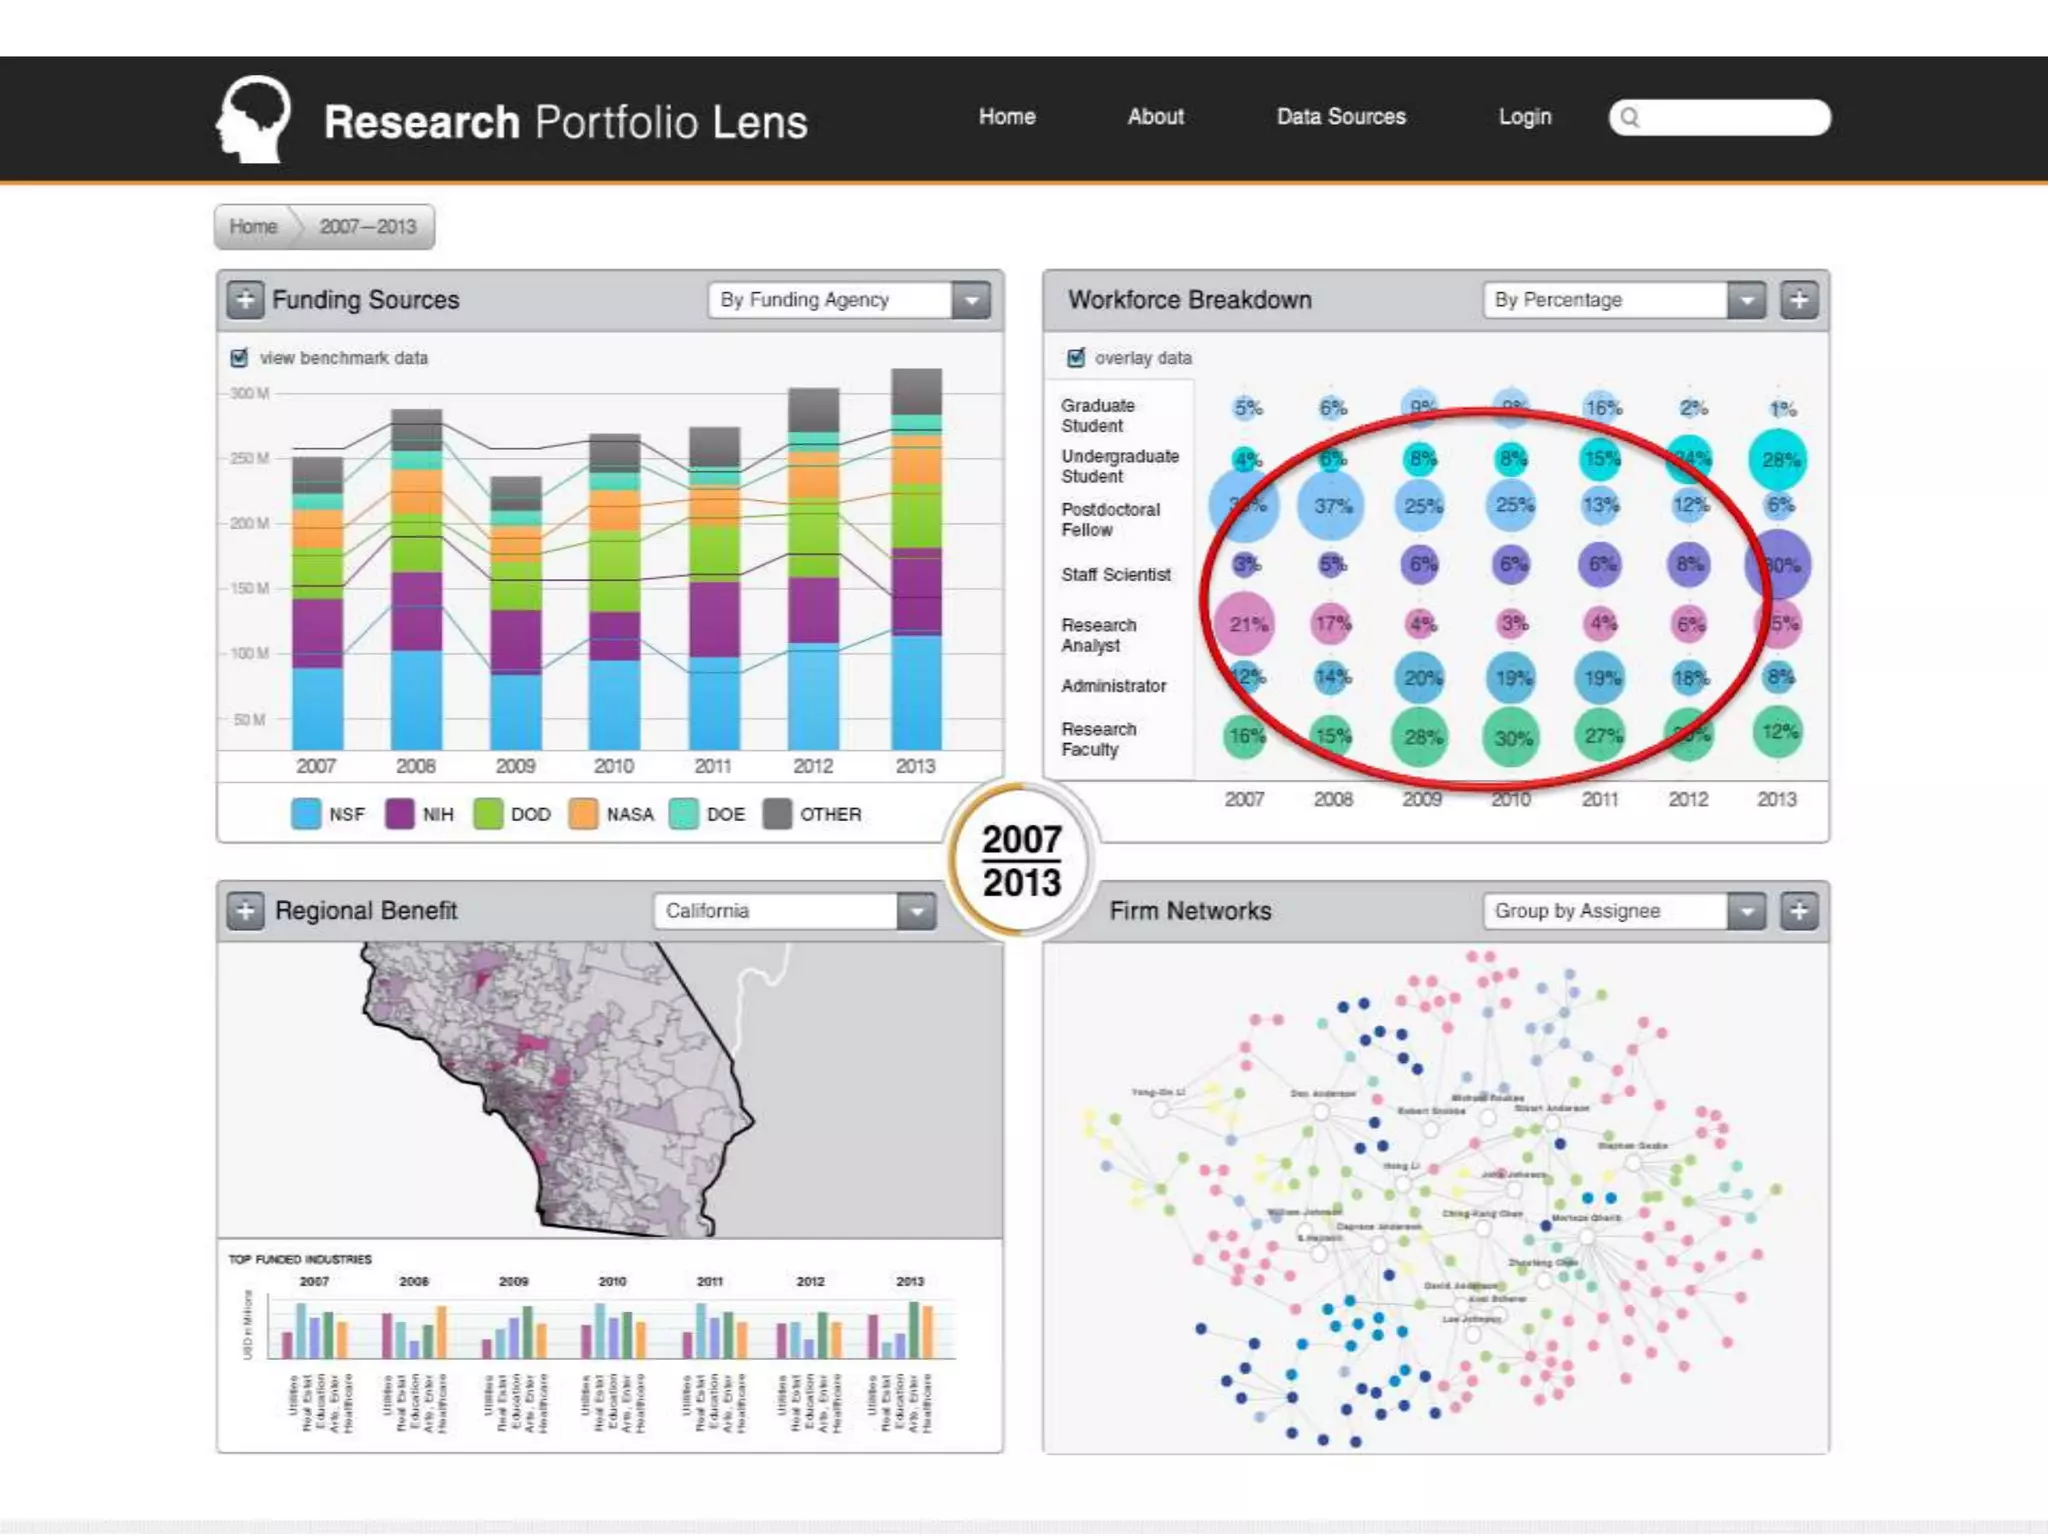
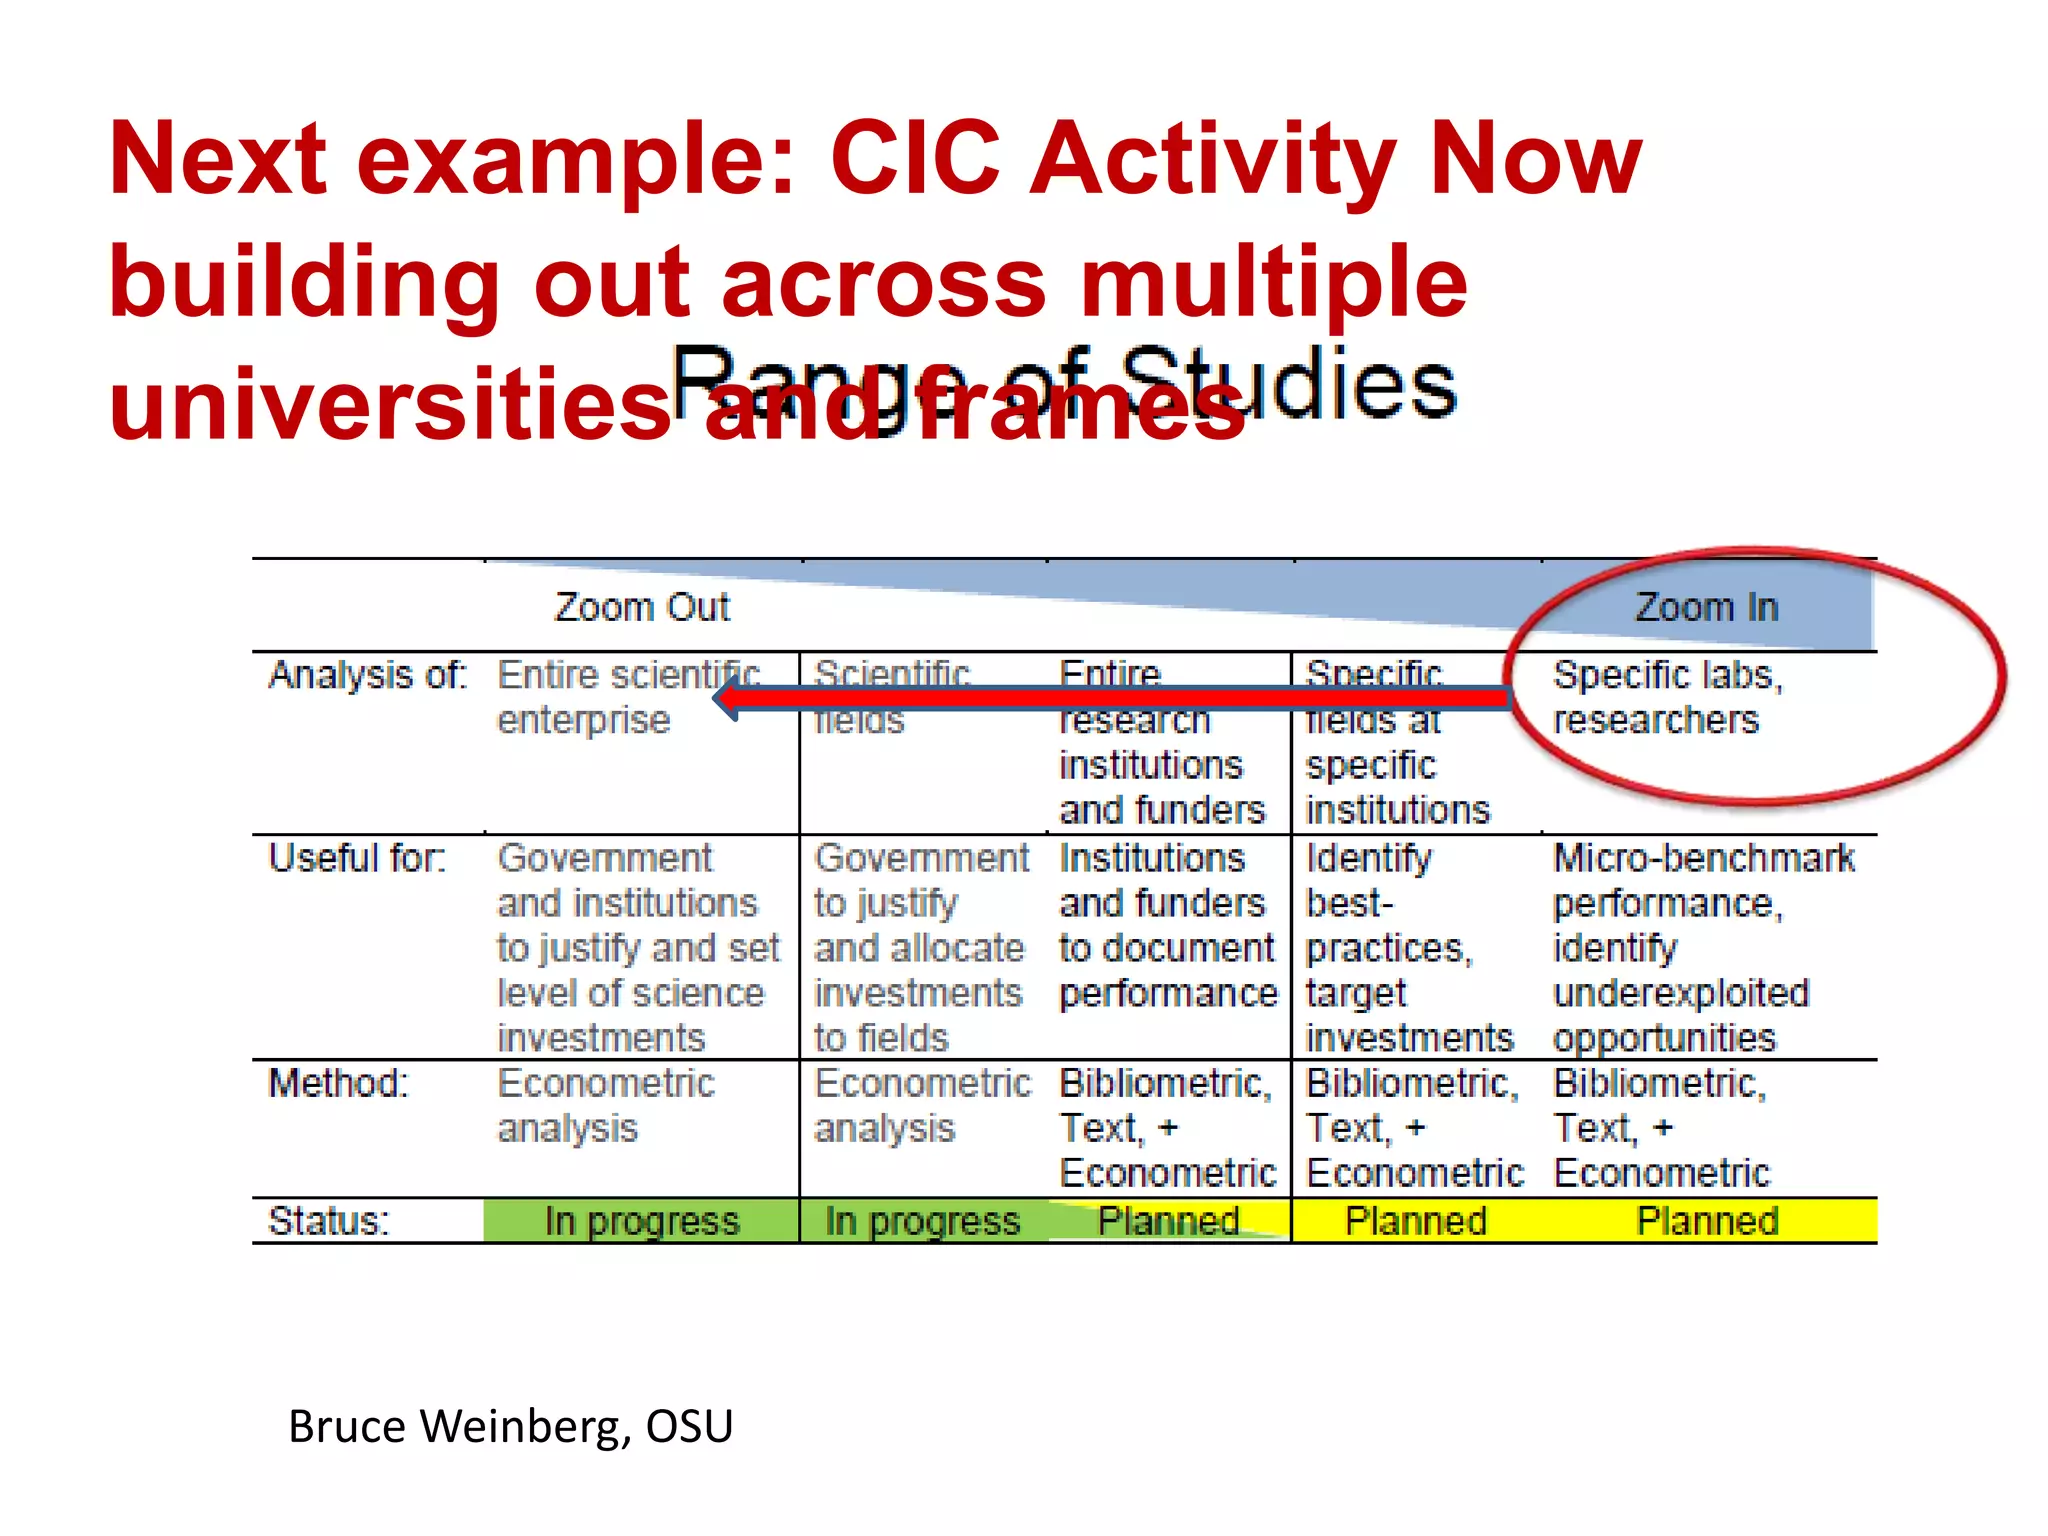
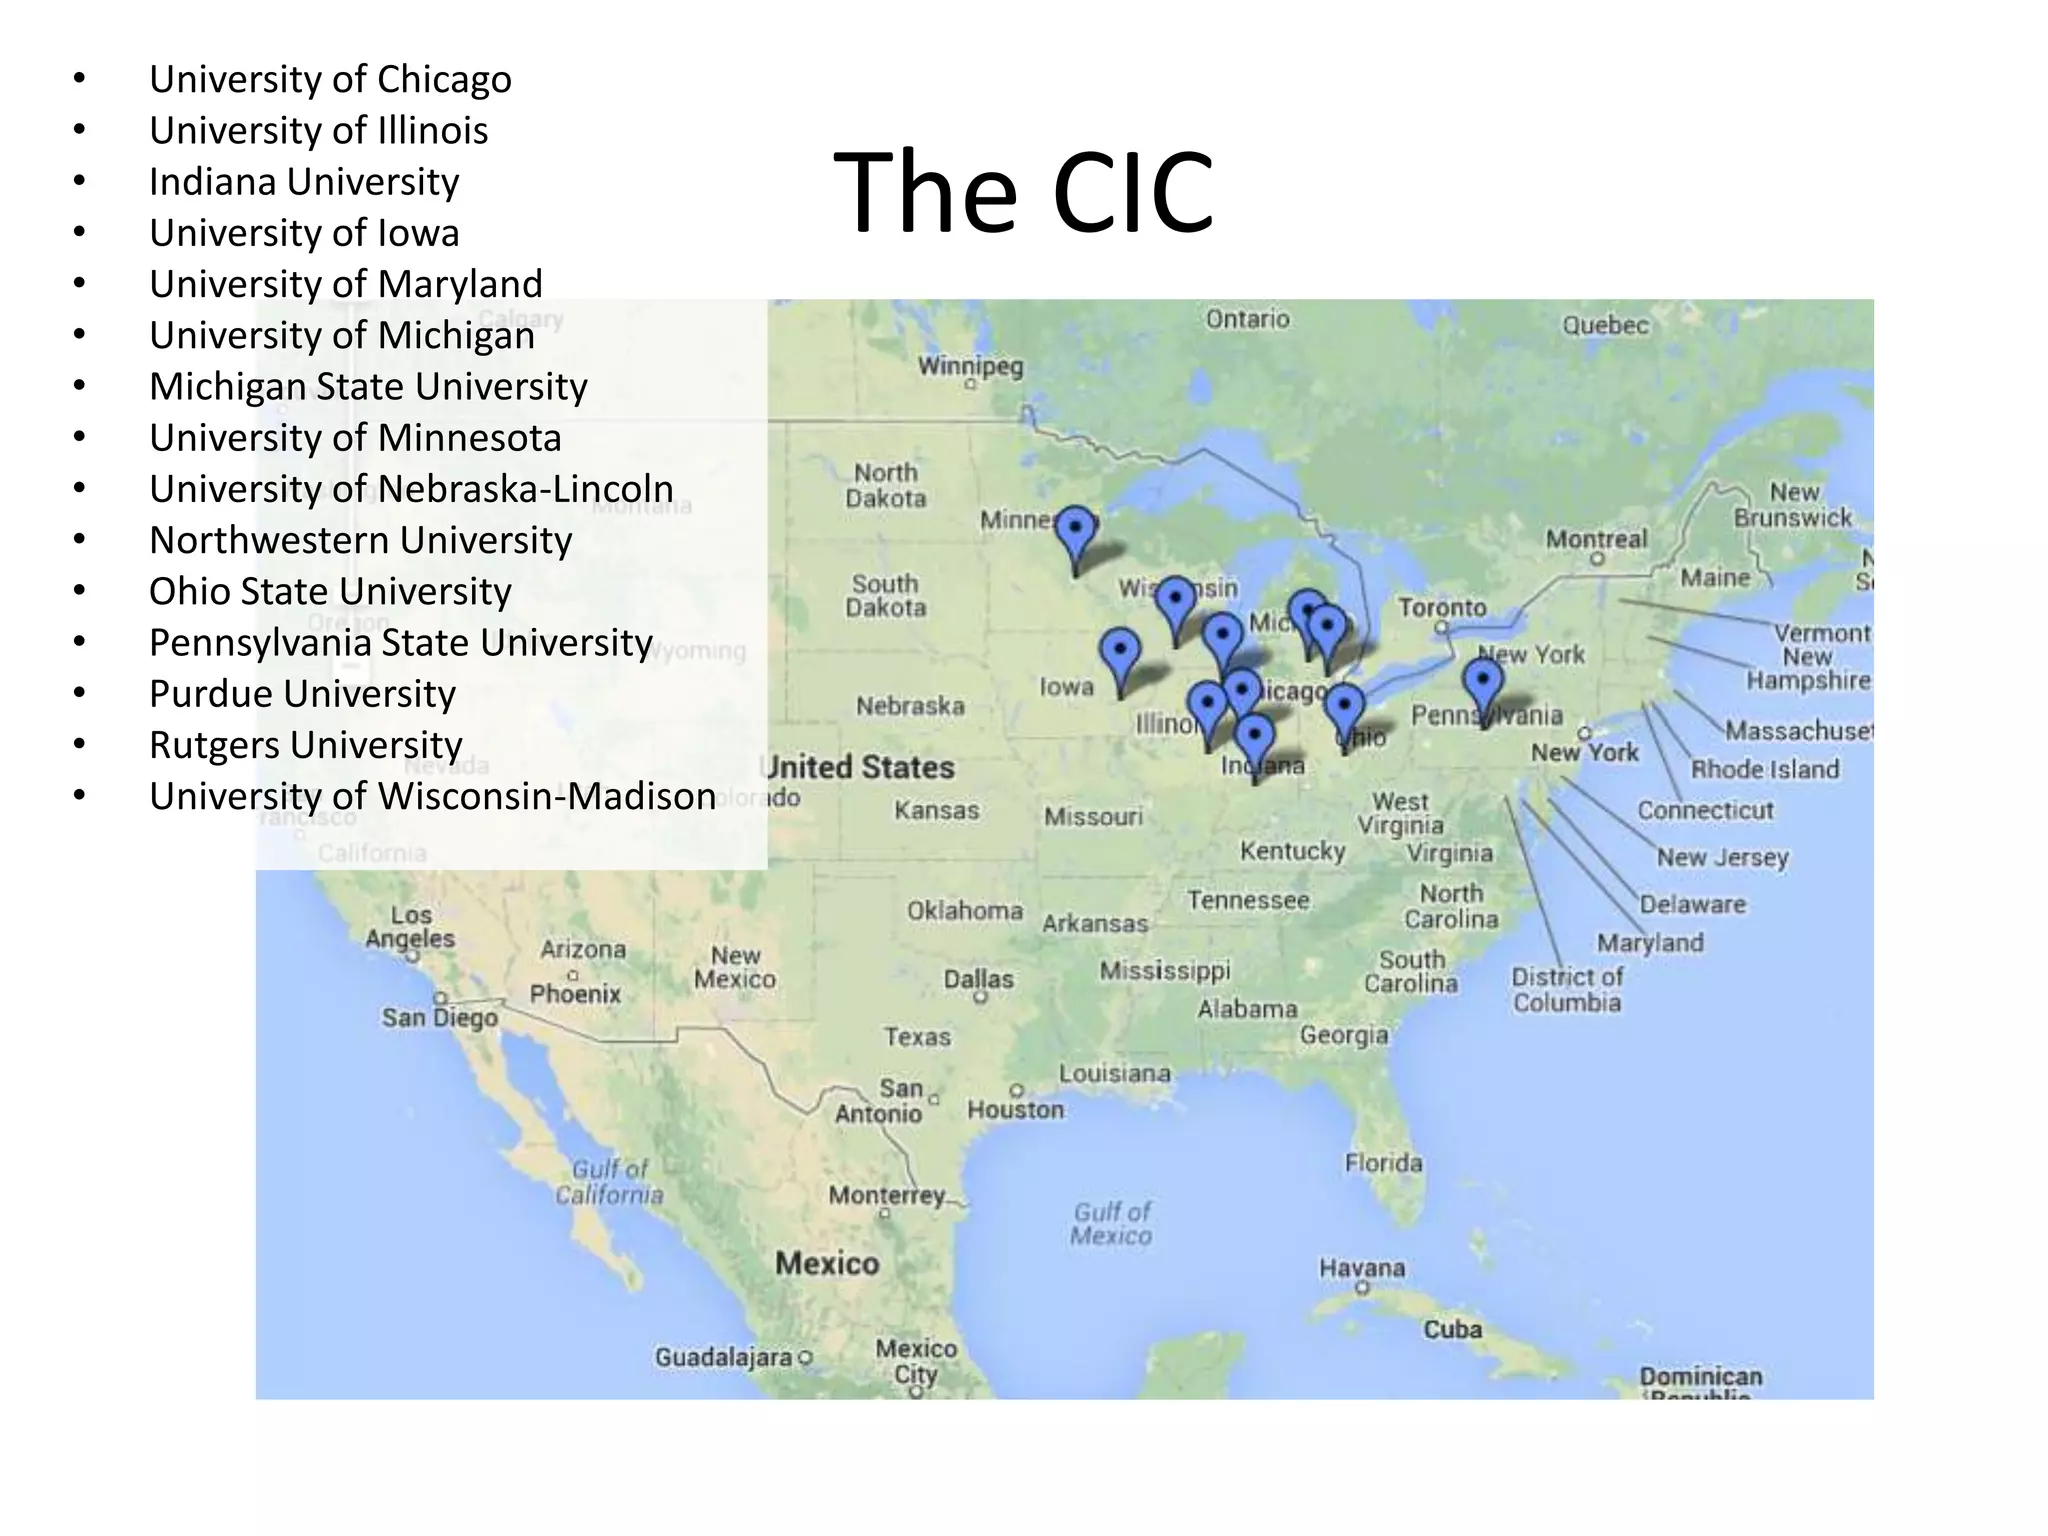
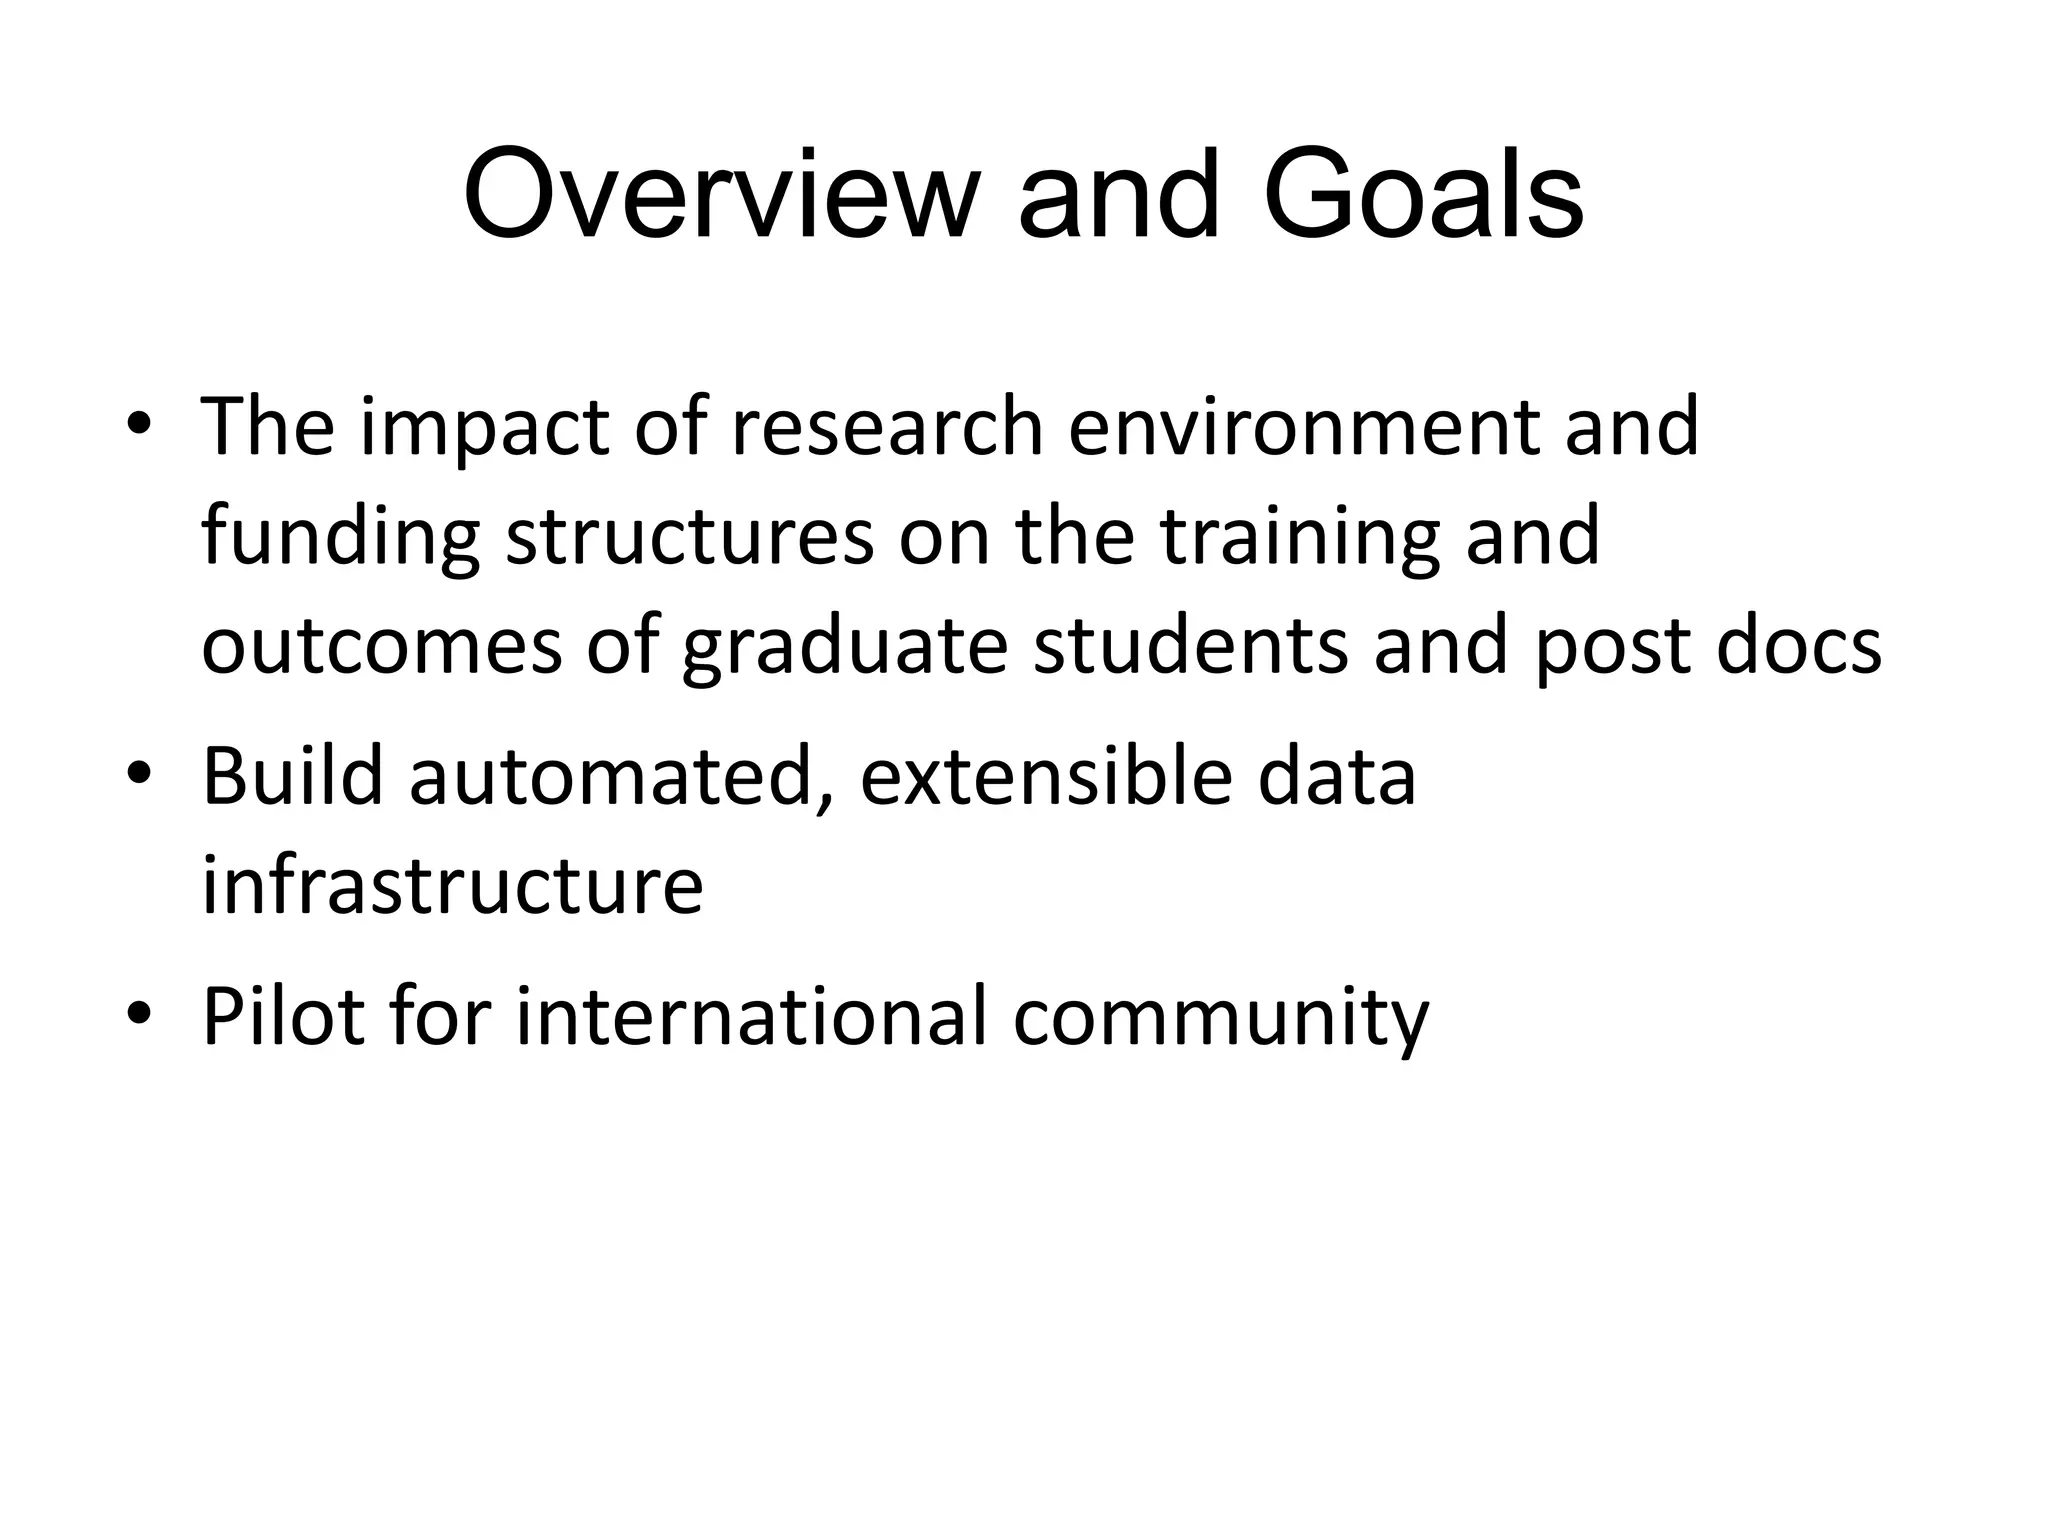
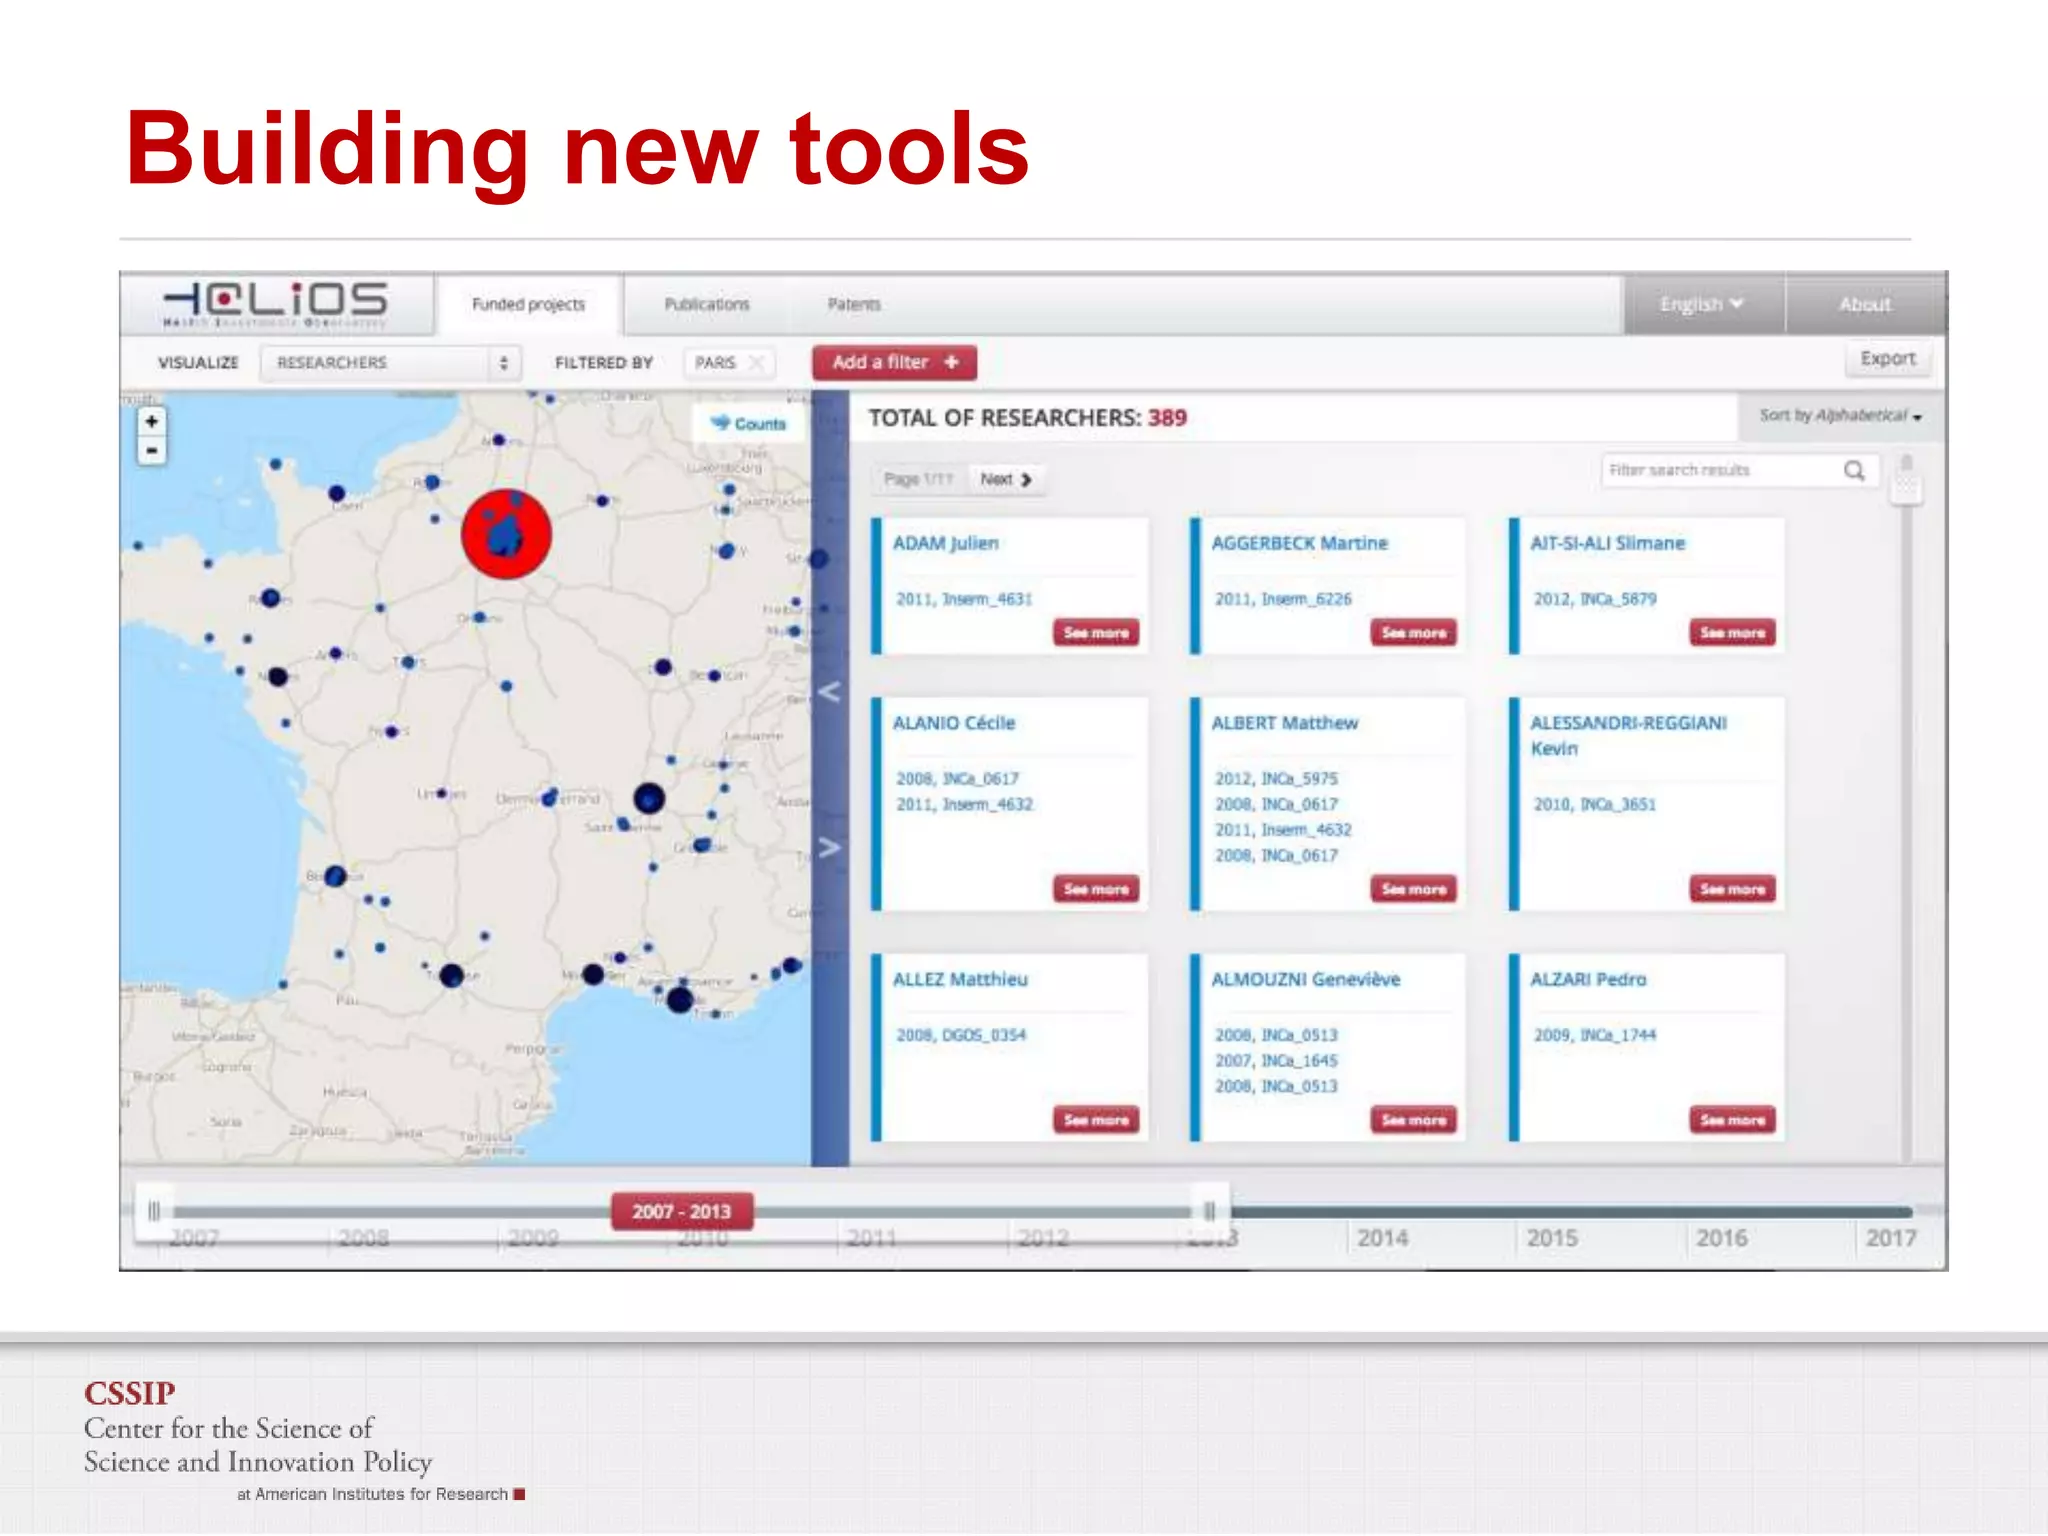
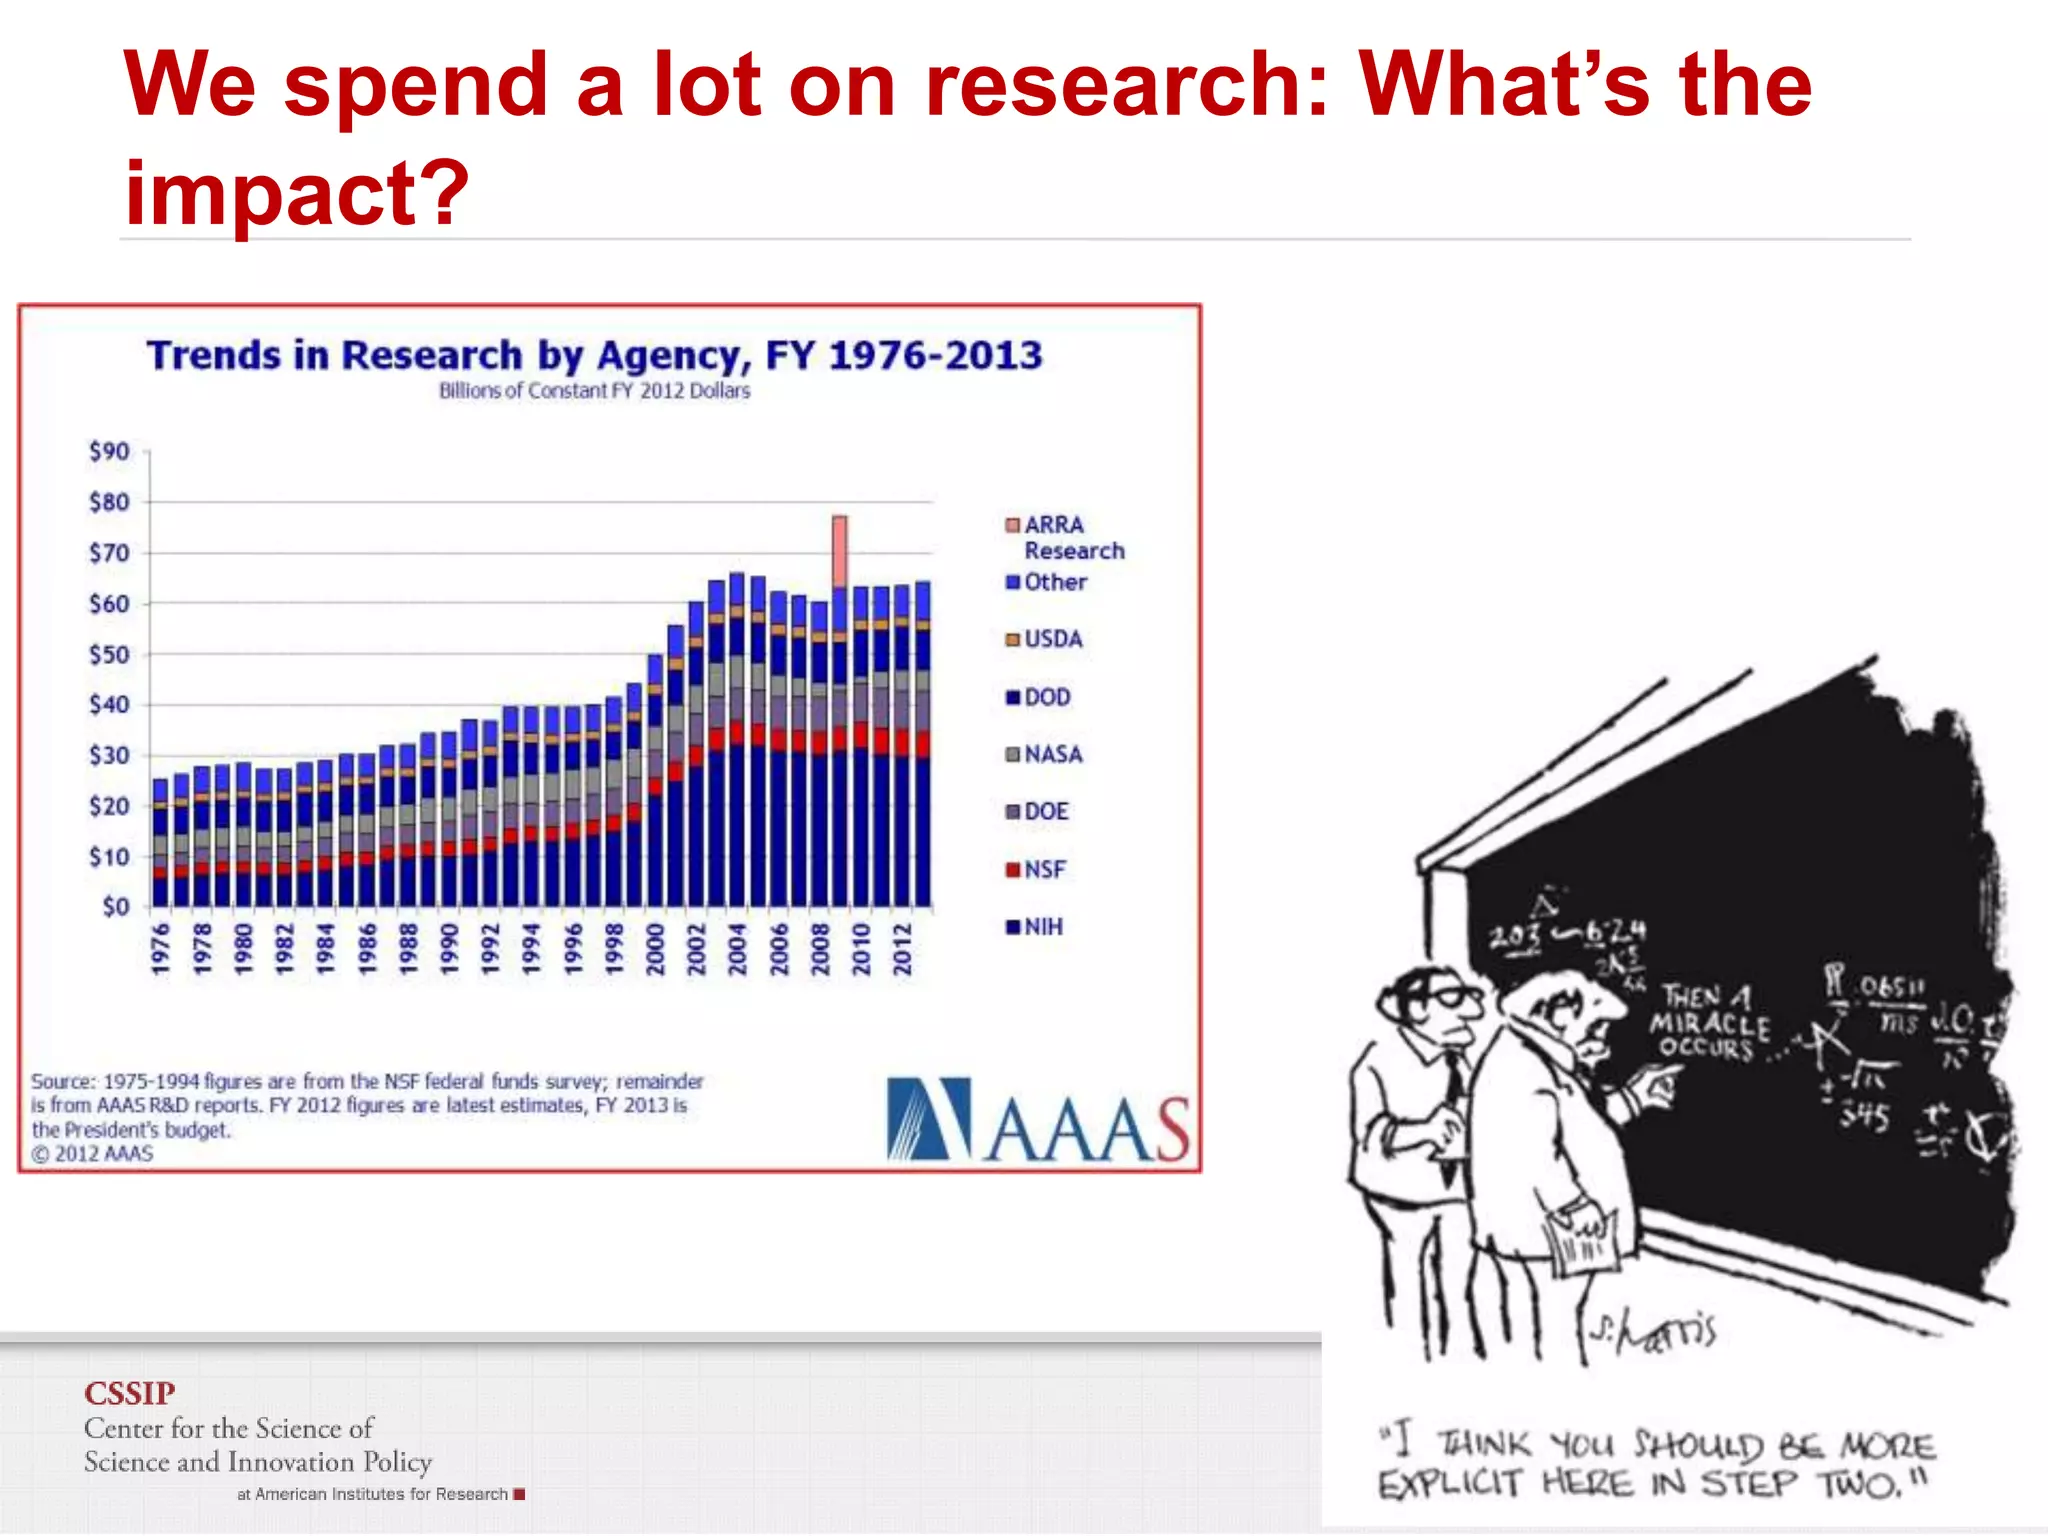
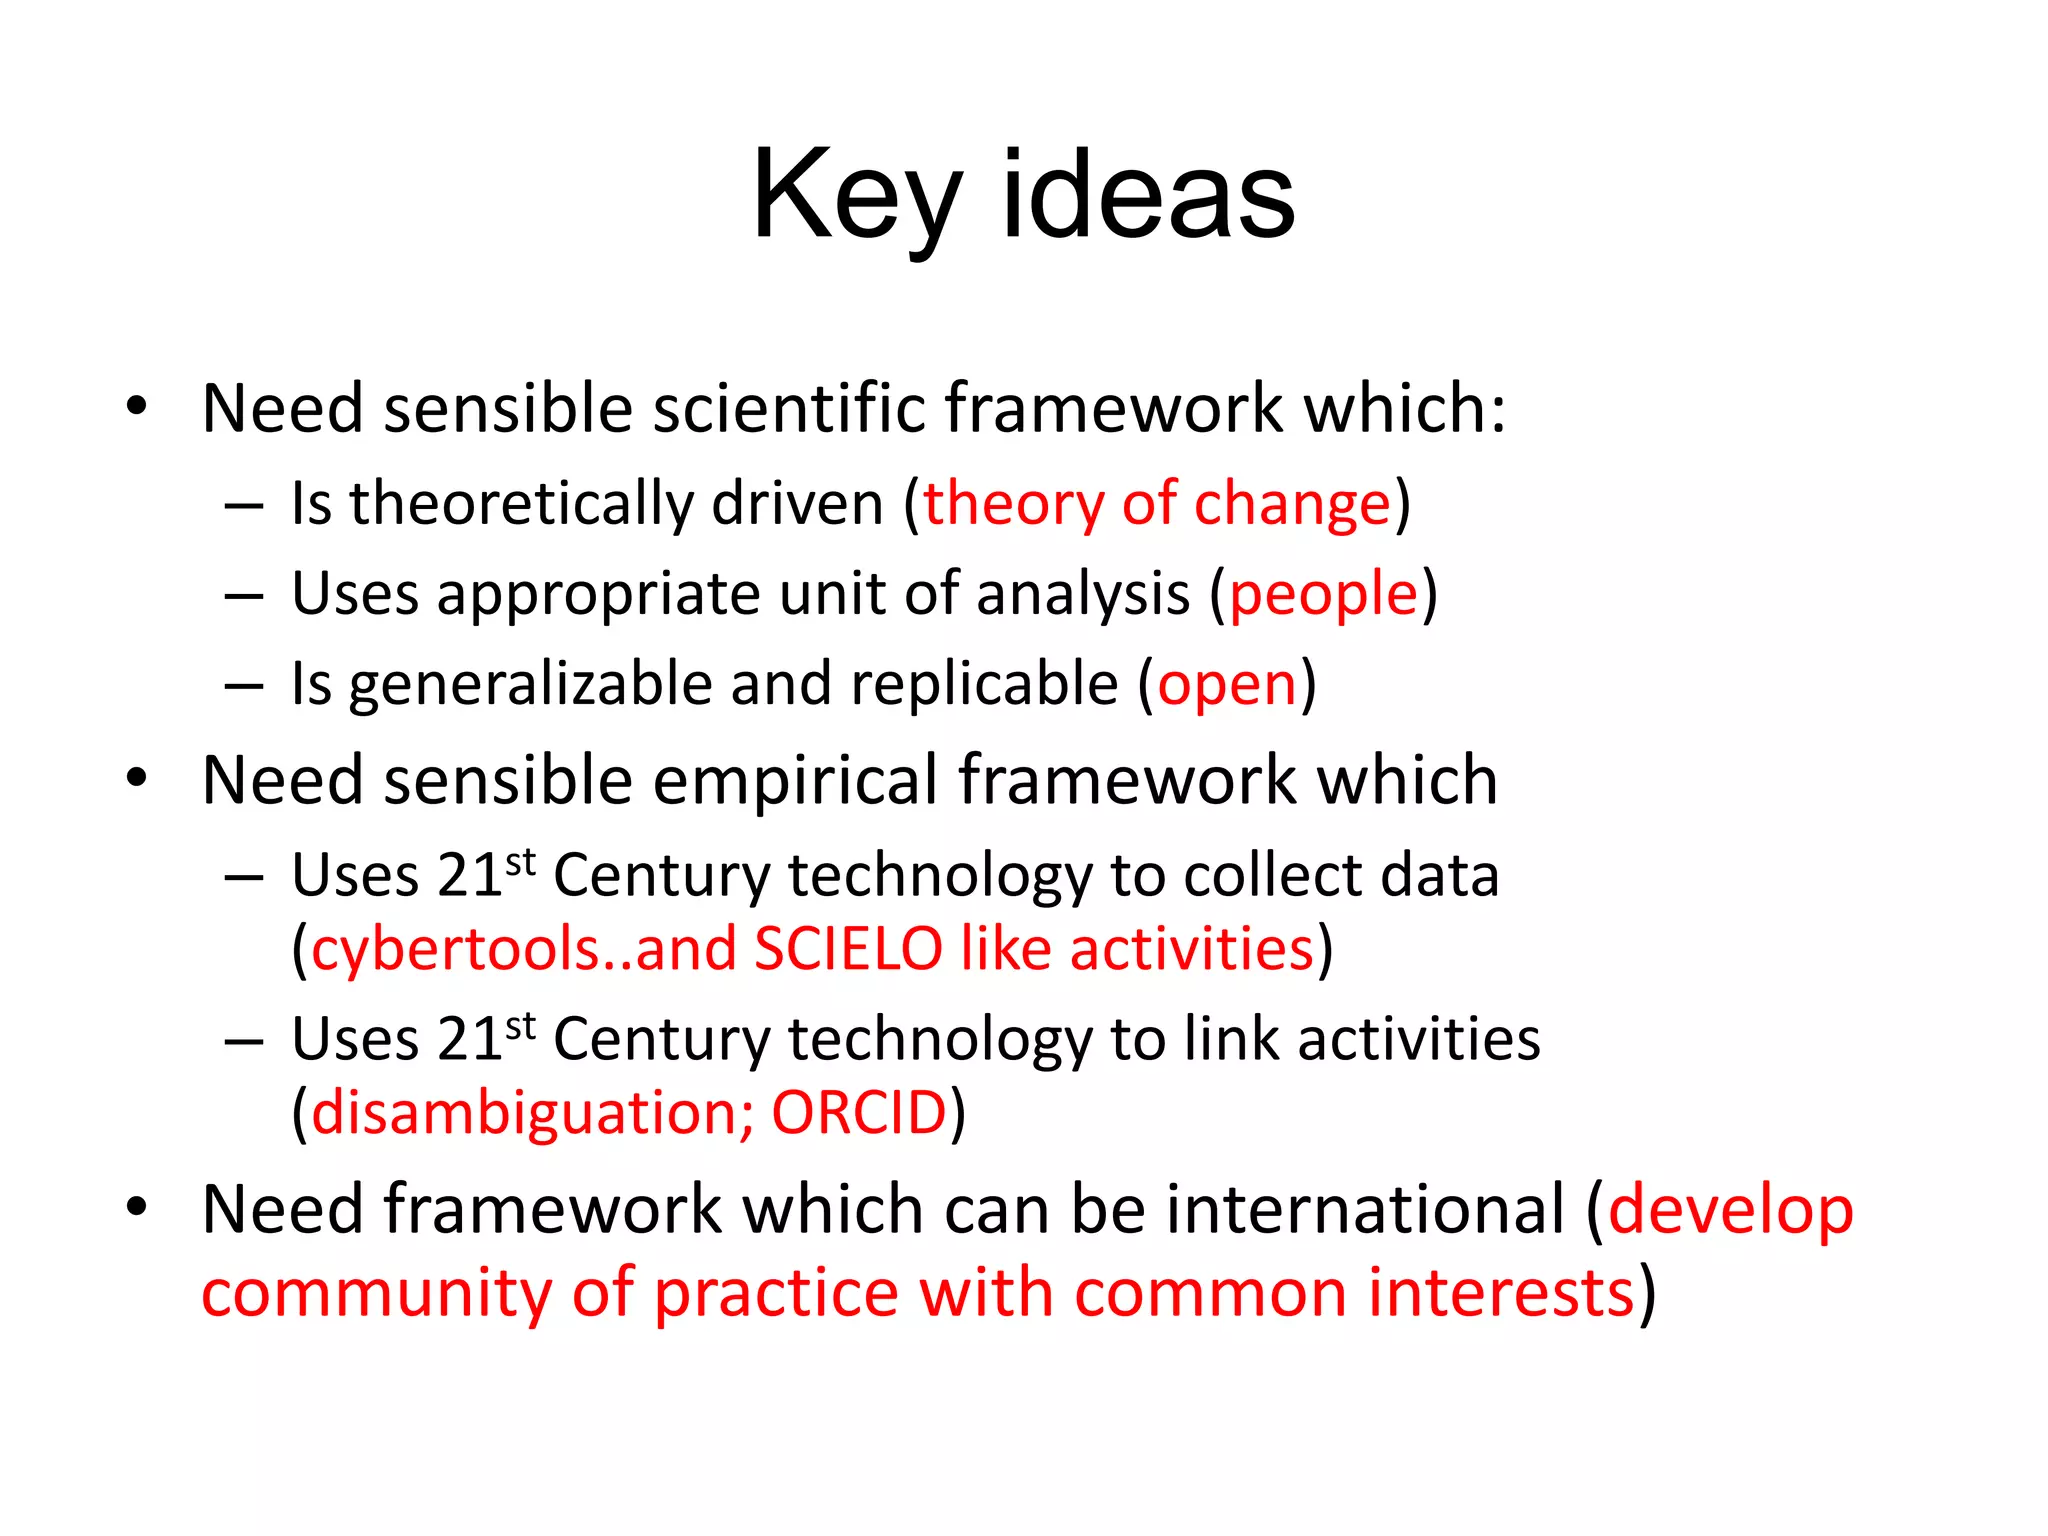
A scientific framework to
measure results of research
investmentsInstitutes of Research,
Julia Lane, American
University of Strasbourg and University of
Melbourne
And many colleagues
Key ideas
• Need sensible scientific framework which:
– Is theoretically driven
– Uses appropriate unit of analysis
– Is generalizable and replicable

• Need sensible empirical framework which
– Uses 21st Century technology to collect data
– Uses 21st Century technology to link activities

• Need framework which can be international
Outline
•
•
•
•

Motivation
Conceptual Framework
Empirical Frameworks
Next steps
Motivation
The President recently asked his Cabinet to
carry out an aggressive management agenda
for his second term that delivers a smarter,
more innovative, and more accountable
government for citizens. An important
component of that effort is strengthening
agencies' abilities to continually improve
program performance by applying existing
evidence about what works, generating new
knowledge, and using experimentation and
innovation to test new approaches to
program delivery.
Motivation
How much should a nation spend on science? What kind of science?
How much from private versus public sectors? Does demand for
funding by potential science performers imply a shortage of funding or
a surfeit of performers?......A new “science of science policy” is
emerging, and it may offer more compelling guidance for policy
decisions and for more credible advocacy
We spend a lot on research: What’s the
impact?
Classic Questions for Measuring
Impact
• What is the impact or causal effect
of a program on outcome of
interest?
• Is a given program effective
compared to the absence of the
program?
• When a program can be
implemented in several ways, which
one is the most effective?
Classic Example: Measuring Impact

Illustration of swan-necked flask experiment used by Louis Pasteur to test the hypothesis of
spontaneous generation
Classic Challenge: Theory of
Change
Key ideas
• Need sensible scientific framework which:
– Is theoretically driven (theory of change)
– Uses appropriate unit of analysis (people)
– Is generalizable and replicable (open)
Outline
•
•
•
•

Motivation
Conceptual Framework
Empirical Frameworks
Next steps
The Theory of Change
Classic Challenge: Theory of
Change
Writing the Framework Down
• (1) Yit(1) = Yit(2)α + Xit(1)λ + εit
• (2) Yit(2) = Zitβ +Xit(2)μ + ηit
where the subscripts i and t denote project teams and quarters
ε and η stand for unobserved factors, serendipity and errors of
measurement and specification (and can possibly include individual
unobserved project teams’ characteristics).

The output variables are measured by Y(1) and research
collaboration variables by Y(2).
Both are determined by a set of control variables X(1) and X(2) that
can overlap and be truly exogenous or predetermined variables of
key interest Z (funding).
Source: Jason Owen Smith
Outline
•
•
•
•

Approach: Doing an Evaluation
Conceptual Framework
Empirical Framework
Next steps
STAR METRICS approach
• Level 1: Document the levels and trends in the
scientific workforce supported by federal
funding.

• Level 2: Develop an open automated data
infrastructure and tools that will enable the
documentation and analysis of a subset of the
inputs, outputs, and outcomes resulting from
federal investments in science.
STAR
Pilot
Project

Institution

STAR

Agency Budget
Award

Acquisition
And Analysis

Agency
Record

Direct
Benefit
Analysis

Award
State
Funding

Institution

Endowment
Funding
Papers

Financial System
Disbursement

Intellectual
Property
Benefit
Analysis

Research
Project
Patents

HR System

Procurement
System

Subcontracting
System

Personnel

Vendor

Contractor

Buy

Start-Up

Engage

Hire

Jobs,
Purchases,
Contracts
Benefit
Analysis

Detailed
Characterization
and
Summary

Existing
Institutional
Reporting
Download
State

Innovation
Analysis
Automated Data Construction
• Most data efforts focus on hand-curated data
• Scalable, Low cost / burden: Algorithmically
link researchers to their support (grants) 
scientific output (publications and citations)
 technological products (patents and drug
approvals)  Impacts (Health, economy,
productivity)
• Link to linked employee / employer data
• Probabilistic matches
The Theory of Change
Key ideas
• Need sensible empirical framework which
– Uses 21st Century technology to collect data
(cybertools..and SCIELO like activities)
– Uses 21st Century technology to link activities
(disambiguation; ORCID)
Example in practice: CalTech Project
• Funded by Sloan Foundation
• Goals
– Use STAR METRICS Level I data to examine production
of science at project, PI and lab level
– Interview Caltech PIs to get qualitative grounding
– Begin to build STAR METRICS Level 2 data linking
PEOPLE to results: publications, patents, altmetrics,
dissertations, and Census data on student placements,
firm startups etc
– Make source code and database infrastructure
available to all STAR METRICS institutions
Award Funding for one researcher
12

10

8

Ongoing awards
6

New awards
Ongoing awards
New awards

4

2

2012

2011

2010

2009

2008

2007

2006

2005

2004

2003

2002

2001

2000

0
Lab staffing
120

100

Undergraduate

80

Technician / Staff scientist
Research

60

Research Analyst
Faculty
40

Post-Doc
Graduate Students

20

2012

2011

2010

2009

2008

2007

2006

2005

2004

2003

0
Vendor Expenditures on one project
Industry

Expenditures

Number of transactions

3386.36

121

36

1

896.12

4

Commercial Banking

4616

2

Testing Laboratories

8312.92

100

Pharmaceutical Preparation Manufacturing

629.63

12

Biological Product (except Diagnostic) M

2480.45

37

Electrometallurgical Ferroalloy Product

189.8

8

Electronic Computer Manufacturing

6831.41

49

Semiconductor and Related Device Manufac

3672.51

73

Analytical Laboratory Instrument Manufac

61464.87

49

Scheduled Passenger Air Transportation

5892.79

19

Passenger car rental

1015.28

8

Research and development in the physical

1654.88

38

Colleges, Universities, and Professional

-110.88

1

Other Professional Equipment and Supplie
Rail transportation
Scenic and Sightseeing Transportation, L
2012

2011

2010

2009

2008

2007

2006

2005

2004

2003

2002

2001

2000

Publications of researcher
12

10

8

6

4

2

0
0
2…

2…

2…

2…

2…

2…

2…

2…

2…

2…

2…

2…

2…

N. of Theses

PHD Theses Supervised

6

5

4

3

2

1
Patents for same researcher
USPTO Patents

EPO Patents

n_pat_uspto

n_pat_uspto

n_pat

n_pat

2012

2011

2010

2009

2008

2007

2006

2005

2004

2003

2002

0
2001

0

2000

0.5

2012

0.5

2011

1

2010

1

2009

1.5

2008

1.5

2007

2

2006

2

2005

2.5

2004

2.5

2003

3

2002

3

2001

3.5

2000

3.5
New research: Exploratory
regressions
Y (outputs) can be expanded
• Currently Y is just publications, patents, PhD
students
• Census interest suggests we can develop
additional economic outcomes:
– Wages and career trajectories for postdocs/grad.
Students
– Firm startups, growth and productivity

• And..substantial competence in SciSIP community
in building out science and social outcomes
Use data to estimate production
functions at project level
VARIABLES

Pubs

Patents

PhDs

Patents

PhDs

0.057***

Award expenditures

Pubs

0.0018

0.0093**

Labor inputs

0.19***

0.056***

0.10***

0.12***

0.053***

0.089***

Share post-doc

0.43**

-0.071

-0.078

0.23

-0.077

-0.11

Share PhD

0.072

-0.023

0.27***

-0.14

-0.030

0.23***

Equipments

0.010

0.00055

0.0029

-0.015

-0.00024

-0.0011

Share computer

-0.36

-0.042

-0.25

-0.41

-0.044

-0.26

Share optics

-0.21

0.68**

0.22

0.016

0.68**

0.26

seniority

-0.0098***

-0.00081

0.00014

-0.010***

-0.00083

0.000030

Full Prof.

0.081

0.027

0.072**

0.054

0.026

0.068**

0.94***

-0.018

-0.10

0.71**

-0.026

-0.14

harvard

-0.026

-0.041

-0.0024

-0.069

-0.042

-0.0095

mit

0.065

0.092

-0.00068

0.051

0.091

-0.0030

caltech

0.23**

0.028

0.046

0.21**

0.027

0.043

physics

0.26***

-0.047

0.0047

0.22***

-0.048

-0.0017

chemistry

0.40***

0.064

0.17**

0.38***

0.063

0.17**

engineering

0.60***

0.030

0.22***

0.59***

0.030

0.22***

Calendar year dummies

yes

yes

yes

yes

yes

yes

Constant

0.11

-0.021

-0.16***

0.018

-0.024

-0.17***

Observations

2,590

2,590

2,590

2,590

2,590

2,590

R-squared

0.321

0.084

0.205

0.365

0.084

0.210

Share ARRA

Robust standard errors in parentheses

Note: Same approach as that used to derive widely accepted result that R&D generated more than
half of US productivity growth in the 1990’s; these data preliminary and not to be cited
Next example: CIC Activity Now
building out across multiple
universities and frames

Bruce Weinberg, OSU
•
•
•
•
•
•
•
•
•
•
•
•
•
•
•

University of Chicago
University of Illinois
Indiana University
University of Iowa
University of Maryland
University of Michigan
Michigan State University
University of Minnesota
University of Nebraska-Lincoln
Northwestern University
Ohio State University
Pennsylvania State University
Purdue University
Rutgers University
University of Wisconsin-Madison

The CIC
STEM Workforce Training:
A Quasi-Experimental Approach
Using the Effects of Research
Funding
Joint with Bruce Weinberg, Vetle Torvik, Lee
Giles and Chris Morphew
Overview and Goals
• The impact of research environment and
funding structures on the training and
outcomes of graduate students and post docs
• Build automated, extensible data
infrastructure
• Pilot for international community
Data Structure
CIC STAR METRICS Data
(Grants/Labs / Teams;
Sample)
Web,
Algorithmic
Disambiguation,
Microsoft
Academic
(Pubs, Patents,
Cites, Grants)

LEHD
(Employment,
wages w/in US)

SED
(Chars, Initia
l outcomes)
Econometric Models
Identification
• Relate outcomes to length of training, team, and
funding structure
• ARRA funding as “experiment” to shift length of
training
– Lightly Reviewed Grants
– Supplements to Existing Grants
– Payline Extension Granst

• Also, presumably, shift teams toward postdocs
• Get returns to time in training under different
team and funding structures
Probability
of
Funding

Figure 2. Research Design for Payline Extension.

Unlikely
to be
Funded
even with
ARRA

Proposed Project “Quality”

Likely
Funded
only
under
ARRA

Extended
ARRA
Payline

Likely
Funded
even
without
ARRA

NonARRA
Payline
Possible Analyses
• Estimate how training environment affects
retention in US, sector of employment, wages
• Estimate how flows of trainees to companies
affects productivity
• Measure impact on innovation by linking text
of patents to the research done in the labs
where people trained
• Open the knowledge transfer black box and
estimate returns to training
What are the results of research
(internationally)
ASTRA (Australia)
HELIOS (France)
CAELIS (Czech Republic)
NORDSJTERNEN (Norway)
STELLAR (Germany)
TRICS (UK)
SOLES (SPAIN)
Building new tools
We spend a lot on research: What’s the
impact?
Key ideas
• Need sensible scientific framework which:
– Is theoretically driven (theory of change)
– Uses appropriate unit of analysis (people)
– Is generalizable and replicable (open)

• Need sensible empirical framework which
– Uses 21st Century technology to collect data
(cybertools..and SCIELO like activities)
– Uses 21st Century technology to link activities
(disambiguation; ORCID)

• Need framework which can be international (develop
community of practice with common interests)
Thank you!
Julia Lane
www.julialane.org
www.cssip.org

A scientific framework to measure results of research investments

  • 1.
    A scientific frameworkto measure results of research investmentsInstitutes of Research, Julia Lane, American University of Strasbourg and University of Melbourne And many colleagues
  • 2.
    Key ideas • Needsensible scientific framework which: – Is theoretically driven – Uses appropriate unit of analysis – Is generalizable and replicable • Need sensible empirical framework which – Uses 21st Century technology to collect data – Uses 21st Century technology to link activities • Need framework which can be international
  • 3.
  • 4.
    Motivation The President recentlyasked his Cabinet to carry out an aggressive management agenda for his second term that delivers a smarter, more innovative, and more accountable government for citizens. An important component of that effort is strengthening agencies' abilities to continually improve program performance by applying existing evidence about what works, generating new knowledge, and using experimentation and innovation to test new approaches to program delivery.
  • 5.
    Motivation How much shoulda nation spend on science? What kind of science? How much from private versus public sectors? Does demand for funding by potential science performers imply a shortage of funding or a surfeit of performers?......A new “science of science policy” is emerging, and it may offer more compelling guidance for policy decisions and for more credible advocacy
  • 6.
    We spend alot on research: What’s the impact?
  • 7.
    Classic Questions forMeasuring Impact • What is the impact or causal effect of a program on outcome of interest? • Is a given program effective compared to the absence of the program? • When a program can be implemented in several ways, which one is the most effective?
  • 8.
    Classic Example: MeasuringImpact Illustration of swan-necked flask experiment used by Louis Pasteur to test the hypothesis of spontaneous generation
  • 9.
  • 10.
    Key ideas • Needsensible scientific framework which: – Is theoretically driven (theory of change) – Uses appropriate unit of analysis (people) – Is generalizable and replicable (open)
  • 11.
  • 12.
  • 13.
  • 14.
    Writing the FrameworkDown • (1) Yit(1) = Yit(2)α + Xit(1)λ + εit • (2) Yit(2) = Zitβ +Xit(2)μ + ηit where the subscripts i and t denote project teams and quarters ε and η stand for unobserved factors, serendipity and errors of measurement and specification (and can possibly include individual unobserved project teams’ characteristics). The output variables are measured by Y(1) and research collaboration variables by Y(2). Both are determined by a set of control variables X(1) and X(2) that can overlap and be truly exogenous or predetermined variables of key interest Z (funding).
  • 15.
  • 16.
    Outline • • • • Approach: Doing anEvaluation Conceptual Framework Empirical Framework Next steps
  • 17.
    STAR METRICS approach •Level 1: Document the levels and trends in the scientific workforce supported by federal funding. • Level 2: Develop an open automated data infrastructure and tools that will enable the documentation and analysis of a subset of the inputs, outputs, and outcomes resulting from federal investments in science.
  • 18.
    STAR Pilot Project Institution STAR Agency Budget Award Acquisition And Analysis Agency Record Direct Benefit Analysis Award State Funding Institution Endowment Funding Papers FinancialSystem Disbursement Intellectual Property Benefit Analysis Research Project Patents HR System Procurement System Subcontracting System Personnel Vendor Contractor Buy Start-Up Engage Hire Jobs, Purchases, Contracts Benefit Analysis Detailed Characterization and Summary Existing Institutional Reporting Download State Innovation Analysis
  • 19.
    Automated Data Construction •Most data efforts focus on hand-curated data • Scalable, Low cost / burden: Algorithmically link researchers to their support (grants)  scientific output (publications and citations)  technological products (patents and drug approvals)  Impacts (Health, economy, productivity) • Link to linked employee / employer data • Probabilistic matches
  • 20.
  • 21.
    Key ideas • Needsensible empirical framework which – Uses 21st Century technology to collect data (cybertools..and SCIELO like activities) – Uses 21st Century technology to link activities (disambiguation; ORCID)
  • 22.
    Example in practice:CalTech Project • Funded by Sloan Foundation • Goals – Use STAR METRICS Level I data to examine production of science at project, PI and lab level – Interview Caltech PIs to get qualitative grounding – Begin to build STAR METRICS Level 2 data linking PEOPLE to results: publications, patents, altmetrics, dissertations, and Census data on student placements, firm startups etc – Make source code and database infrastructure available to all STAR METRICS institutions
  • 23.
    Award Funding forone researcher 12 10 8 Ongoing awards 6 New awards Ongoing awards New awards 4 2 2012 2011 2010 2009 2008 2007 2006 2005 2004 2003 2002 2001 2000 0
  • 24.
    Lab staffing 120 100 Undergraduate 80 Technician /Staff scientist Research 60 Research Analyst Faculty 40 Post-Doc Graduate Students 20 2012 2011 2010 2009 2008 2007 2006 2005 2004 2003 0
  • 25.
    Vendor Expenditures onone project Industry Expenditures Number of transactions 3386.36 121 36 1 896.12 4 Commercial Banking 4616 2 Testing Laboratories 8312.92 100 Pharmaceutical Preparation Manufacturing 629.63 12 Biological Product (except Diagnostic) M 2480.45 37 Electrometallurgical Ferroalloy Product 189.8 8 Electronic Computer Manufacturing 6831.41 49 Semiconductor and Related Device Manufac 3672.51 73 Analytical Laboratory Instrument Manufac 61464.87 49 Scheduled Passenger Air Transportation 5892.79 19 Passenger car rental 1015.28 8 Research and development in the physical 1654.88 38 Colleges, Universities, and Professional -110.88 1 Other Professional Equipment and Supplie Rail transportation Scenic and Sightseeing Transportation, L
  • 26.
  • 27.
  • 28.
    Patents for sameresearcher USPTO Patents EPO Patents n_pat_uspto n_pat_uspto n_pat n_pat 2012 2011 2010 2009 2008 2007 2006 2005 2004 2003 2002 0 2001 0 2000 0.5 2012 0.5 2011 1 2010 1 2009 1.5 2008 1.5 2007 2 2006 2 2005 2.5 2004 2.5 2003 3 2002 3 2001 3.5 2000 3.5
  • 29.
  • 30.
    Y (outputs) canbe expanded • Currently Y is just publications, patents, PhD students • Census interest suggests we can develop additional economic outcomes: – Wages and career trajectories for postdocs/grad. Students – Firm startups, growth and productivity • And..substantial competence in SciSIP community in building out science and social outcomes
  • 31.
    Use data toestimate production functions at project level VARIABLES Pubs Patents PhDs Patents PhDs 0.057*** Award expenditures Pubs 0.0018 0.0093** Labor inputs 0.19*** 0.056*** 0.10*** 0.12*** 0.053*** 0.089*** Share post-doc 0.43** -0.071 -0.078 0.23 -0.077 -0.11 Share PhD 0.072 -0.023 0.27*** -0.14 -0.030 0.23*** Equipments 0.010 0.00055 0.0029 -0.015 -0.00024 -0.0011 Share computer -0.36 -0.042 -0.25 -0.41 -0.044 -0.26 Share optics -0.21 0.68** 0.22 0.016 0.68** 0.26 seniority -0.0098*** -0.00081 0.00014 -0.010*** -0.00083 0.000030 Full Prof. 0.081 0.027 0.072** 0.054 0.026 0.068** 0.94*** -0.018 -0.10 0.71** -0.026 -0.14 harvard -0.026 -0.041 -0.0024 -0.069 -0.042 -0.0095 mit 0.065 0.092 -0.00068 0.051 0.091 -0.0030 caltech 0.23** 0.028 0.046 0.21** 0.027 0.043 physics 0.26*** -0.047 0.0047 0.22*** -0.048 -0.0017 chemistry 0.40*** 0.064 0.17** 0.38*** 0.063 0.17** engineering 0.60*** 0.030 0.22*** 0.59*** 0.030 0.22*** Calendar year dummies yes yes yes yes yes yes Constant 0.11 -0.021 -0.16*** 0.018 -0.024 -0.17*** Observations 2,590 2,590 2,590 2,590 2,590 2,590 R-squared 0.321 0.084 0.205 0.365 0.084 0.210 Share ARRA Robust standard errors in parentheses Note: Same approach as that used to derive widely accepted result that R&D generated more than half of US productivity growth in the 1990’s; these data preliminary and not to be cited
  • 33.
    Next example: CICActivity Now building out across multiple universities and frames Bruce Weinberg, OSU
  • 34.
    • • • • • • • • • • • • • • • University of Chicago Universityof Illinois Indiana University University of Iowa University of Maryland University of Michigan Michigan State University University of Minnesota University of Nebraska-Lincoln Northwestern University Ohio State University Pennsylvania State University Purdue University Rutgers University University of Wisconsin-Madison The CIC
  • 35.
    STEM Workforce Training: AQuasi-Experimental Approach Using the Effects of Research Funding Joint with Bruce Weinberg, Vetle Torvik, Lee Giles and Chris Morphew
  • 36.
    Overview and Goals •The impact of research environment and funding structures on the training and outcomes of graduate students and post docs • Build automated, extensible data infrastructure • Pilot for international community
  • 37.
    Data Structure CIC STARMETRICS Data (Grants/Labs / Teams; Sample) Web, Algorithmic Disambiguation, Microsoft Academic (Pubs, Patents, Cites, Grants) LEHD (Employment, wages w/in US) SED (Chars, Initia l outcomes)
  • 38.
  • 39.
    Identification • Relate outcomesto length of training, team, and funding structure • ARRA funding as “experiment” to shift length of training – Lightly Reviewed Grants – Supplements to Existing Grants – Payline Extension Granst • Also, presumably, shift teams toward postdocs • Get returns to time in training under different team and funding structures
  • 40.
    Probability of Funding Figure 2. ResearchDesign for Payline Extension. Unlikely to be Funded even with ARRA Proposed Project “Quality” Likely Funded only under ARRA Extended ARRA Payline Likely Funded even without ARRA NonARRA Payline
  • 41.
    Possible Analyses • Estimatehow training environment affects retention in US, sector of employment, wages • Estimate how flows of trainees to companies affects productivity • Measure impact on innovation by linking text of patents to the research done in the labs where people trained • Open the knowledge transfer black box and estimate returns to training
  • 42.
    What are theresults of research (internationally) ASTRA (Australia) HELIOS (France) CAELIS (Czech Republic) NORDSJTERNEN (Norway) STELLAR (Germany) TRICS (UK) SOLES (SPAIN)
  • 43.
  • 44.
    We spend alot on research: What’s the impact?
  • 45.
    Key ideas • Needsensible scientific framework which: – Is theoretically driven (theory of change) – Uses appropriate unit of analysis (people) – Is generalizable and replicable (open) • Need sensible empirical framework which – Uses 21st Century technology to collect data (cybertools..and SCIELO like activities) – Uses 21st Century technology to link activities (disambiguation; ORCID) • Need framework which can be international (develop community of practice with common interests)
  • 46.