The document presents a new algorithm for measuring pulse transit time (PTT) from electrocardiogram (ECG) and photoplethysmogram (PPG) signals, which serves as a direct indicator of cardiovascular health. The algorithm demonstrates high sensitivity and accuracy in detecting key points of the ECG and PPG signals, achieving an average sensitivity of 97.5% for R-peak detection and 98.33% for PPG-foot detection. The study underscores the importance of timely PTT evaluation in preventing cardiovascular diseases.
![International Journal of Biomedical Engineering and Science (IJBES), Vol. 10, No. 1, January 2023
DOI: 10.5121/ijbes.2023.10101 1
A NEW ALGORITHM FOR MEASURING PULSE
TRANSIT TIME FROM ECG AND PPG SIGNALS
Radjef Lilia and Omari Tahar
Department of Electrical Engineering Systems,
Boumerdes University, Boumerdes, Algeria
ABSTRACT
Pulse transit Time (PTT) is a physiological parameter that is based on characteristics of the
pulse waveform, a direct indicator of Cardiovascular Diseases (CVD). The (PTT) is defined as
the time taken for the arterial pulse to travel from the heart to a peripheral site. It is commonly
derived from Electrocardiogram (ECG) and Photoplethysmogram (PPG) signal calculations
and is calculated as the interval between the peak of the electrocardiogram (ECG) R-wave and
a time point on the photoplethysmogram (PPG). In this study, we propose a new and low-
complexity algorithm for the Pulse transit time (PTT) measurement, using these two signals and
detecting (PTT- foot) and (PTT- peak). We built a 37 subjects dataset containing a simultaneous
recording of the (ECG) and (PPG). The calculation of (PTT) consists of detecting the peak and
foot points of a (PPG) and the R-peak of the (ECG) signal. Intermediate operations such as
normalization and thresholding to detect the local maxima and minima, are processed on noisy
signals, this algorithm is improved by a windowing temporal analysis. The obtained results are
promising for the first step. The average sensitivity (SEN) and accuracy (ACC) obtained were
(97.5%, and 96.82%) respectively for R-peaks detection and respectively (97.77%, and 97.64%)
for (PPG-peak) detection. The sensitivity (SEN) and accuracy (ACC) of (PPG- foot) detection
were (98.33%, and 94.14%).
KEYWORDS
Pulse transit time (PTT), Cardiovascular Disease (CVD), Electrocardiogram (ECG),
Photoplethysmography (PPG), Algorithm, Peaks detection, Sensitivity (SEN), Accuracy (ACC).
1. INTRODUCTION
The World Health Organization (WHO) estimates that cardiovascular disease is the leading
cause of death in the world. [1, 2, 3]. It is crucial to evaluate pulse transit time (PTT), which is a
direct indicator of cardiovascular (CV) health [4], especially arterial stiffness (AS) [6], vessel
compliance, and blood pressure (BP) [7, 8, 9, 10]. The earliest detection of vascular disease can
be the key to the prevention of cardiovascular diseases. Several definitions of pulse transit time
(PTT) exist. Originally, it refers to the time taken for the pulse wave to travel from a proximal
to a distal point of the arterial tree. It is based on the Moens-Koertweg and Bramwell-Hill
equations [5] and is inversely related to the pulse wave velocity (PWV), which is calculated as
the pulse wave travel distance divided by time. The (PTT) can be measured using pulse wave
transducers placed close together in a homogeneous arterial segment [19] (as shown in Figure
1).](https://image.slidesharecdn.com/anewalgorithmformeasuringpulse-ijbes-240918052845-1842d007/85/A-NEW-ALGORITHM-FOR-MEASURING-PULSE-IJBES-pdf-1-320.jpg)
![International Journal of Biomedical Engineering and Science (IJBES), Vol. 10, No. 1, January 2023
DOI: 10.5121/ijbes.2023.10101 1
A NEW ALGORITHM FOR MEASURING PULSE
TRANSIT TIME FROM ECG AND PPG SIGNALS
Radjef Lilia and Omari Tahar
Department of Electrical Engineering Systems,
Boumerdes University, Boumerdes, Algeria
ABSTRACT
Pulse transit Time (PTT) is a physiological parameter that is based on characteristics of the
pulse waveform, a direct indicator of Cardiovascular Diseases (CVD). The (PTT) is defined as
the time taken for the arterial pulse to travel from the heart to a peripheral site. It is commonly
derived from Electrocardiogram (ECG) and Photoplethysmogram (PPG) signal calculations
and is calculated as the interval between the peak of the electrocardiogram (ECG) R-wave and
a time point on the photoplethysmogram (PPG). In this study, we propose a new and low-
complexity algorithm for the Pulse transit time (PTT) measurement, using these two signals and
detecting (PTT- foot) and (PTT- peak). We built a 37 subjects dataset containing a simultaneous
recording of the (ECG) and (PPG). The calculation of (PTT) consists of detecting the peak and
foot points of a (PPG) and the R-peak of the (ECG) signal. Intermediate operations such as
normalization and thresholding to detect the local maxima and minima, are processed on noisy
signals, this algorithm is improved by a windowing temporal analysis. The obtained results are
promising for the first step. The average sensitivity (SEN) and accuracy (ACC) obtained were
(97.5%, and 96.82%) respectively for R-peaks detection and respectively (97.77%, and 97.64%)
for (PPG-peak) detection. The sensitivity (SEN) and accuracy (ACC) of (PPG- foot) detection
were (98.33%, and 94.14%).
KEYWORDS
Pulse transit time (PTT), Cardiovascular Disease (CVD), Electrocardiogram (ECG),
Photoplethysmography (PPG), Algorithm, Peaks detection, Sensitivity (SEN), Accuracy (ACC).
1. INTRODUCTION
The World Health Organization (WHO) estimates that cardiovascular disease is the leading
cause of death in the world. [1, 2, 3]. It is crucial to evaluate pulse transit time (PTT), which is a
direct indicator of cardiovascular (CV) health [4], especially arterial stiffness (AS) [6], vessel
compliance, and blood pressure (BP) [7, 8, 9, 10]. The earliest detection of vascular disease can
be the key to the prevention of cardiovascular diseases. Several definitions of pulse transit time
(PTT) exist. Originally, it refers to the time taken for the pulse wave to travel from a proximal
to a distal point of the arterial tree. It is based on the Moens-Koertweg and Bramwell-Hill
equations [5] and is inversely related to the pulse wave velocity (PWV), which is calculated as
the pulse wave travel distance divided by time. The (PTT) can be measured using pulse wave
transducers placed close together in a homogeneous arterial segment [19] (as shown in Figure
1).](https://image.slidesharecdn.com/anewalgorithmformeasuringpulse-ijbes-240918052845-1842d007/75/A-NEW-ALGORITHM-FOR-MEASURING-PULSE-IJBES-pdf-1-2048.jpg)
![International Journal of Biomedical Engineering and Science (IJBES), Vol. 10, No. 1, January 2023
2
Figure 1. The pulse transit time (PTT)
Increases in (PTT) are related to changes that occur in the cardiovascular system, for example, a
decrease in both systolic blood pressure (SBD), and arterial stiffness (AS), or on the contrary an
increase in path length [11]. The (PTT) levels are affected by several factors including age, and
the presence of atherosclerotic disease associated with risk factors [12]. Among the promising
applications of (PTT) is the monitoring of ductus arteriosus closure in the neonatal setting [13]
and the detection of sleep-disordered breathing [14] as well as stroke and myocardial infarction
[15] Kounalakis et al. used pulse transit time that was related to cardiac output [16]. Smith et al.
have used pulse transit time for a sleep disorder study [4]. To detect sympathetic nervous
system (SNS) excitation, Fechir et al. used the pulse transit time [17]. Changes in (PTT) can be
used as a measure of the smooth muscle relaxation that occurs when a functional endothelium is
stimulated study reported by Maltz and Budinger [18]. There are different non-invasive
techniques to measure PTT, such as arterial tonometry, Doppler ultrasound,
electrocardiography-photoplethysmography (ECG signal represents the electrical activity of the
heart, while PPG signal measures changes in blood volume), and pressure transducers [20, 21,
22, 23, 24]. Depending on the equipment used and the applications, the (PTT) can be defined as
different time intervals: (1) The Time difference between the onset of cardiac ejection
approximated by the R-peak in the electrocardiogram (ECG) and the arrival of the pulse at the
fingertip as determined by the photoplethysmogram (PPG) as in [25. 26, 27, 28, 29, 30], which
is the popular (PTT) estimation (shown in Figure 2).
Figure 2. Graphical explanation of the (PTT) calculation using (PPG) and (ECG) signals](https://image.slidesharecdn.com/anewalgorithmformeasuringpulse-ijbes-240918052845-1842d007/85/A-NEW-ALGORITHM-FOR-MEASURING-PULSE-IJBES-pdf-2-320.jpg)
![International Journal of Biomedical Engineering and Science (IJBES), Vol. 10, No. 1, January 2023
3
The use of (PTT) dates back to 1964 when Weltman et al [31] designed the PWV computer
based on the use of the (ECG) complex and a downstream pulse signal to determine the pulse
transit time over a known arterial length. A combination of the (ECG) and (PPG) signals leads
to the measurement of another cardiovascular parameter called pulse arrival time (PAT). The
(PAT) includes not only the desired (PTT) but also a rejection period (PEP). This approach has
been extensively reported in the literature [32, 33, 34]. The (PTT) technique is reproducible,
non-invasive, easy, and safe, it is therefore not necessary for specialized training required for
medical staff to handle (ECG) and (PPG) signals. Another approach (2), the (PTT) can be
acquired by observing two PPG waves distant from each other [35, 36], or by using only one
(PPG) signal [37, 38, 39, 40], different measurement sites exist in the periphery including the
finger, ear lobe, toe, and forehead although they are less practical. To measure the (PTT) (or
PAT), various vital signals such as Photoplethysmograph (PPG), electrocardiogram (ECG),
ballistocardiogram (BCG), gyrocardiography (GCG), impedance plethysmography (IPG),
electrical bio-impedance (Bimp), the PPG/tonoarteriogram (TAG), impedance cardiography
(ICG) and seismocardiogram (SCG) can be used [41]. The features obtained from the (ECG)
and (PPG) signals depend on the purpose or type of disease and diagnosis to be estimated. To
develop a good algorithm, it is necessary to know first how to define the relevance of a pulse
wave for the calculation of (PTT). In the literature, several algorithms based on characteristics
of the pulse waveform analysis have been proposed, mainly focusing on the determination of
characteristic point’s peak detection [42, 43, 44, 45], and located at the foot of the wave. This
paper presents a new algorithm for non-invasive measurements of the pulse transit time (PTT),
which is obtained by measuring the pulse time between the heart and the finger. The (PTT-
Peak) and (PTT-Foot) are the time intervals between the wave peak (ECG-R) and the (PPG)
peak and foot, respectively.
2. MATERIALS AND METHODS
In this study, the (ECG) and (PPG) signals were processed to measure the (PTT), which is
estimated using the algorithm illustrated in Figure 3. The (PTTs) (PTT-foot and PTT-peak)
values are obtained by the measurement of the differences between the (PPG) (foot; peak)
locations and R-peak locations.
2.1. Training Dataset
We first built a 37 subjects dataset containing a simultaneous recording of the (ECG) and
(PPG). All the participants have signed a voluntary agreement to participate in this study. The
Authorization for data acquisition granted by the ethics committee of Tlemcen University.
2.2. The PTT Algorithm
The robust determination of characteristic points is still a difficult task in the PTT estimation
due to motion artifacts, electrical interference noises, and signal crossovers among others, and
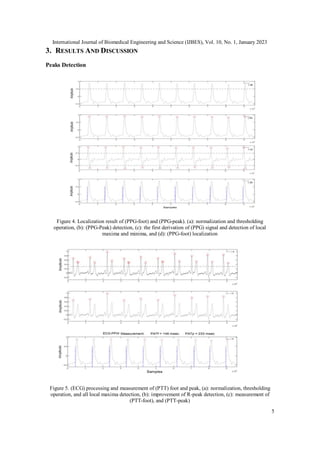
also due to respiration. First, the (PPG) is normalized at the value of 1 according to the equation
(1):
P P G (normalized) = (P P G (n))/ (max (P P G)) (1)
Where n: is the normalization factor. In our case, it equals 1. PPG peaks were detected using a
thresholding operation. The threshold was set at 0.5. After that, the first derivative was
calculated and symmetrically thresholded (+0.5and -0.5) to detect the local maxima and
minima. The subtraction of each peak location (in the PPG signal) with the difference between
its minima and maxima location (in the derivative signal) detects perfectly the (PPG-foot). The
(PPG-foot) detection process evolved mathematically from a Gaussian pulse (which](https://image.slidesharecdn.com/anewalgorithmformeasuringpulse-ijbes-240918052845-1842d007/85/A-NEW-ALGORITHM-FOR-MEASURING-PULSE-IJBES-pdf-3-320.jpg)

![International Journal of Biomedical Engineering and Science (IJBES), Vol. 10, No. 1, January 2023
6
Experimental results of the proposed algorithm are evaluated in terms of sensitivity (SEN) and
accuracy (ACC) given by equations (2) and (3), respectively. Where TP (true positive) is the
number of peaks (or feet) correctly recognized, FN (false negative) is the number of peaks (or
feet) missed, and FP (false positive) is the number of false peaks (or feet) recognized as true.
SEN = T P/(T P + F N) ×100% (2)
ACC = T P/(T P + F N + F P) ×100% (3)
Where TP (true positive) is the number of peaks (or feet) correctly recognized, FN (false
negative) is the number of peaks (or feet) missed, and FP (false positive) is the number of false
peaks (or feet) recognized as true.
Table 1 shows the accuracy and sensitivity values of the algorithm. The total beats recorded
over all subjects were 719 beats with an average of 24±9 beats. In the case of R-peak detection
(ECG-p), the algorithm fails to detect 23 beats (18 FN beats and 5 FP beats) out of 719 beats.
The average (SEN) and (ACC) of R-peaks detection were 97.5%, and 96.82% respectively. In
the case of PPG-peak detection, the algorithm fails to detect 17 beats (16 FN beats and 1 FP
beat) out of 719 beats. The average (SEN) and (ACC) of PPG-peak detection were 97.77%, and
97.64%, respectively. In the case of PPG foot detection, the algorithm mislocated 54 beats (12
FN beats and 32 FP beats) out of 719 beats. The average (SEN) and (ACC) of (PPG- foot)
detection were 98.33%, and 94.14%, respectively. Obtained results show satisfactory
performances on the records. We note that only the correct detections are used in this study.
Table 1. Detection results of the algorithm.
Total beats=719(Avg=24±9 beats)
TP FN FP Accuracy% Sensitivity%
ECG-p 701 18 5 96.82 97.50
PPG-p 703 16 1 97.64 97.77
PPG-f 707 12 32 94.14 98.33
4. CONCLUSIONS
In this study, we introduced a new algorithm (PTT) that is considered to be very useful for
studying cardiovascular diseases. A parameter of major importance in the prevention of
cardiovascular diseases, in particular arterial aging and hypertension. The collected data were
processed for PTT estimation. We obtained the (PTT- foot) and (PTT- peak) from both (ECG)
and (PPG) signals. A number of statistical measures were employed in the studies, with the
objective of evaluating performance, the sensitivity of false positives (FP), false negatives (FN),
and true negatives (TN), which produced good results.
REFERENCES
[1] World Health Organization, World health statistics 2019: Monitoring health for the SDGs
sustainable development. Goals. World Health Organization, 2019, vol.
3,no.2.https://apps.who.int/iris/handle/10665/324835.
[2] R. Smith, J. Argod, J-L. Pepin, PA. Levy. Pulse transit time: an appraisal of potential clinical
applications. Thorax1999; 54: 452–8.
[3] J. Stamler, R. Stamler, JD. Neaton. Blood pressure, systolic and diastolic, and cardiovascular risks.
US population data. Arch Intern Med 1993; 153:598–615.](https://image.slidesharecdn.com/anewalgorithmformeasuringpulse-ijbes-240918052845-1842d007/85/A-NEW-ALGORITHM-FOR-MEASURING-PULSE-IJBES-pdf-6-320.jpg)
![International Journal of Biomedical Engineering and Science (IJBES), Vol. 10, No. 1, January 2023
7
[4] J. He, PK. Whelton. Elevated systolic blood pressure and risk of cardiovascular and renal disease: an
overview of evidence from observational epidemiologic studies and randomized controlled trials.
Am Heart J 1999; 138 (3 Pt 2):211–219.
[5] C. Vlachopoulos, M. O’Rourke, and W.W. Nichols, McDonald’s blood flow in arteries: theoretical,
experimental and clinical principles. CRC Press, 2011
[6] S. Laurent, J. Cockcroft, LV. Bortel, P. Boutouyrie, C. Giannattasio, D. Hayoz, B. Pannier, C.
Vlachopoulos, I. Wilkinson, H. Struijker-Boudier. Expert consensus document on arterial stiffness:
methodological issues and clinical applications. Eur. Heart J. 2006; 27: 2588–605.
[7] J. Padilla, EJ. Berjano, J. Sάiz, L. Fάcila, L. Dίaz, S. Merce. Assessment of relationships between
blood pressure, pulse wave velocity, and digital volume pulse. Computers in Cardiology. 2006;
33:893–896.
[8] M.Y.-M. Wong, C.C.-Y. Poon, Y.-T. Zhang, An evaluation of the cuffless blood pressure estimation
based on pulse transit time technique: A half-year study on normotensive subjects. Cardiovasc.
Eng.2009, 9, 32–38.
[9] G. Zhang, M. Gao, R. Mukkamala. Robust, beat-to-beat estimation of the true pulse transit time
from central and peripheral blood pressure or flow waveforms using an arterial tube-load model. In:
Annual international conference of the IEEE engineering in medicine and biology society, Boston,
USA; 2011. p. 4291–4.
[10] C. Ahlstrom, A. Johansson, TLF. Uhlin, P. Ask. Non-invasive investigation of blood pressure
changes using the pulse wave transit time: a novel approach in the monitoring of hemodialysis
patients. Japan Soc Artif Organs 2005; 8:192–7.
[11] Vlahandonis, SN.Biggs, GM.Nixon, MJ.Davey, LM.Walter, RSC.Horne. Pulse transit time as a
surrogate measure of changes in systolic arterial pressure in children during sleep. J Sleep Res.
2014; 23: 406–413. Pmid: 24605887–88.
[12] JC. Bramwell, AV.Hill.The velocity of transmission of the pulse wave. Lancet (1922). The PTT can
also be used to monitor peripheral arterial diseases in distal sites caused by pathologies such as
diabetes.
[13] CR. Amirtharaj, LC.Palmeri, G. Gradwohl, Y. Adar, M. Nitzan, D. Gruber, et al.
Photoplethysmographic assessment of pulse transit time correlates with echocardiographic
measurement of stroke volume in preterm infants with patent ductus arteriosus. J Perinatol. 2018;
38: 1220–1226.
[14] B. Chakrabarti, S. Emegbo, S. Craig, N. Duffy, J. O’Reilly. Pulse transit time changes in subjects
exhibiting sleep-disordered breathing. Respir Med. Elsevier Ltd; 2017; 122: 18–22.
[15] J. Foo, C. Lim. Pulse transit time as an indirect marker for variations in cardiovascular-related
reactivity. Technol Health Care 2006; 14(2):97–108.
[16] [S. Kounalakis, and N. Geladas, (2009). The Role of Pulse Transit Time as an Index of Arterial
Stiffness during Exercise. Cardiovascular Engineering, 9(3), pp.92-97.
[17] M. Fechir, T. Schlereth, T. Purat, S. Kritzmann, C. Geber, T. Eberle, M. Gamer, F. Birklein: patterns
of sympathetic responses induced by different stress tasks. open neurol j 2: 25-31, 2008.
[18] J. Maltz, T. Budinger. Evaluation of arterial endothelial function using transit times of artificially
induced pulses. Physiol. Meas. 2005; 26: 293–307.
[19] Nichols, M.F.O.W.W., M.W.L. Kenney, McDonald’s Blood Flow in Arteries, Theoretical,
Experimental and Clinical Principles. J. Cardiopulm. Rehabil.1991, 3, 407.
[20] T. Kanda, E. Nakamura, T. Moritani, Y. Yamori. Arterial pulse wave velocity and risk factors for
peripheral vascular disease. Eur. J. Appl. Physiol. 2000, 82, 1–7.
[21] E. Lehmann, K. Hopkins, R. Gosling. Aortic compliance measurements using Doppler ultrasound-
in-vivo biochemical correlates. Ultrasound. Med. Biol. 1993; 19:683–710.
[22] S. Loukogeorgakis, R. Dawson, N. Phillips, C.N. Martyn, S.E. Greenwald. Validation of a device to
measure arterial pulse wave velocity by a photoplethysmographic method. Physiol. Meas. 2002, 23,
581.
[23] J. Davies, A. Struthers. Pulse wave analysis and pulse wave velocity: a critical review of their
strengths and weaknesses. J. Hypertens. 2003; 21:463–72.
[24] J. Allen. Photoplethysmography and its application in clinical physiological measurement. Physiol.
Meas. 2007; 28:R1–39.
[25] M. Elgendi. On the Analysis of Fingertip Photoplethysmogram Signals. Curr Cardiol Rev. 2012; 8:
14–25. Pmid: 22845812 –44.](https://image.slidesharecdn.com/anewalgorithmformeasuringpulse-ijbes-240918052845-1842d007/85/A-NEW-ALGORITHM-FOR-MEASURING-PULSE-IJBES-pdf-7-320.jpg)
![International Journal of Biomedical Engineering and Science (IJBES), Vol. 10, No. 1, January 2023
8
[26] H. Gesche, D. Grosskurth, G.K uchler, and A. Patzak. Continuous blood pressure measurement by
using the pulse transit time: comparison to a cuff-based method, Eur. J. Appl. Physiol., vol. 112, no.
1, pp. 309–315, 2012.
[27] F.S. Cattivelli and H. Garudadri. “Noninvasive cuffless estimation of blood pressure from pulse
arrival time and heart rate with adaptive calibration,” in 6th Int. Workshop Wearable Implantable
Body Sens. Networks (BSN). IEEE, 2009, pp. 114–11.
[28] Cheol Jeong, J. Wood, and J. Finkelstein, “Using individualized pulse transit time calibration to
monitor blood pressure during exercise,” Inf. Manage. Technol. Healthcare, vol. 190, p. 39, 201.
[29] X. He, R.A. Goubran, and X.P. Liu, “Secondary peak detection of ppg signal for continuous cuffless
arterial blood pressure measurement,” IEEE Trans. Instrum. Meas., vol. 63, no. 6, pp. 1431–1439,
2014.
[30] M. Kachuee, M.M. Kiani, H. Mohammadzade, and M. Shabany, “Cuff-less high-accuracy
calibration-free blood pressure estimation using pulse transit time,” in IEEE Int. Symp. Circuits
Syst. (ISCAS). IEEE, 2015, pp. 1006–1009.
[31] G. Weltman, G. Sullivan, D. Bredon. The continuous measurement of arterial pulse wave velocity.
Med Biol Eng Comput. 1964; 2(2):145–154.
[32] W. Chen, T. Kobayashi, S. Ichikawa, Y. Takeuchi, T. Togawa. Continuous estimation of systolic
blood pressure using the pulse arrival time and intermittent calibration. Med. Biol. Eng.
Comput.2000, 38, 569–574.
[33] M.Y.M. Wong, C.C.-Y. Poon, Y.-T. Zhang, An evaluation of the cuffless blood pressure estimation
based on pulse transit time technique: A half-year study on normotensive subjects. Cardiovasc.
Eng.2009, 9, 32–38.
[34] S. Puke, T. Suzuki, K. Nakayama, H. Tanaka, S. Minami. Blood pressure estimation from pulse
wave velocity measured on the chest. In Proceedings of the 2013 35th Annual International
Conference of the IEEE Engineering in Medicine and Biology Society (EMBC), Osaka, Japan, 3–7
July 2013; pp. 6107–6110.
[35] M. Hosanee, G. Chan, K. Welykholowa, R. Cooper, P.A. Kyriacou, D. Zheng, J. Allen, D. Abbott,
C. Menon, N.H. Lovell, et al. Cuffless Single-Site Photoplethysmography for Blood Pressure
Monitoring. J. Clin. Med. 2020, 9, 723.
[36] M. Elgendi, R. Fletcher, Y. Liang, N. Howard, N.H. Lovell, D. Abbott, K. Lim, R. Ward. The use of
photoplethysmography for assessing hypertension. NPJ Digit. Med. 2019, 2, 60.
[37] K. Matsumura, P. Rolfe, S. Toda, T. Yamakoshi. Cuffless blood pressure estimation using only a
smartphone. Sci. Rep. 2018, 8, 7298.
[38] X. Xing, Z. Ma, M. Zhang, Y. Zhou, W. Dong, M. Song. An Unobtrusive and Calibration-free
Blood Pressure Estimation Method using Photoplethysmography and Biometrics. Sci. Rep. 2019, 9,
8611.
[39] M. Sadrawi, Y.T. Lin, C.H. Lin, B. Mathunjwa, S.Z.Fan, M.F. Abbod, J.S. Shieh. Genetic deep
convolutional autoencoder applied for generative continuous arterial blood pressure via
photoplethysmography. Sensors 2020, 20, 3829.
[40] F. Riaz, M.A. Azad, J. Arshad, M. Imran, A. Hassan, S. Rehman. Pervasive blood pressure
monitoring using Photoplethysmogram (PPG) sensor. Futur. Gener. Comput. Syst. 2019, 98, 120–
130.
[41] R. Mukkamala, J-O. Hahn, O.T. Inan, L.K. Mestha, C-S.Kim, H. Toreyin et al. (2015). Toward
ubiquitous blood pressure monitoring via pulse transit time: theory and practice. IEEE Trans.
Biomed. Eng.62, 1879–1901.
[42] J. Pan, W.J. Tompkins. A Real-Time QRS Detection Algorithm. IEEE Trans. Biomed. Eng. 1985,
32, 230–236 Okada, M. A Digital Filter for the QRS Complex Detection. IEEE Trans. Biomed. Eng.
1979, 26, 700–703.
[43] D.-G. Jang, S. Park, M. Hahn, S.-H. Park. A Real-Time Pulse Peak Detection Algorithm for the
Photoplethysmogram. Int. J. Electron. Electr. Eng. 2014, 2, 45–49.
[44] S.T. Lin, W.H. Chen, Y.H. Lin. A Pulse Rate Detection Method for Mouse Application Based on
Multi-PPG Sensors. Sensors 2017, 17, 1628.
[45] R. Avanzato, F. Beritelli. Automatic ECG Diagnosis Using Convolutional Neural Network.
Electronics 2020, 9, 951.](https://image.slidesharecdn.com/anewalgorithmformeasuringpulse-ijbes-240918052845-1842d007/85/A-NEW-ALGORITHM-FOR-MEASURING-PULSE-IJBES-pdf-8-320.jpg)