Download as PDF, PPTX
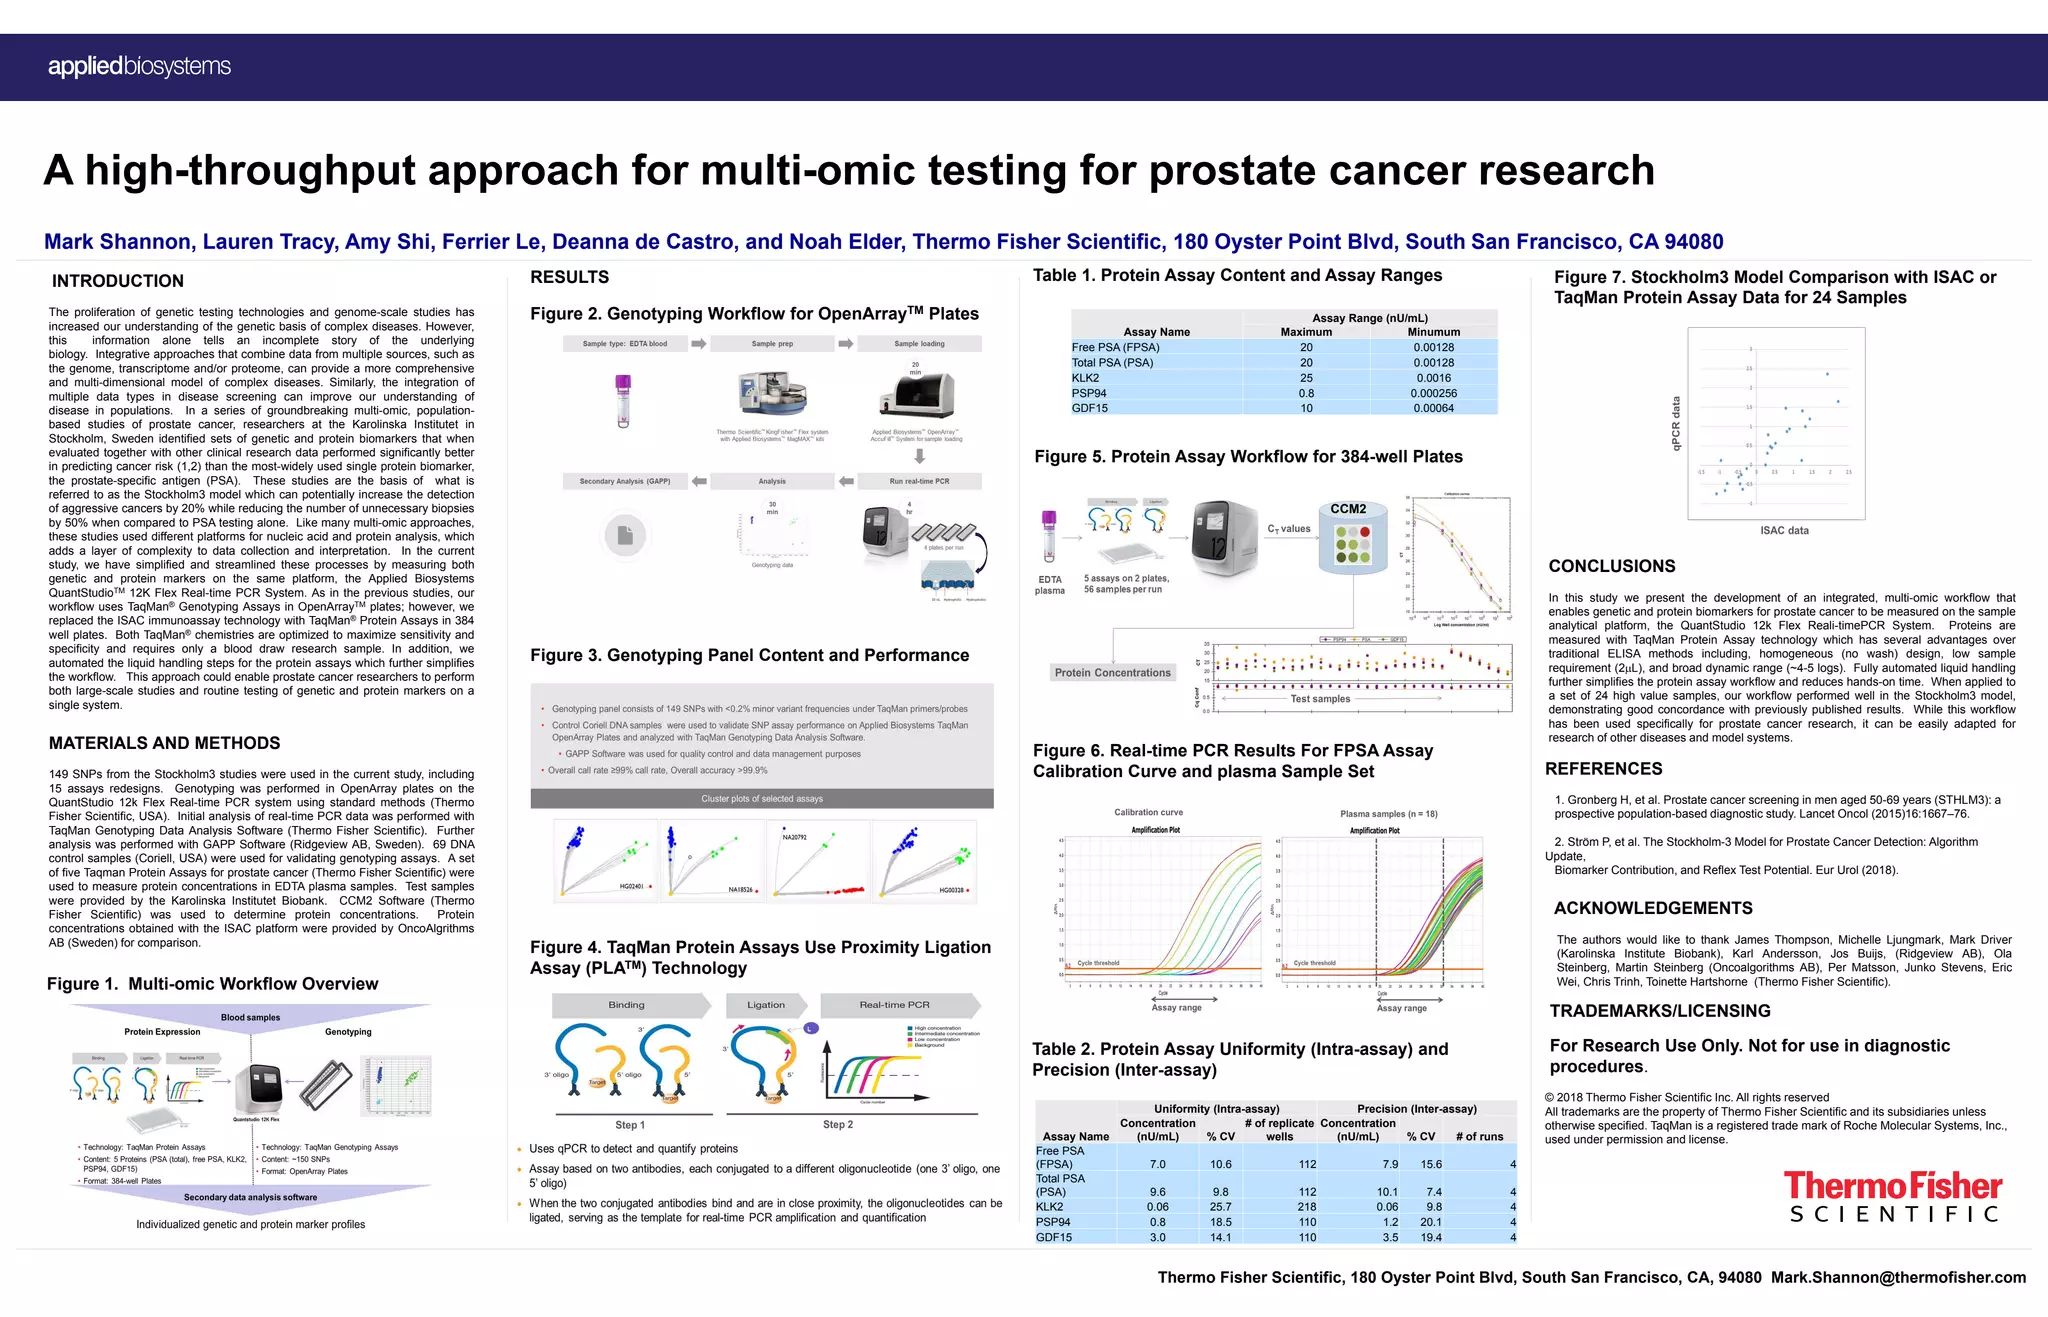

This document outlines a study by Thermo Fisher Scientific that presents an integrated multi-omic workflow for measuring genetic and protein biomarkers for prostate cancer using the QuantStudio 12k Flex real-time PCR system. The workflow streamlines the process by using TaqMan protein assays, allowing for better sensitivity and specificity while reducing hands-on time, and has shown promising results compared to traditional methods. This approach not only aids in prostate cancer research but can also be adapted for studies on other diseases.