Download as PDF, PPTX

![21
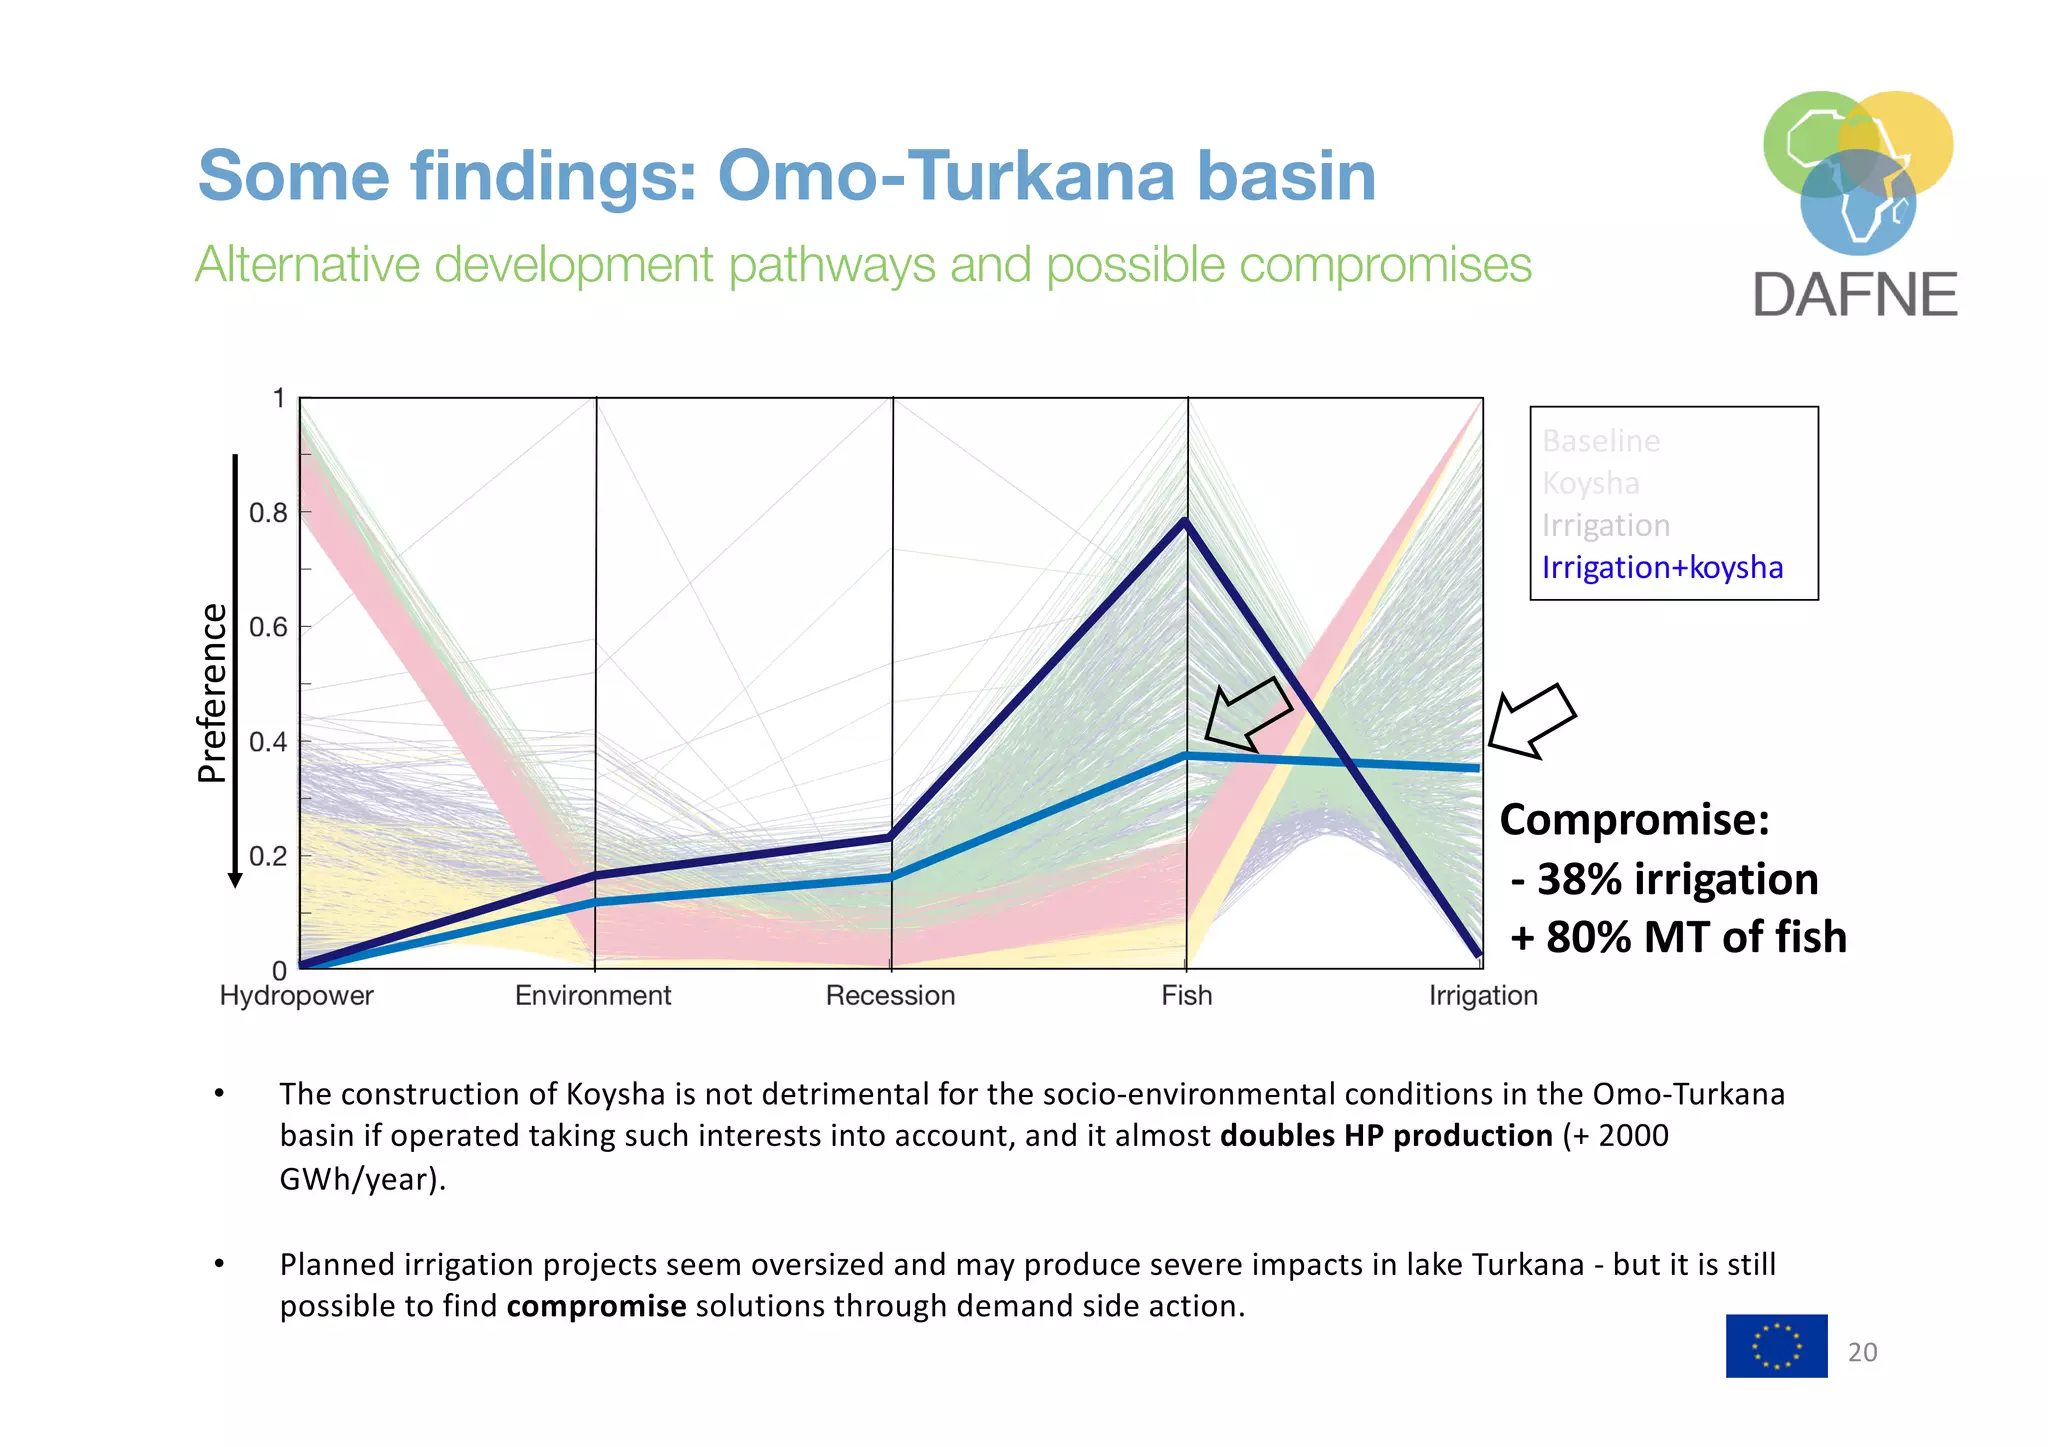
Some findings: Omo-Turkana basin
Policies for operating water infrastructures for different alternatives
2002 2004 2006 2008 2010 2012 2014 2016
345
350
355
360
365
Level[masl]
GIBE I
GIBE III
TURKANA
Turkwel Kerio
Omo
GIBE II
Gojeb
Gilgel Gibe
KOYSHA
Agricultural
district
Agricultural
district
Turkana Level
Gibe III Level
Koysha Level
Delta
Agricultural diversion
No irrigation
Extreme irrigation
Max-min operational level
Water demand
Natural delta regime
Jan Feb Mar Apr May Jun Jul Aug Sep Oct Nov Dec
0
50
100
150
200
Irrigation[m3
/s]
Jan Feb Mar Apr May Jun Jul Aug Sep Oct Nov Dec
620
640
660
680
Level[masl]
Max-min operational level
Jan FebMar Apr May Jun Jul Aug Sep Oct Nov Dec
0
500
1000
1500
2000
Streamflow[m3
/s]
Jan FebMar AprMay Jun Jul AugSep Oct NovDec
800
850
900
Level[masl]](https://image.slidesharecdn.com/dafnenovak-200608064031/75/A-decision-analytic-framework-multi-perspective-visualization-for-participatory-WEF-nexus-analysis-for-policy-making-21-2048.jpg)
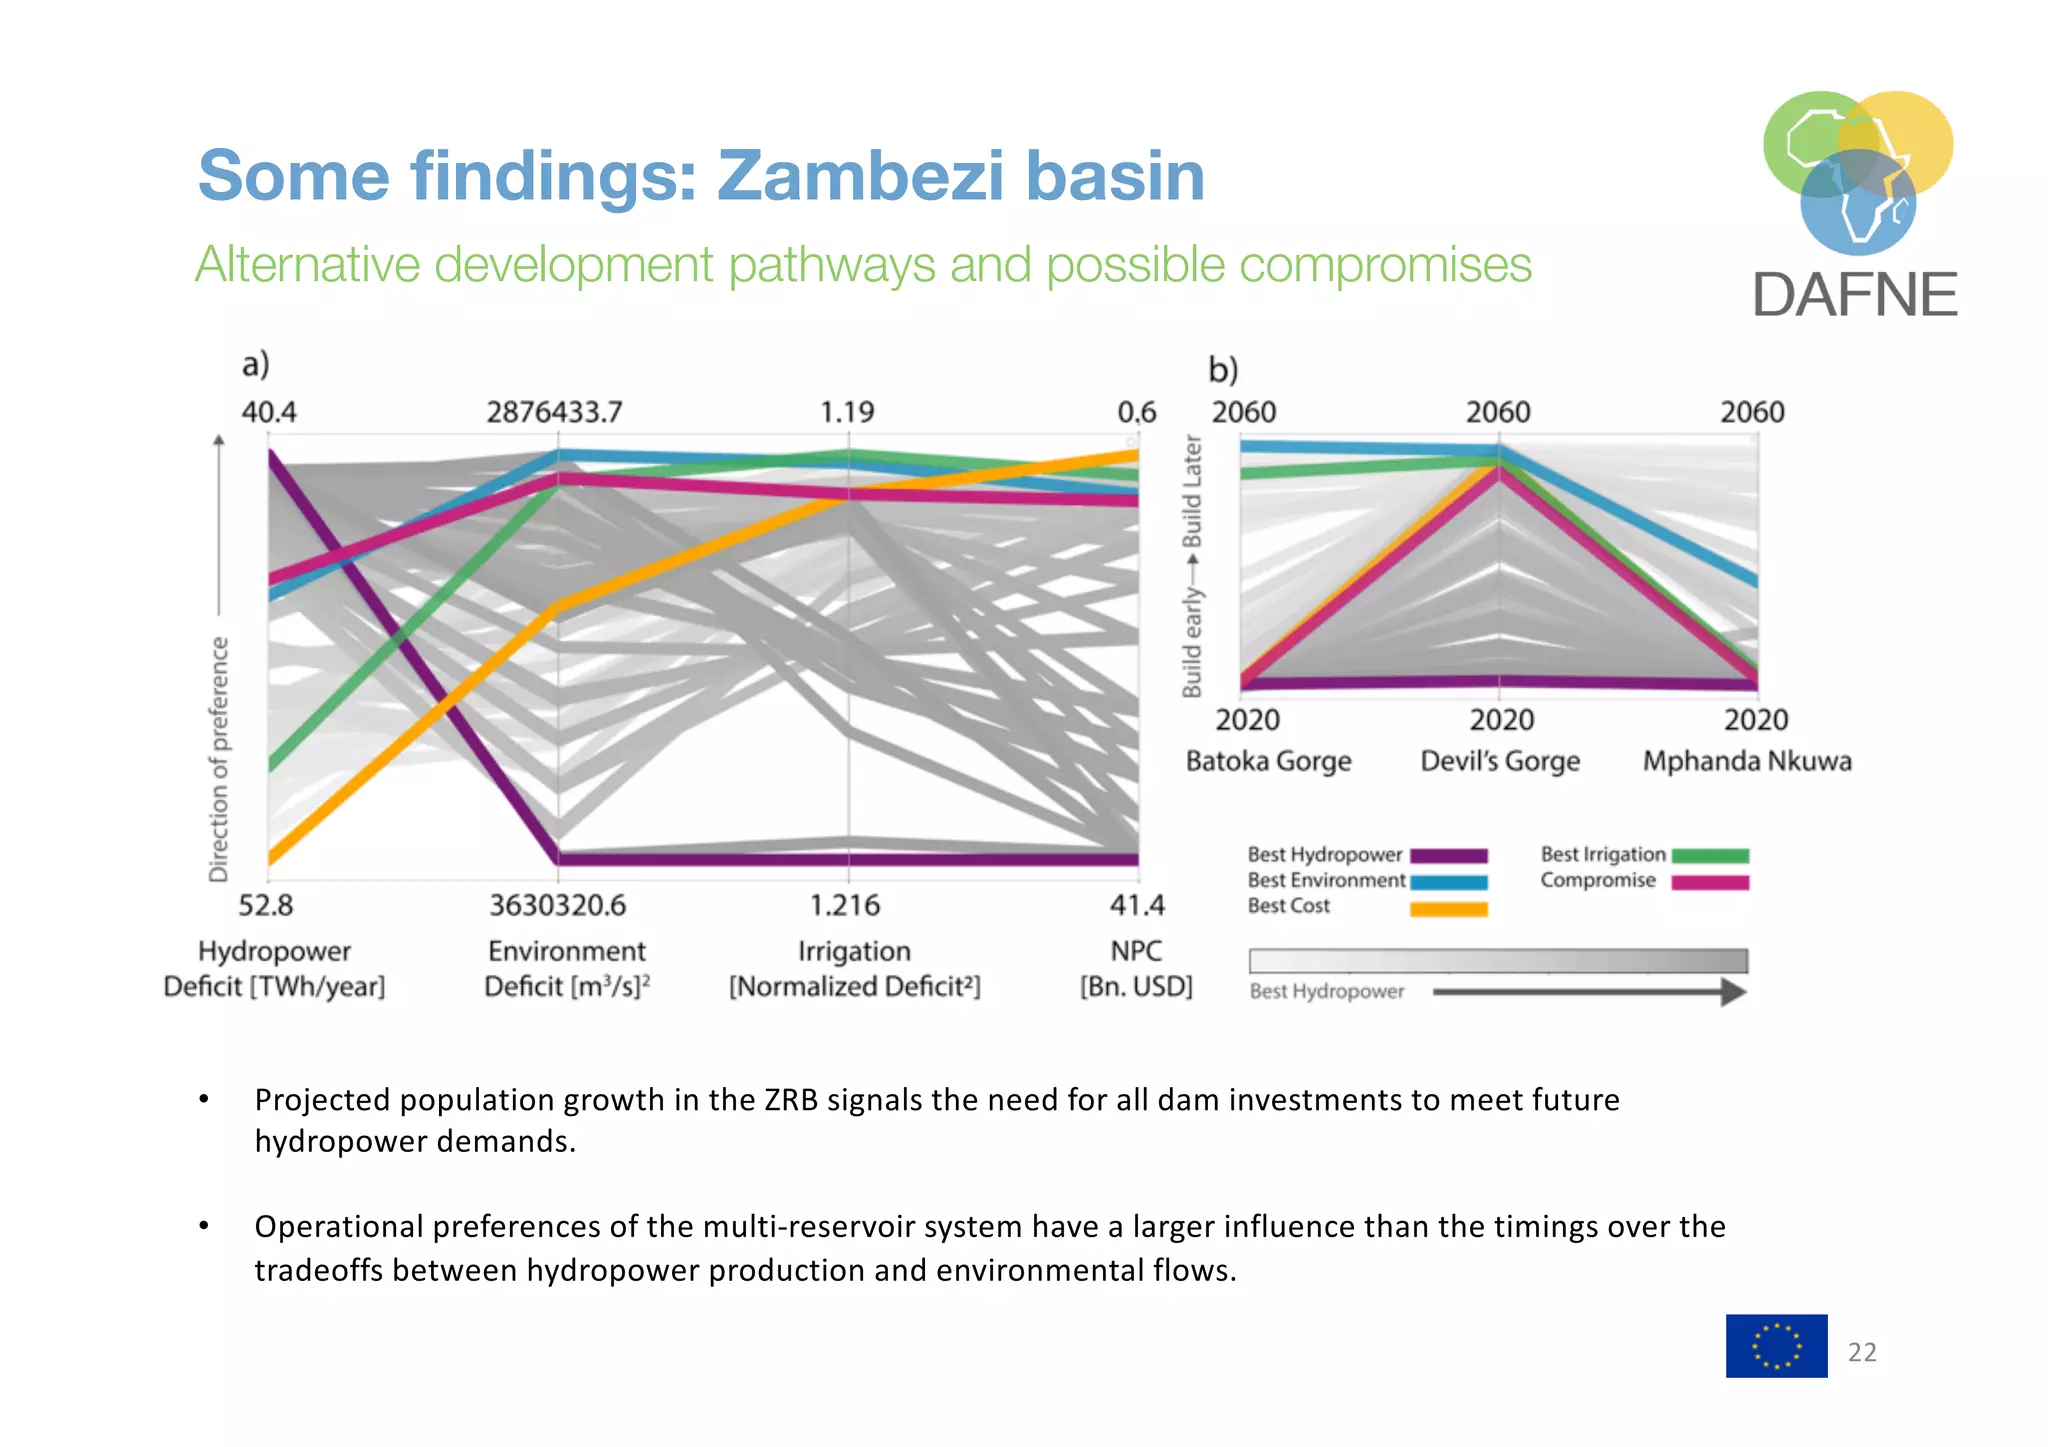
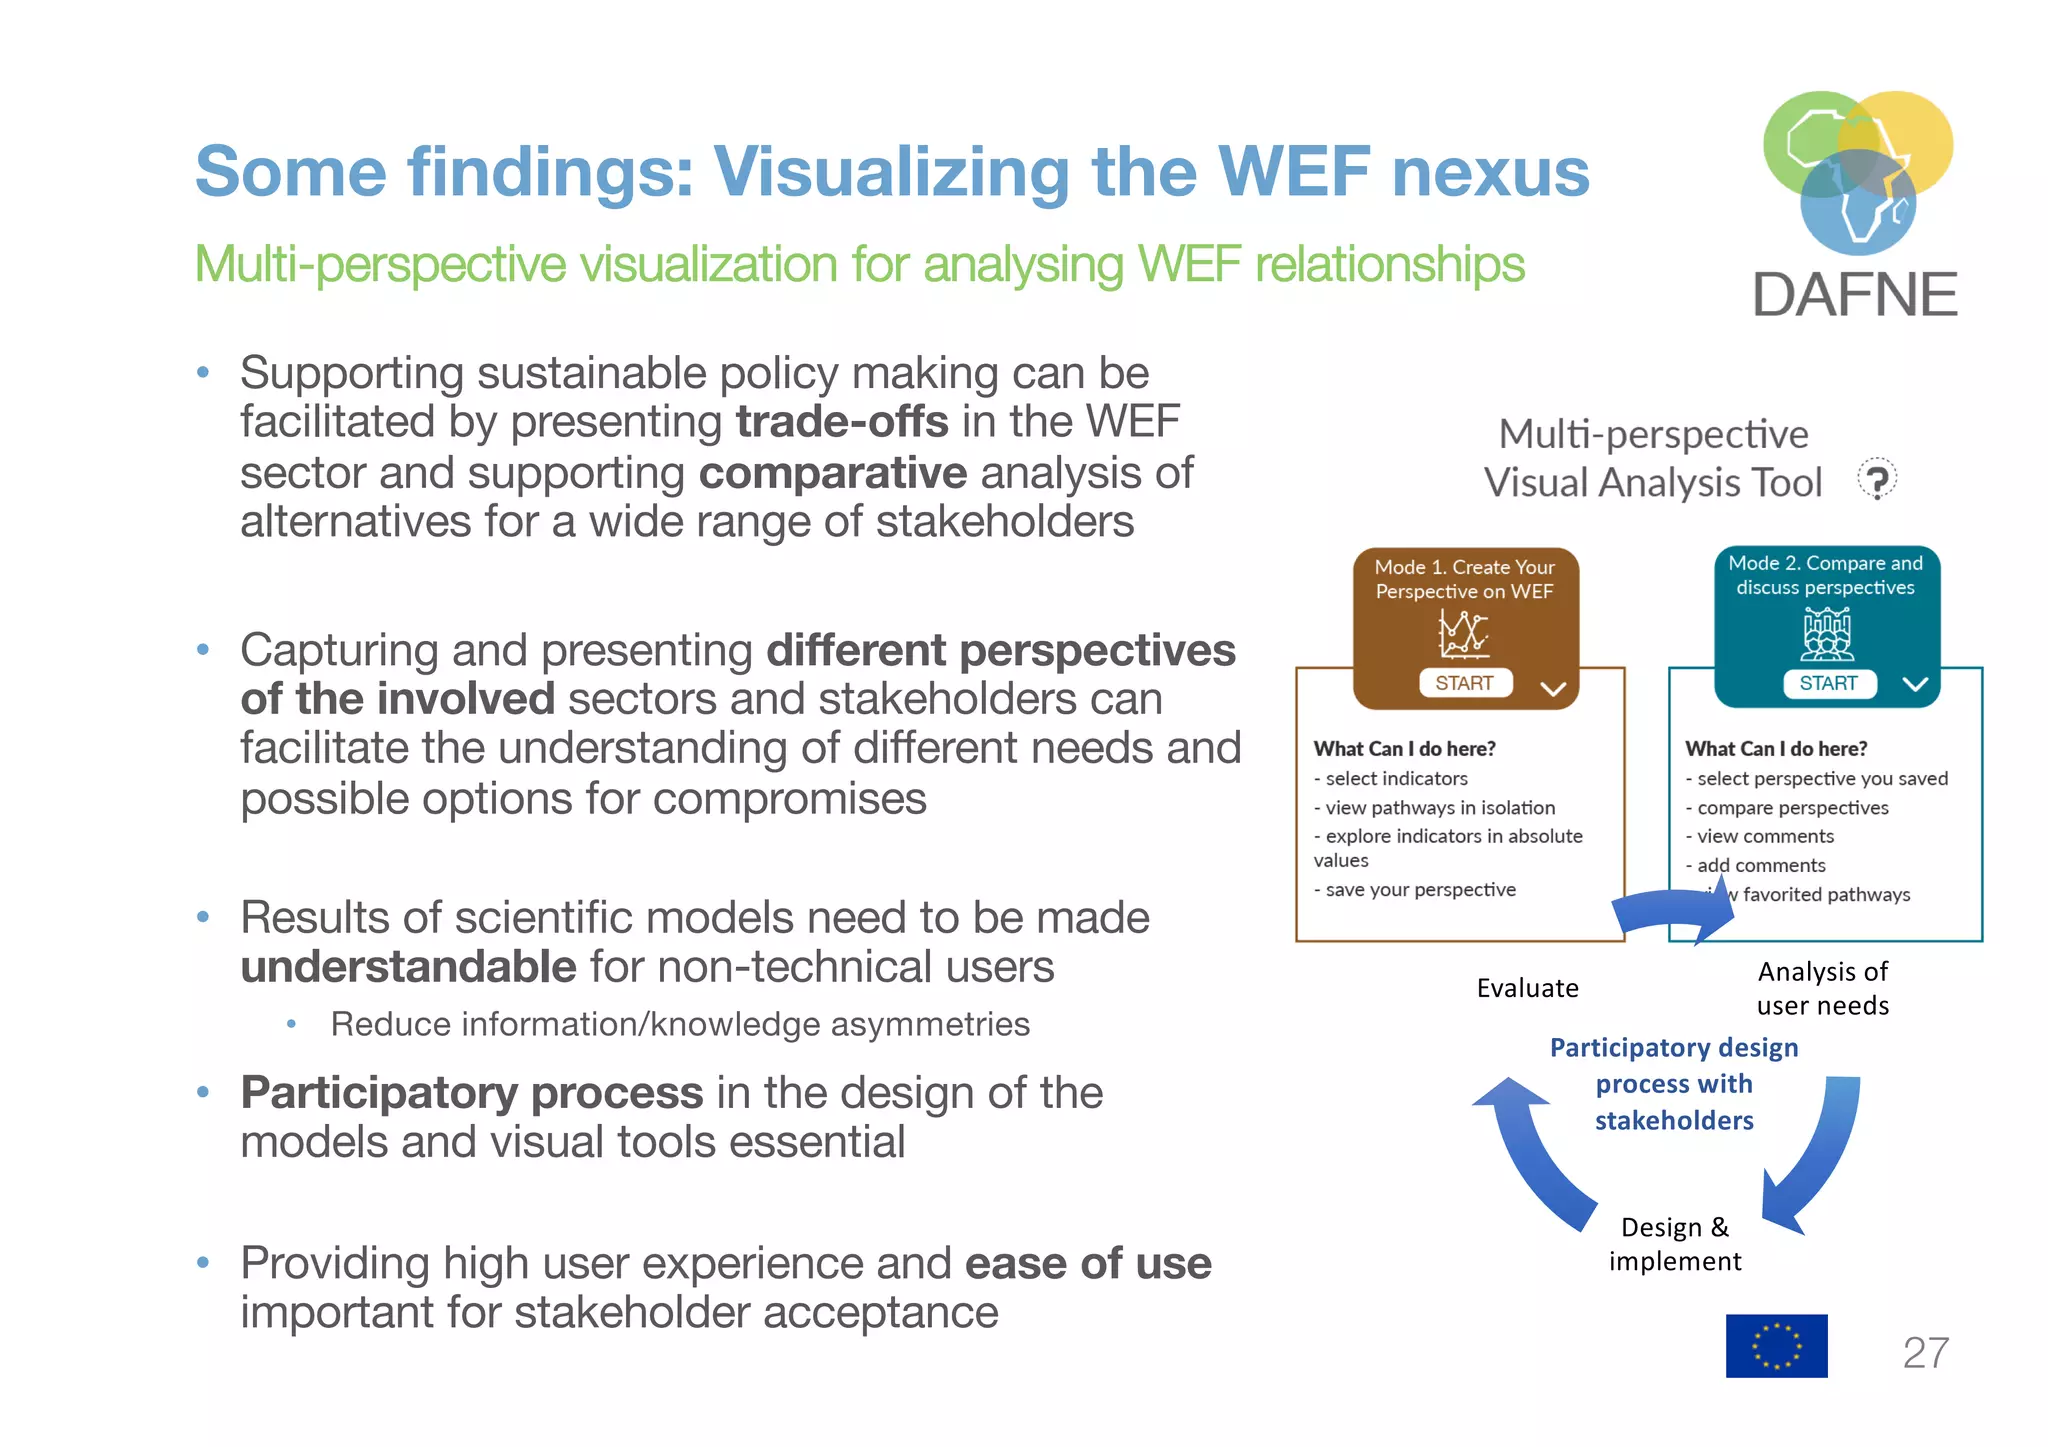

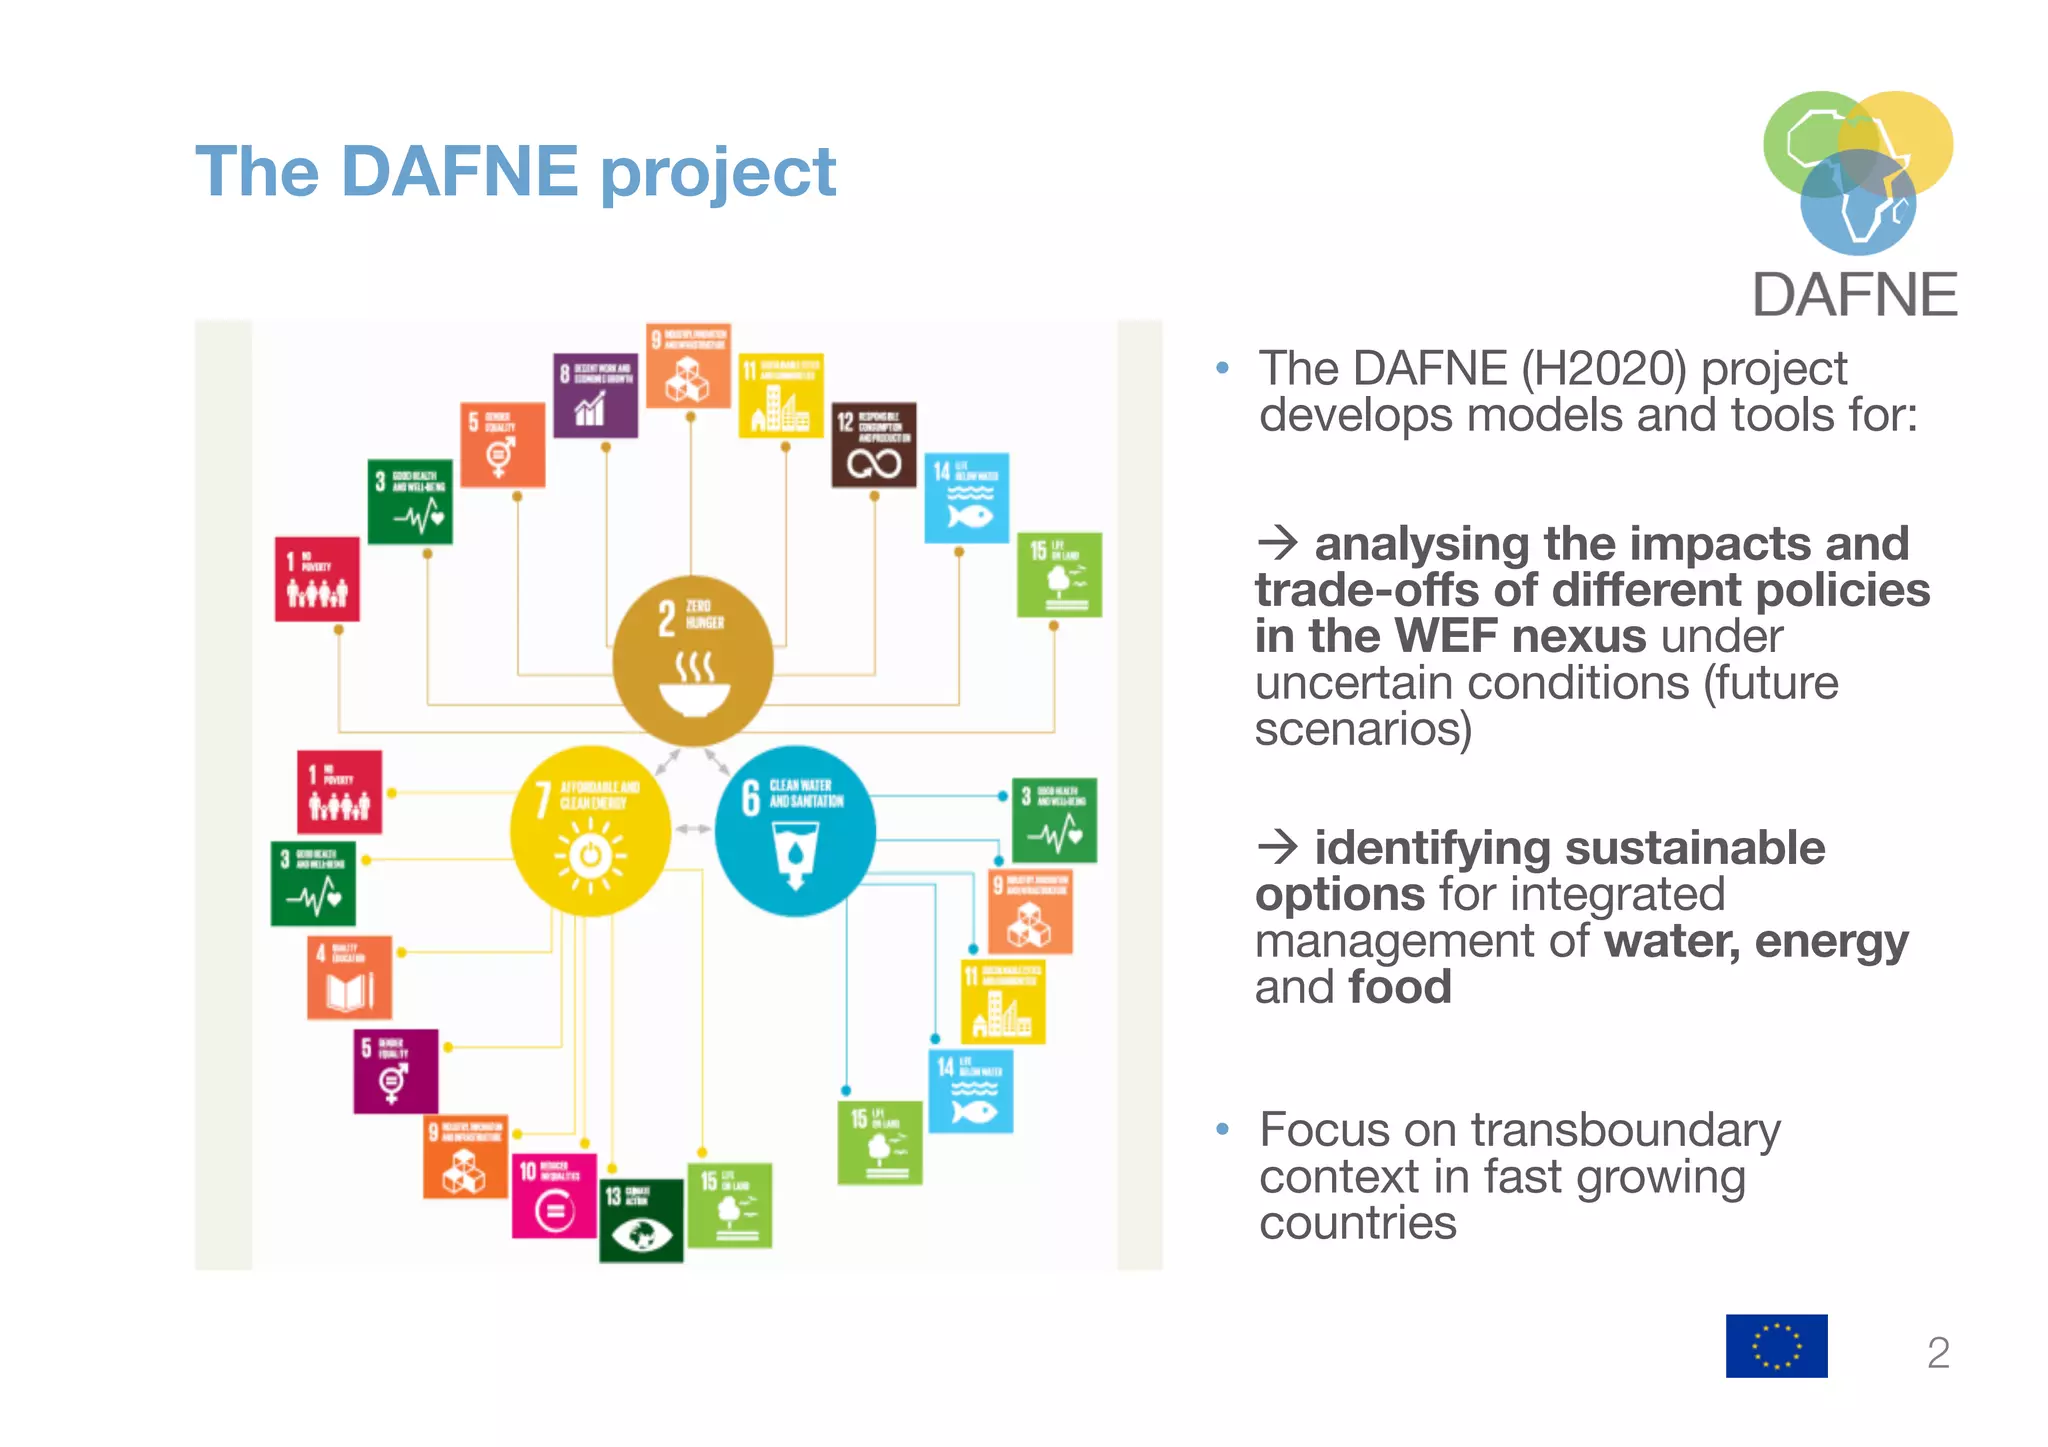
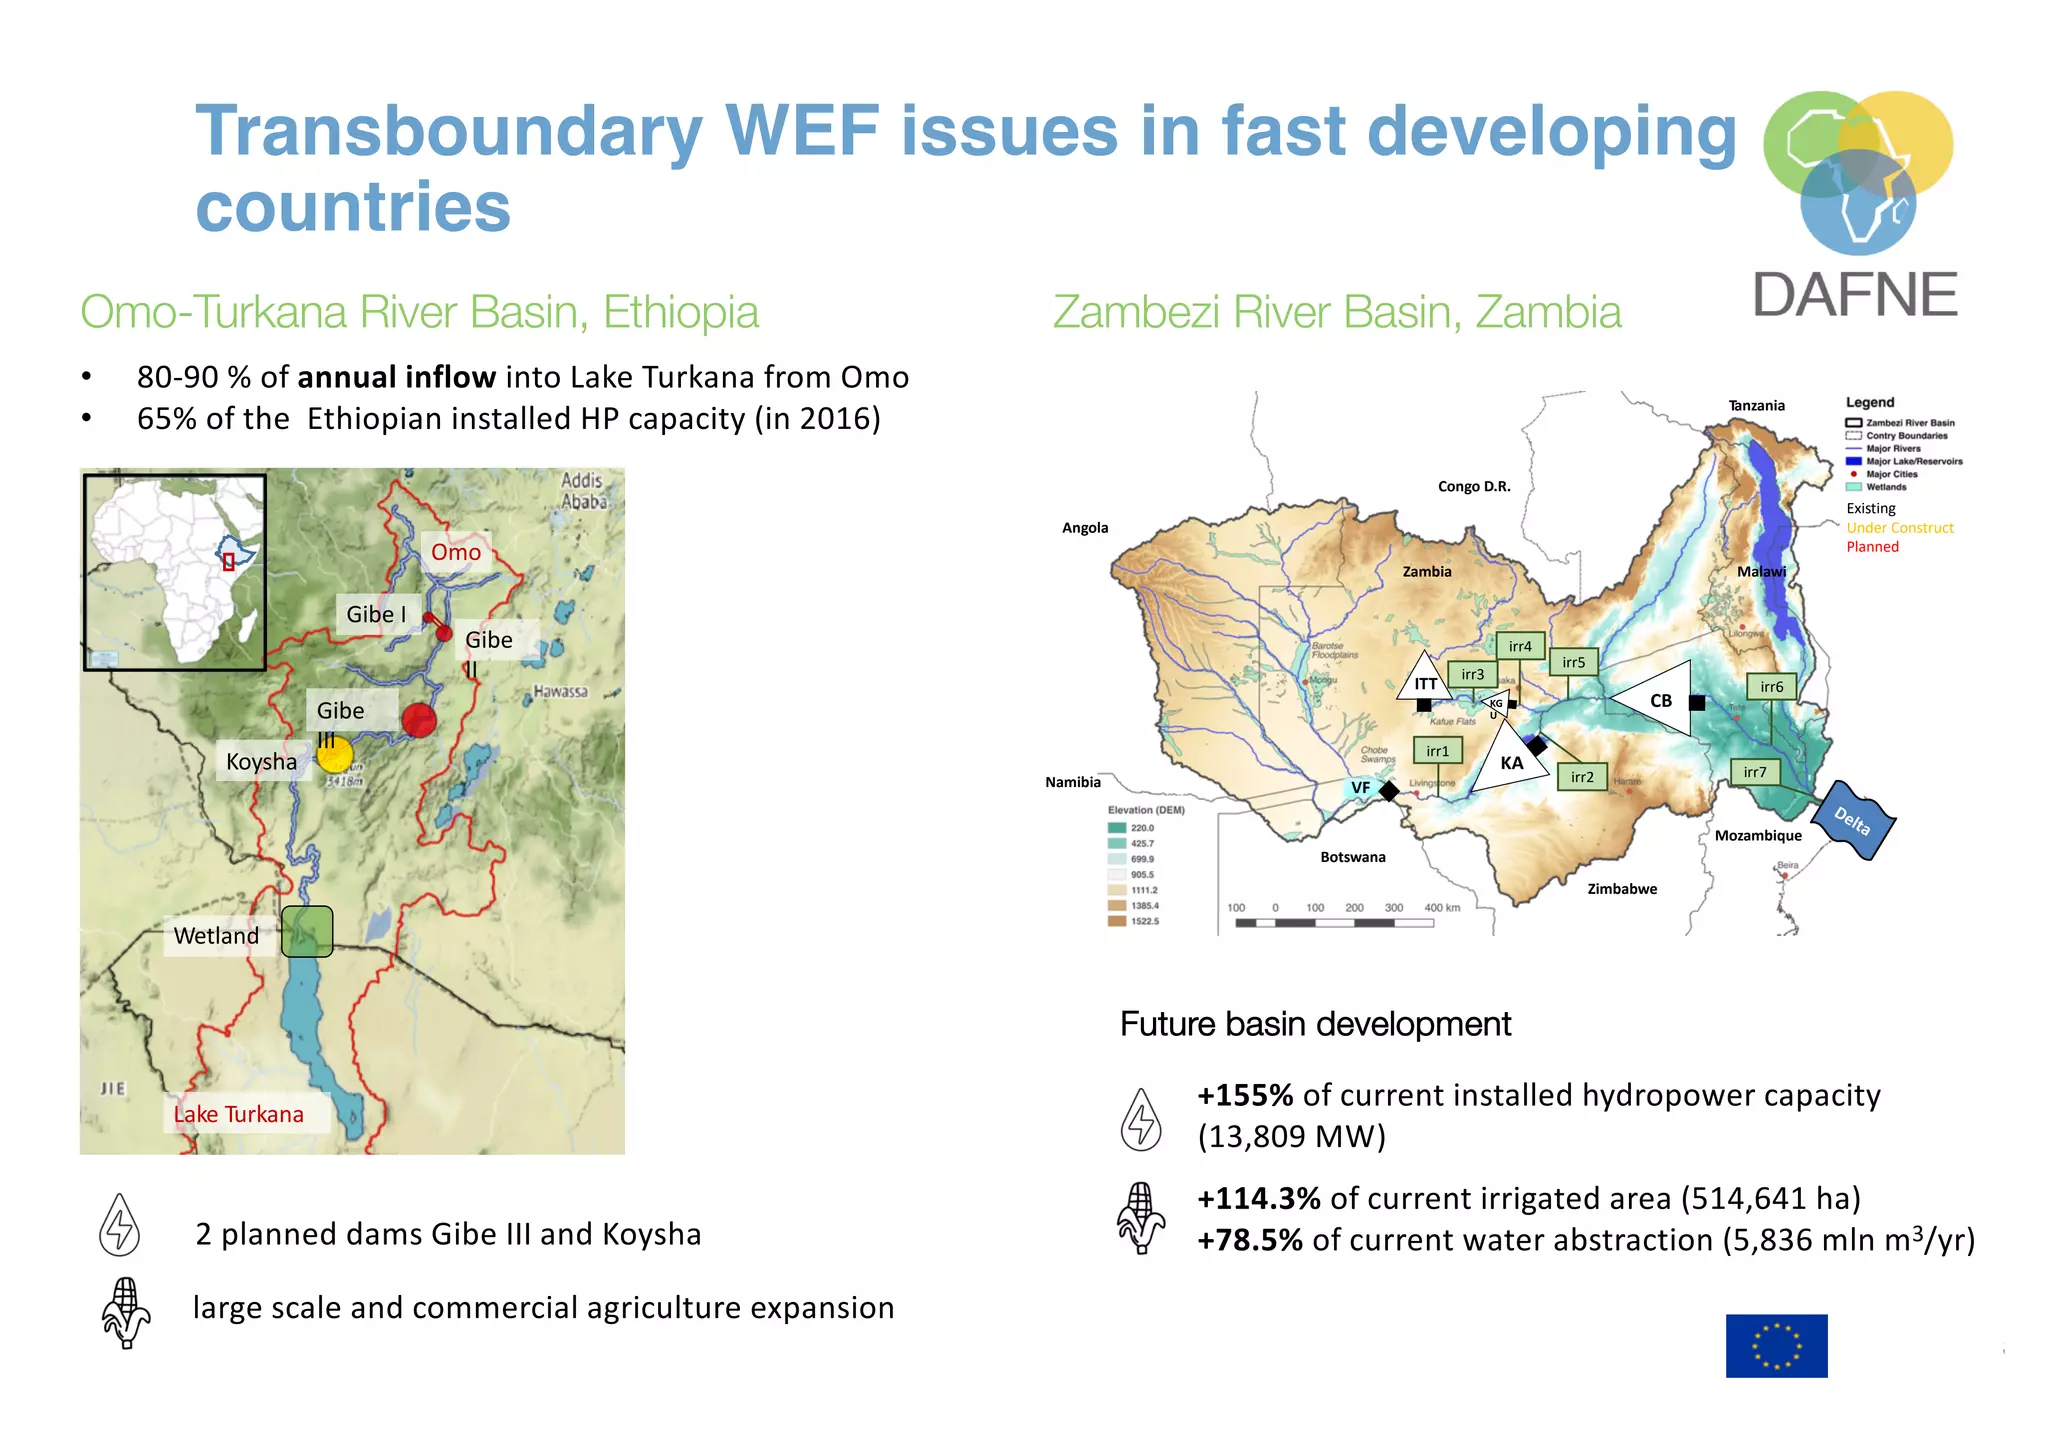
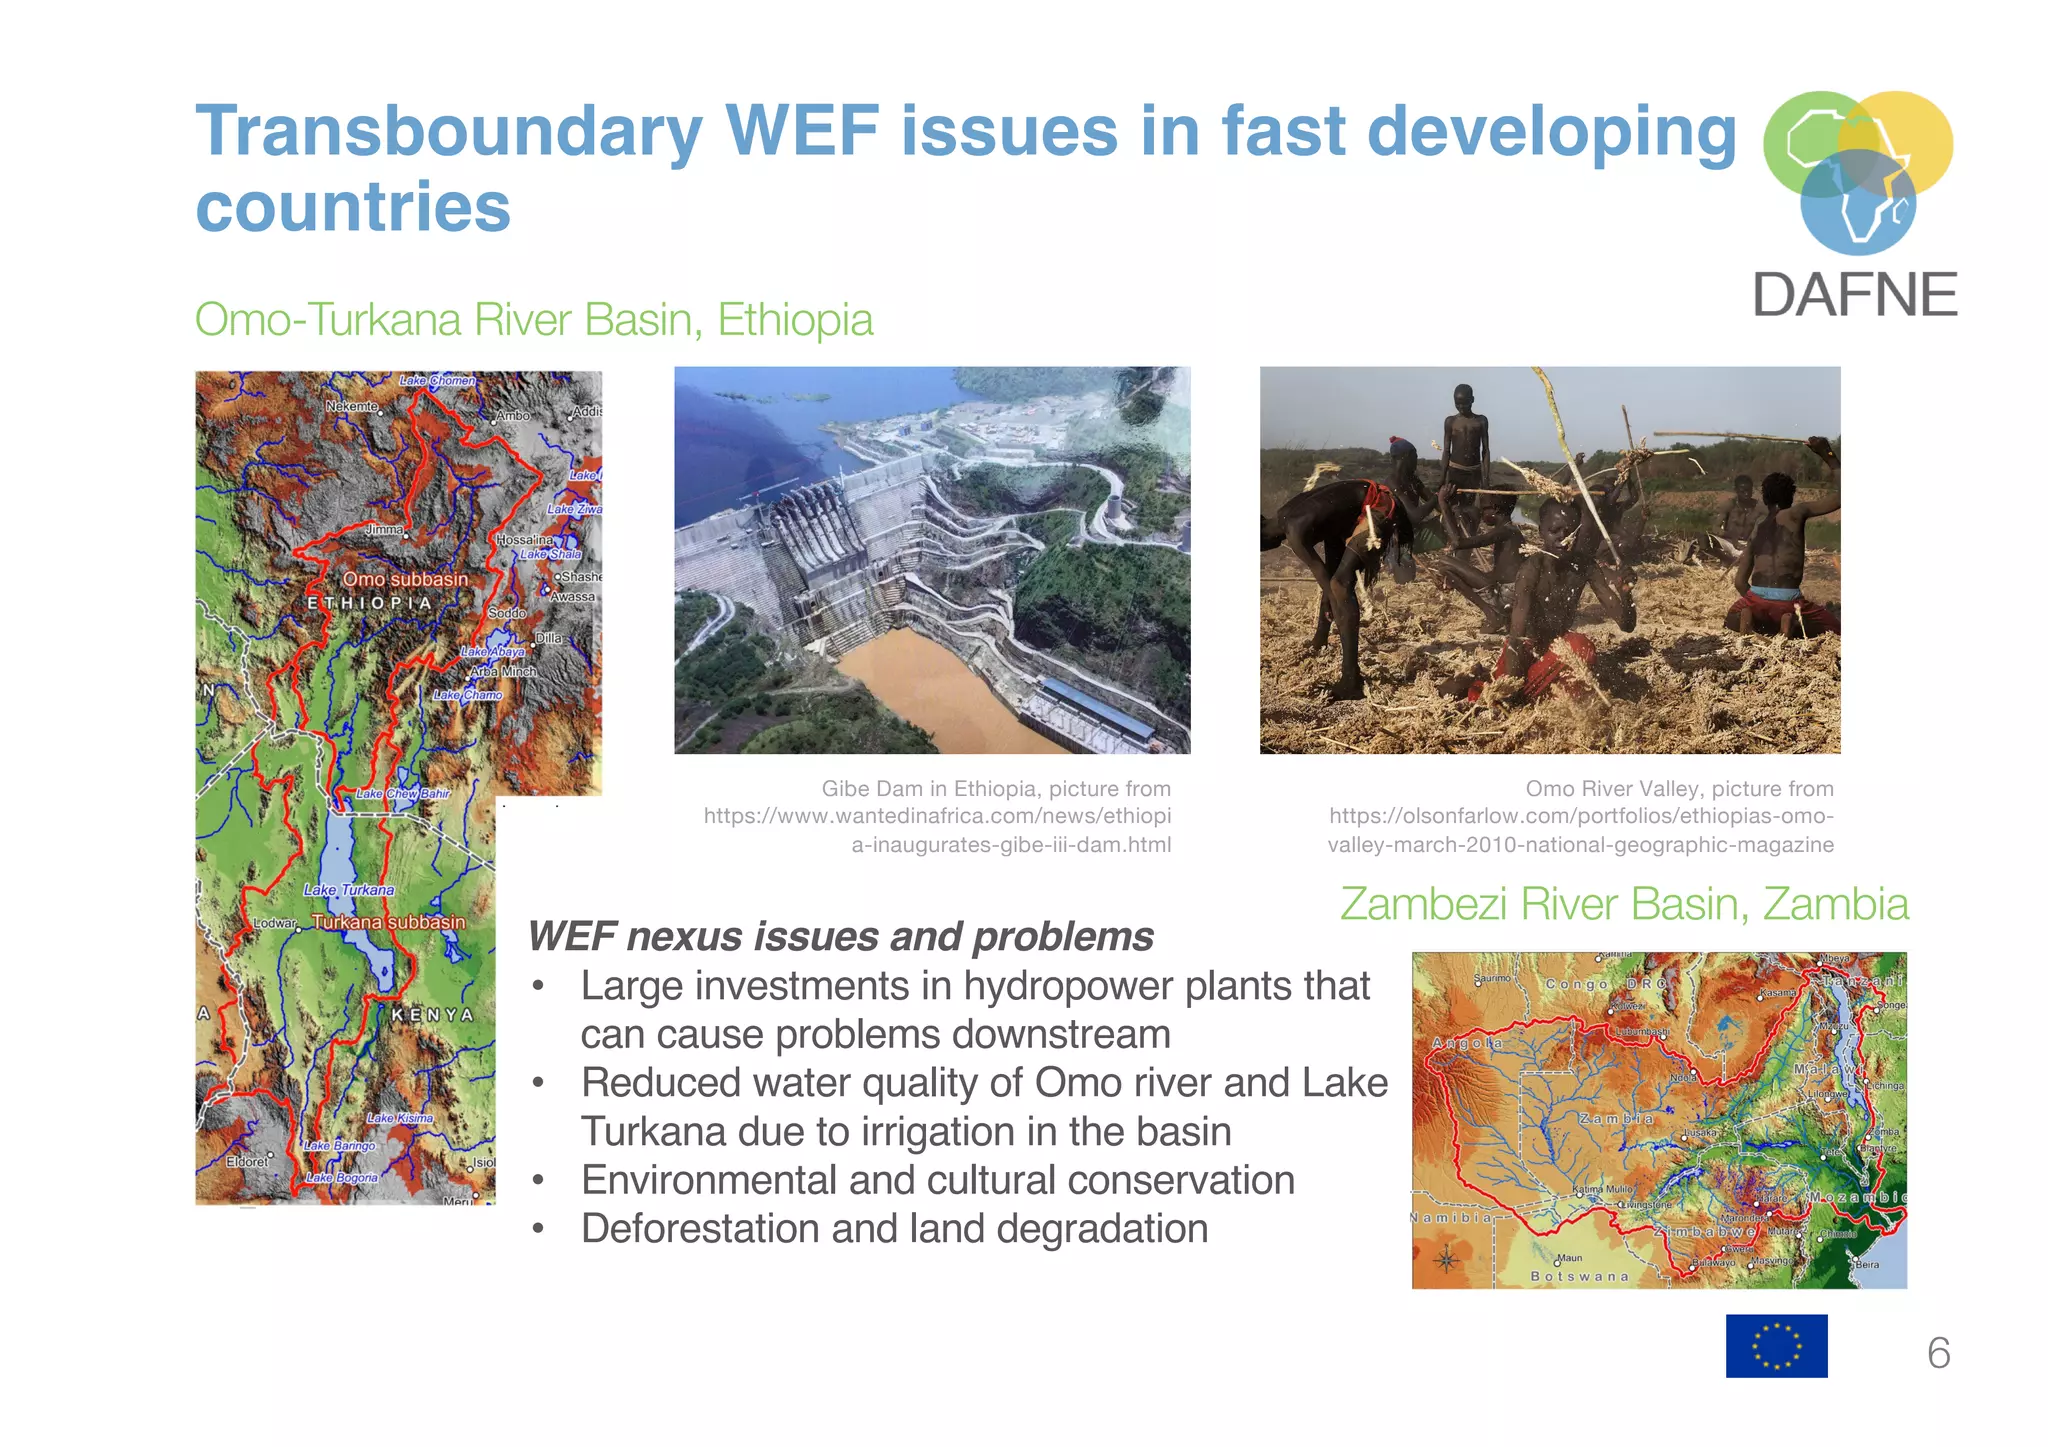
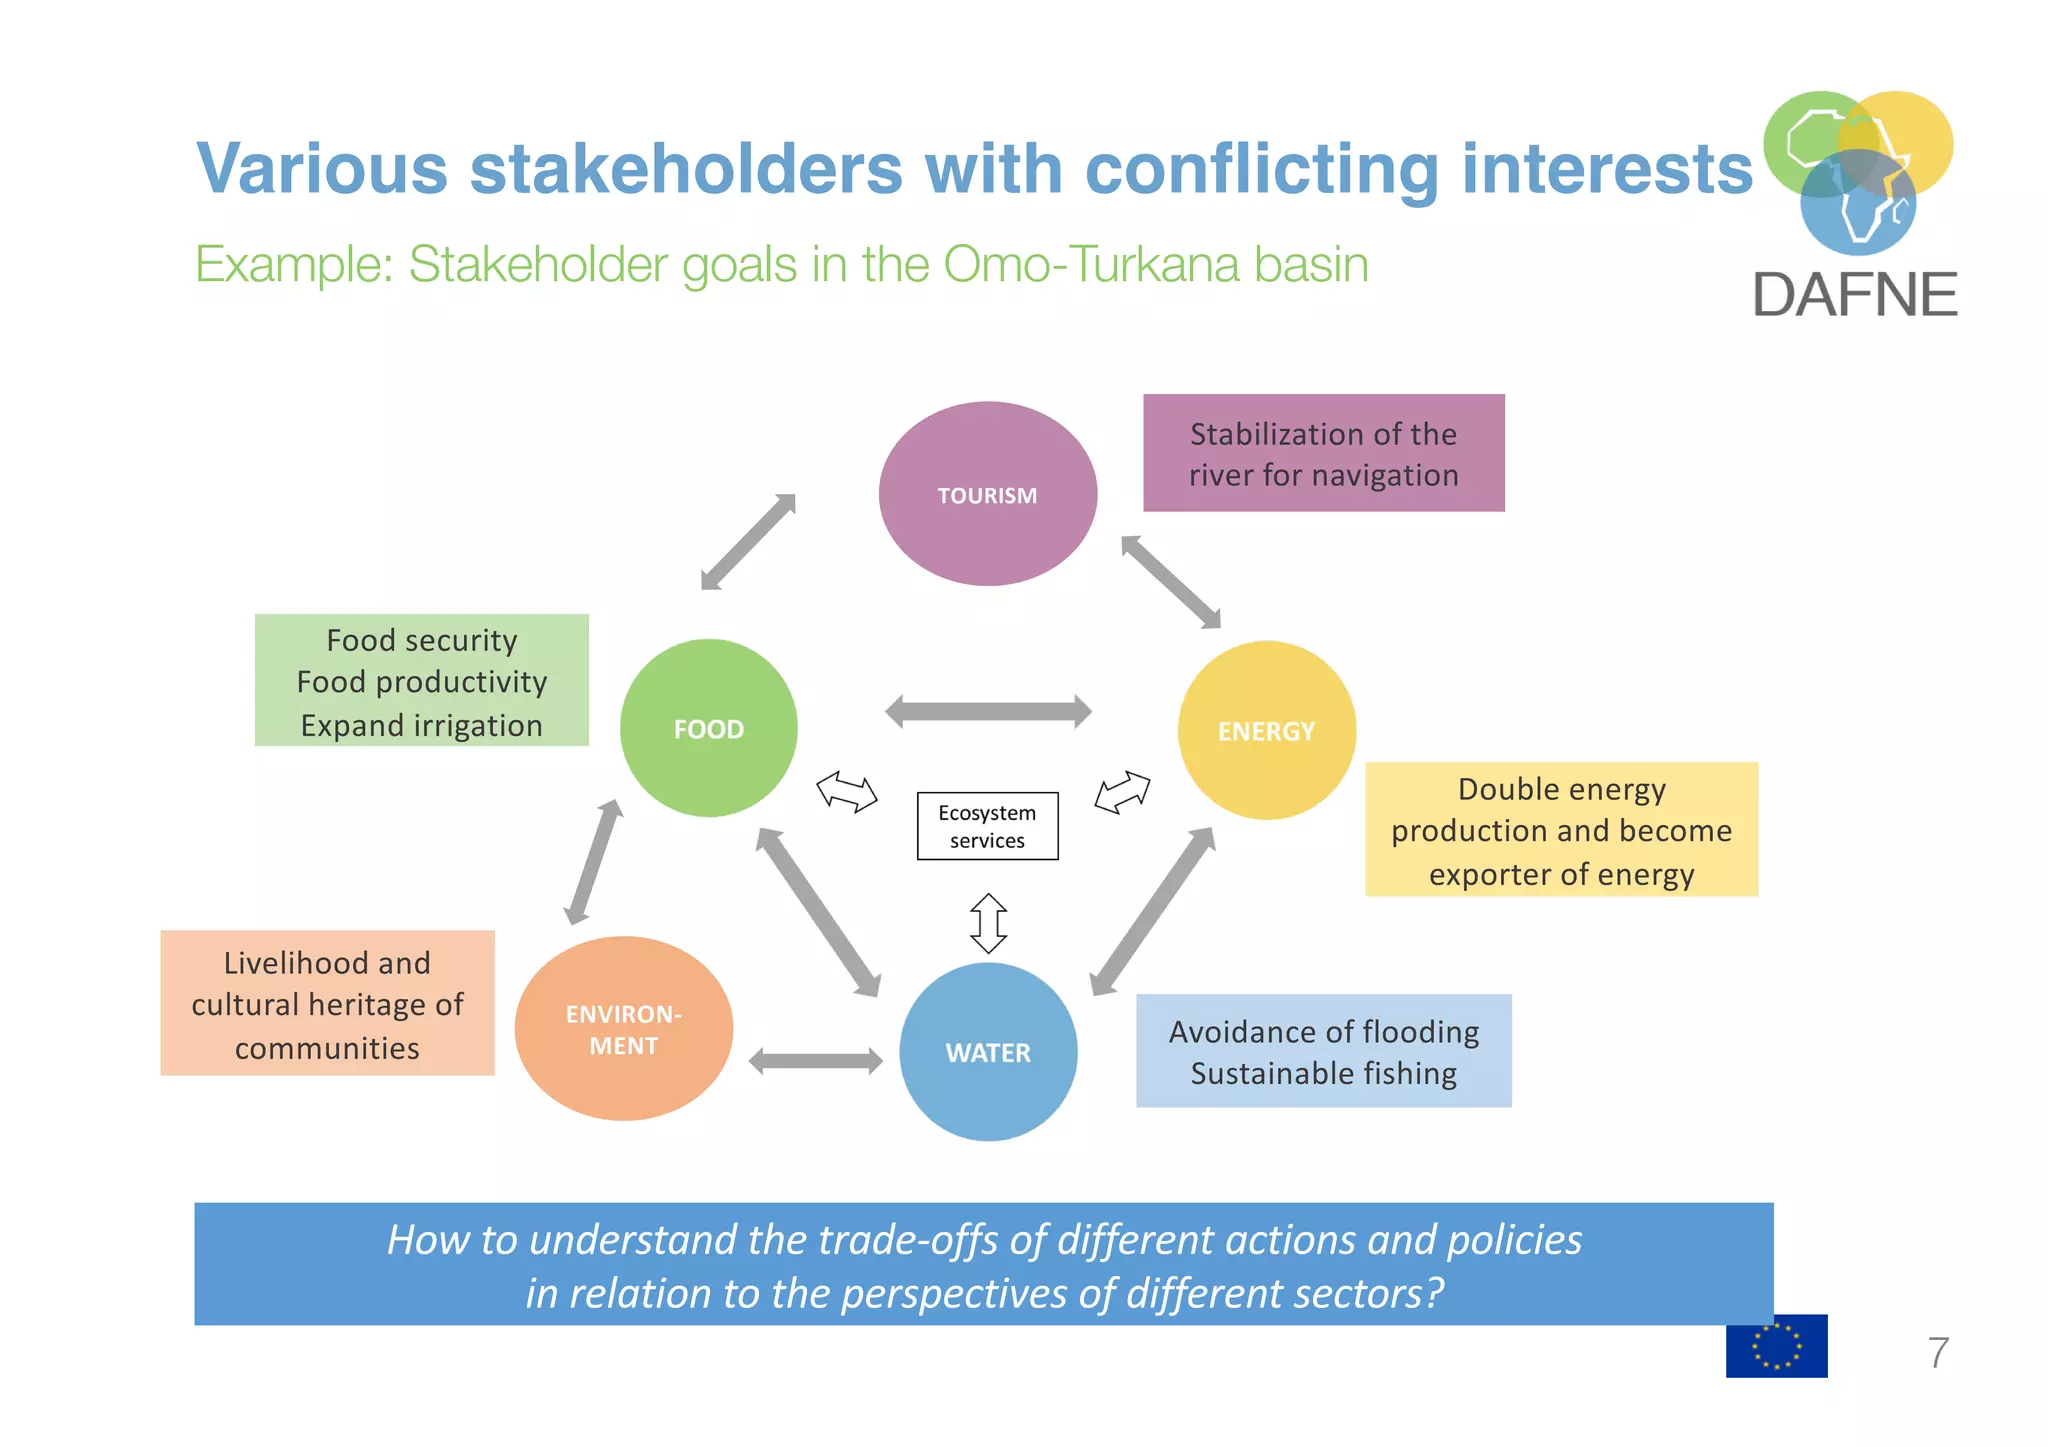
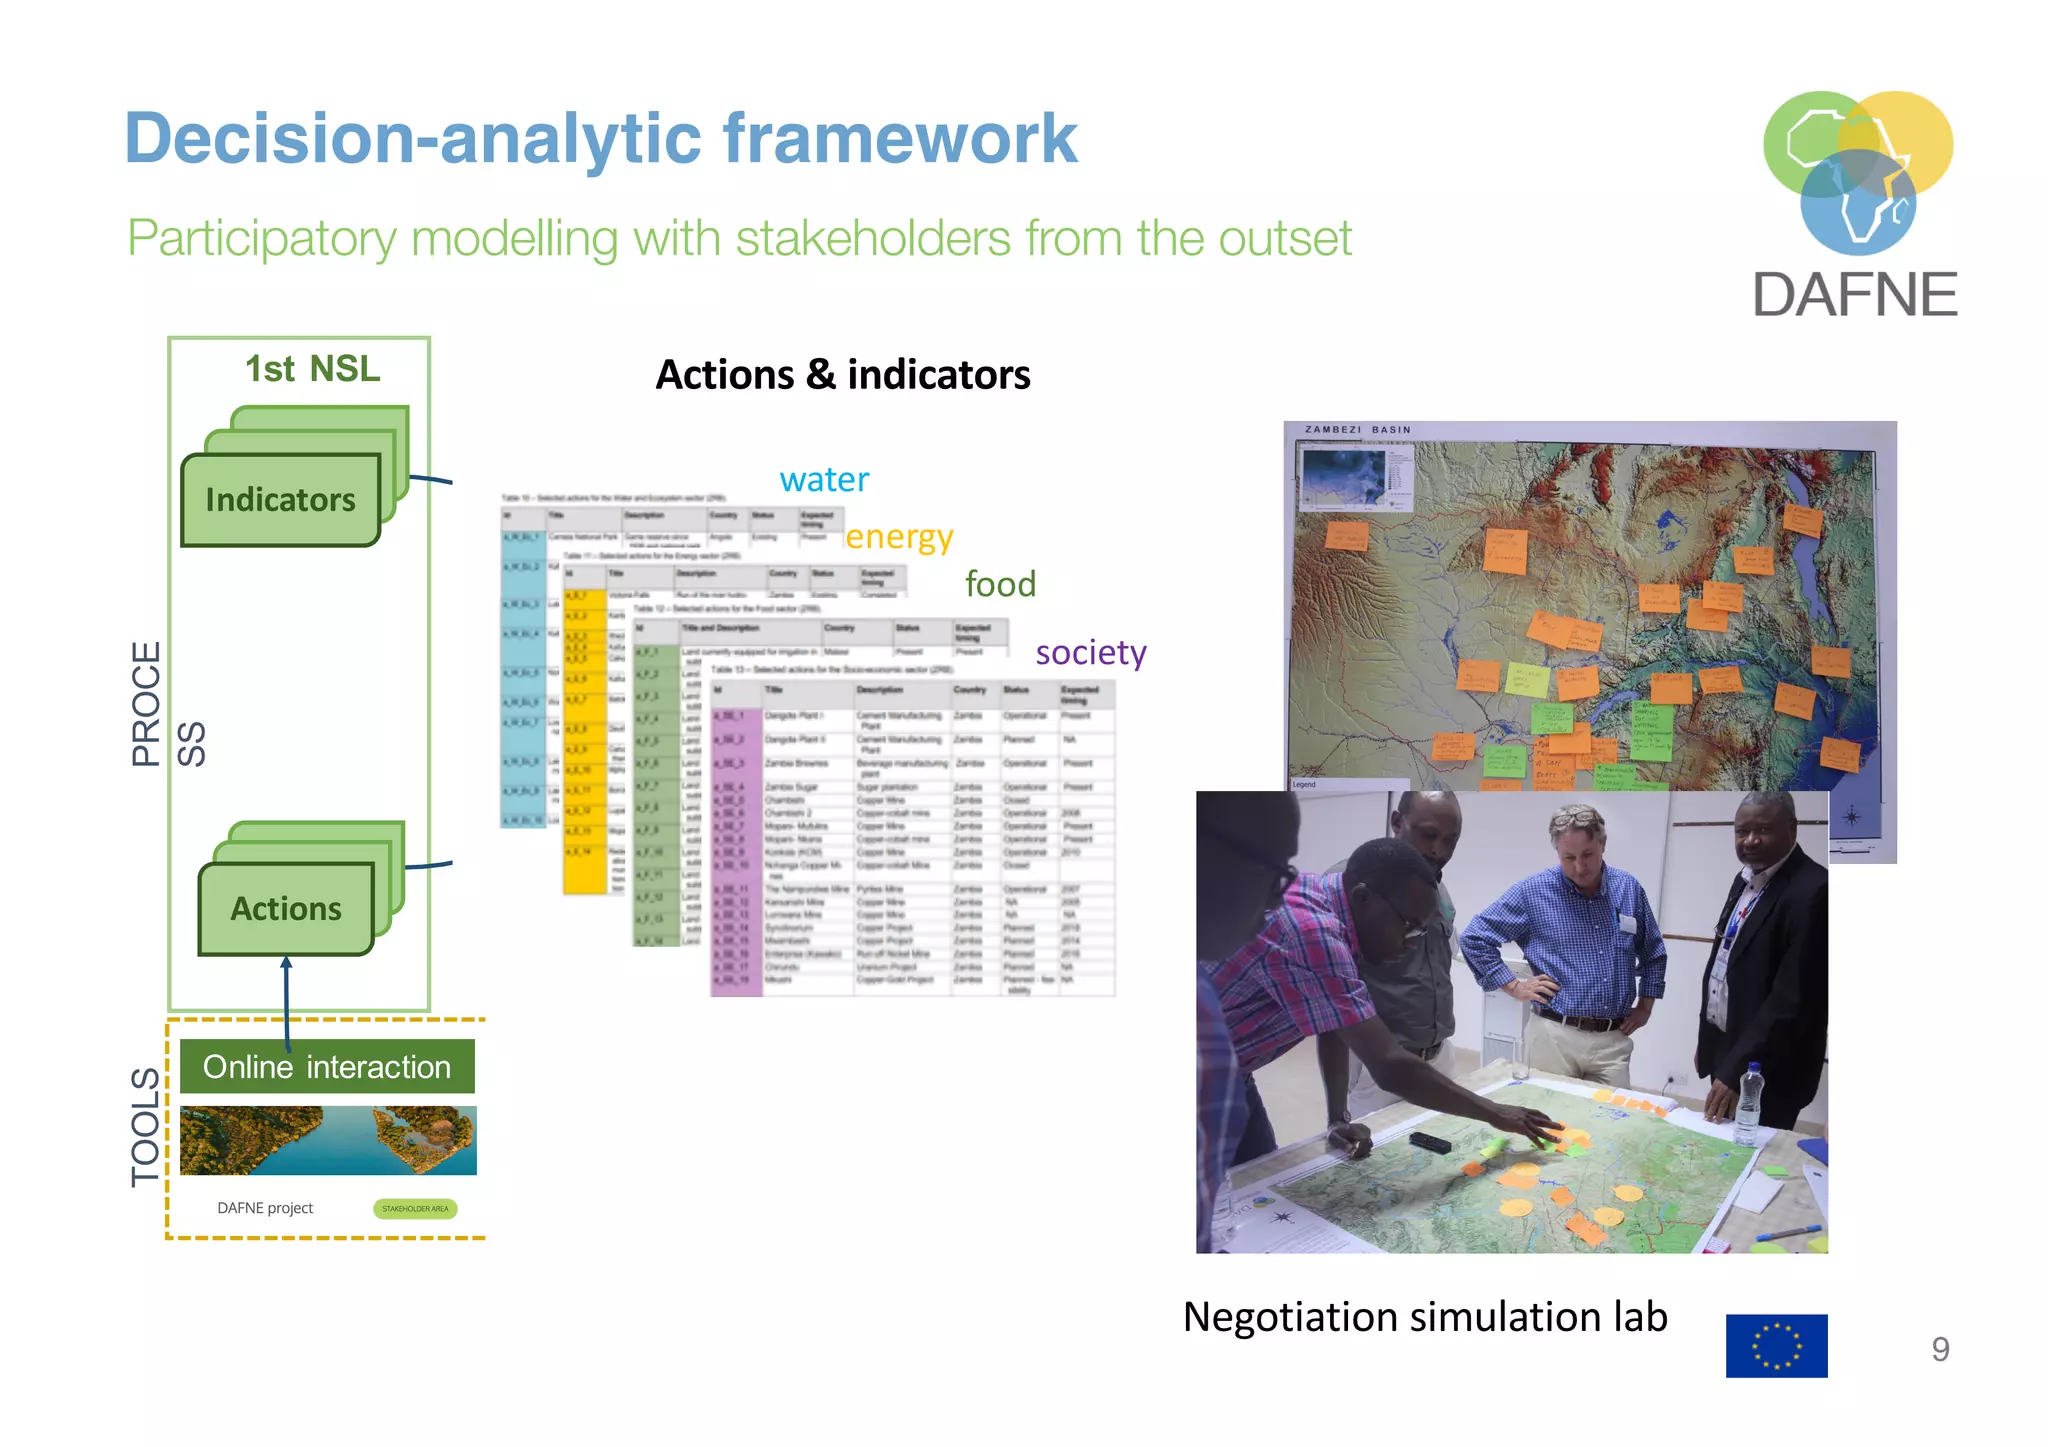
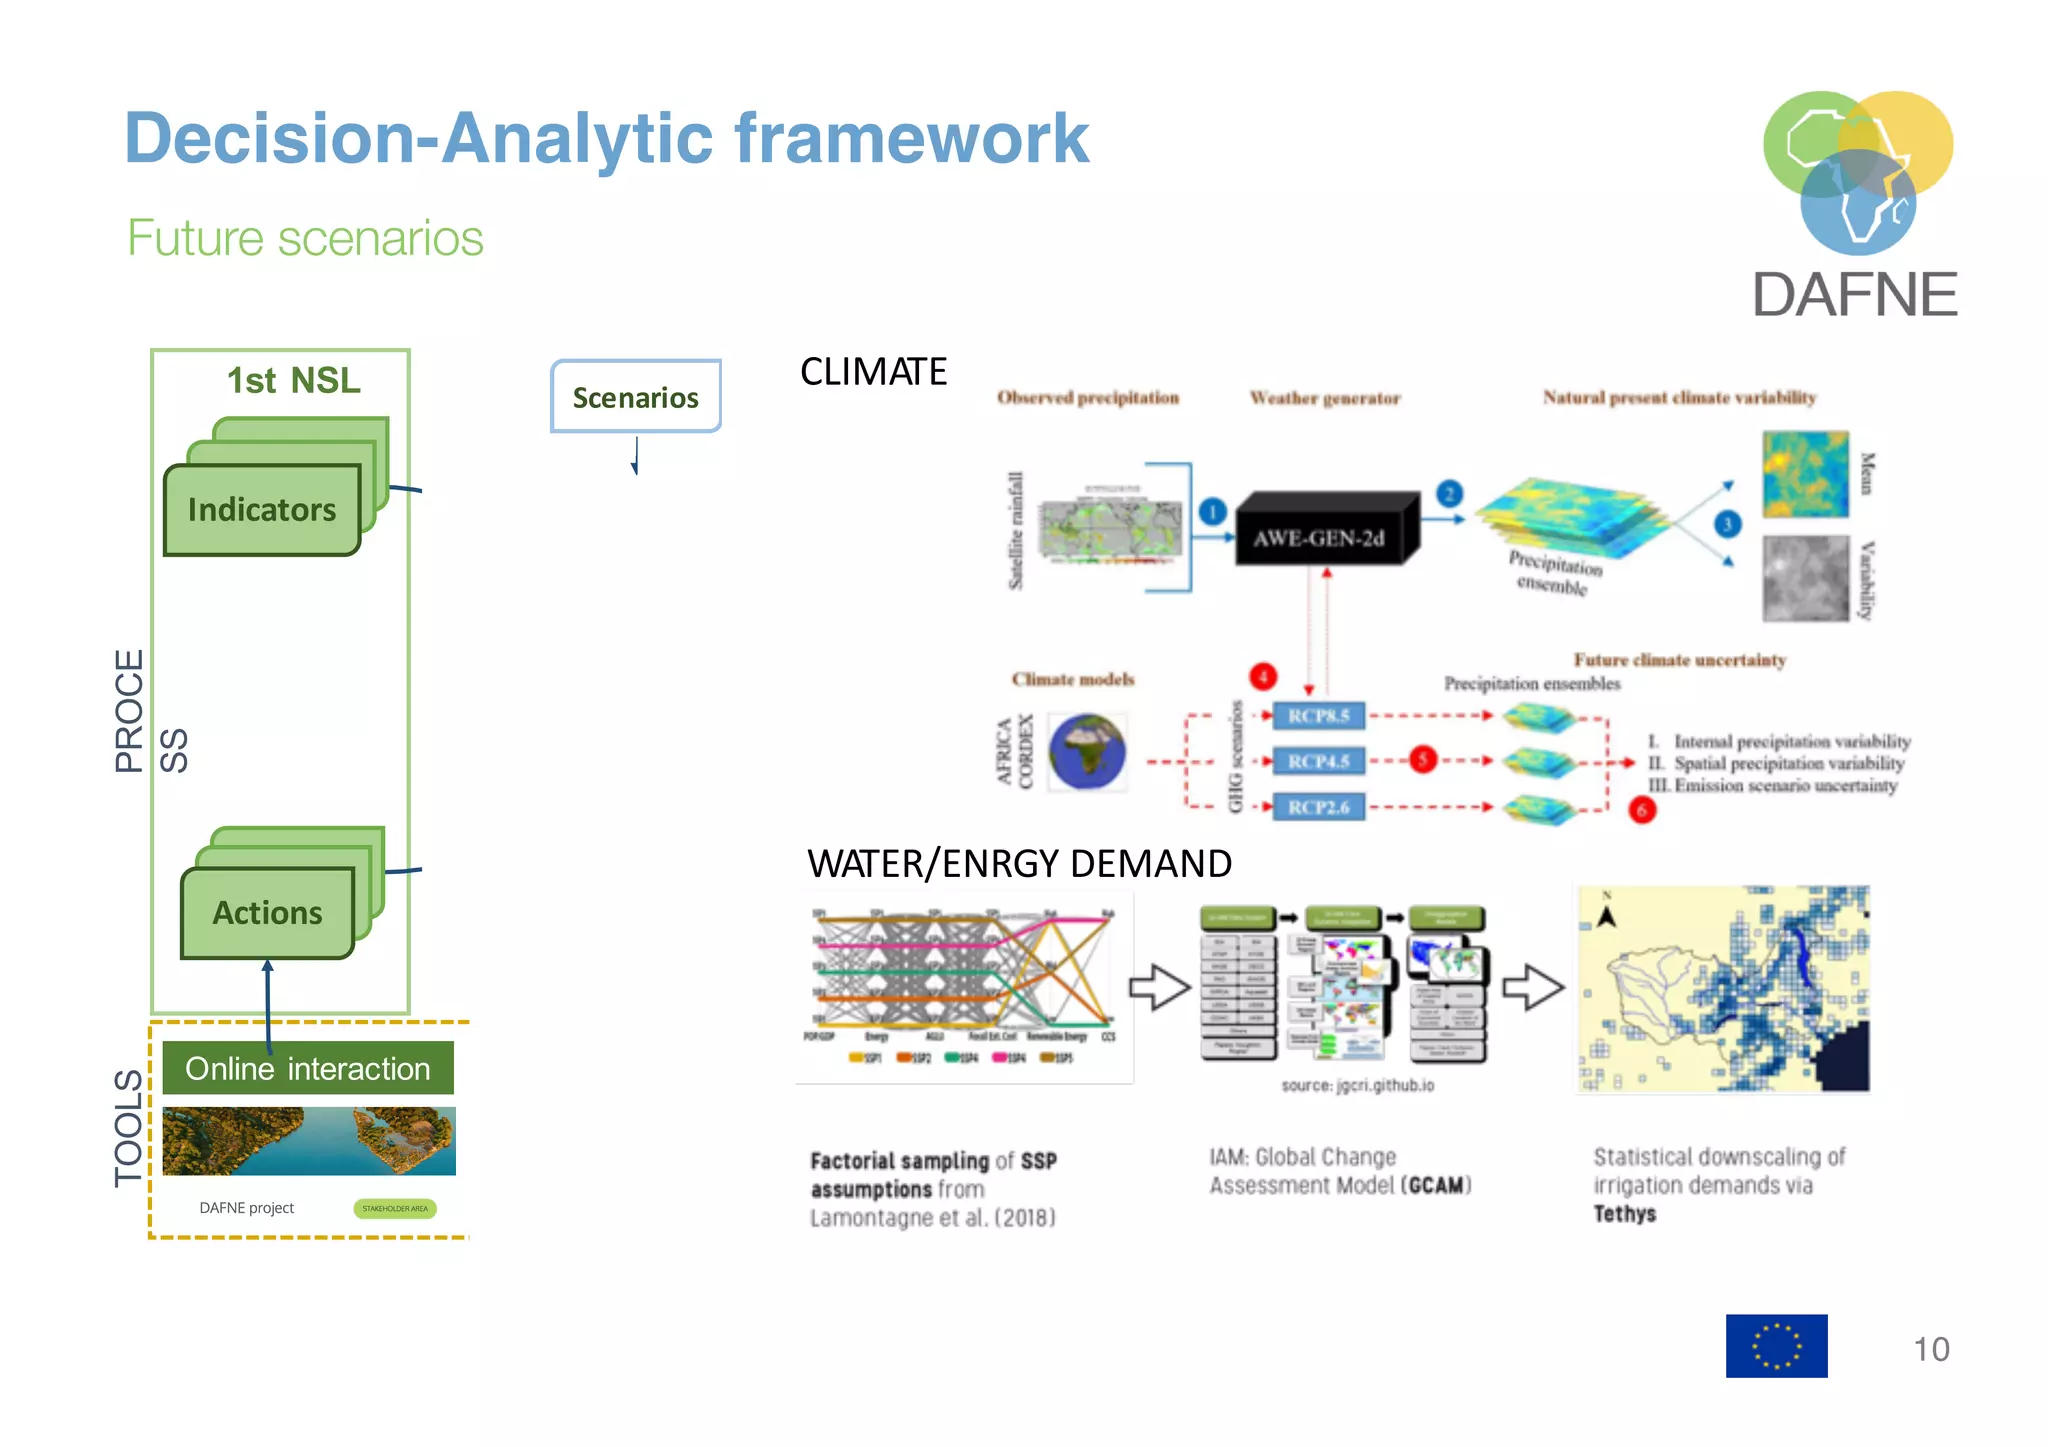
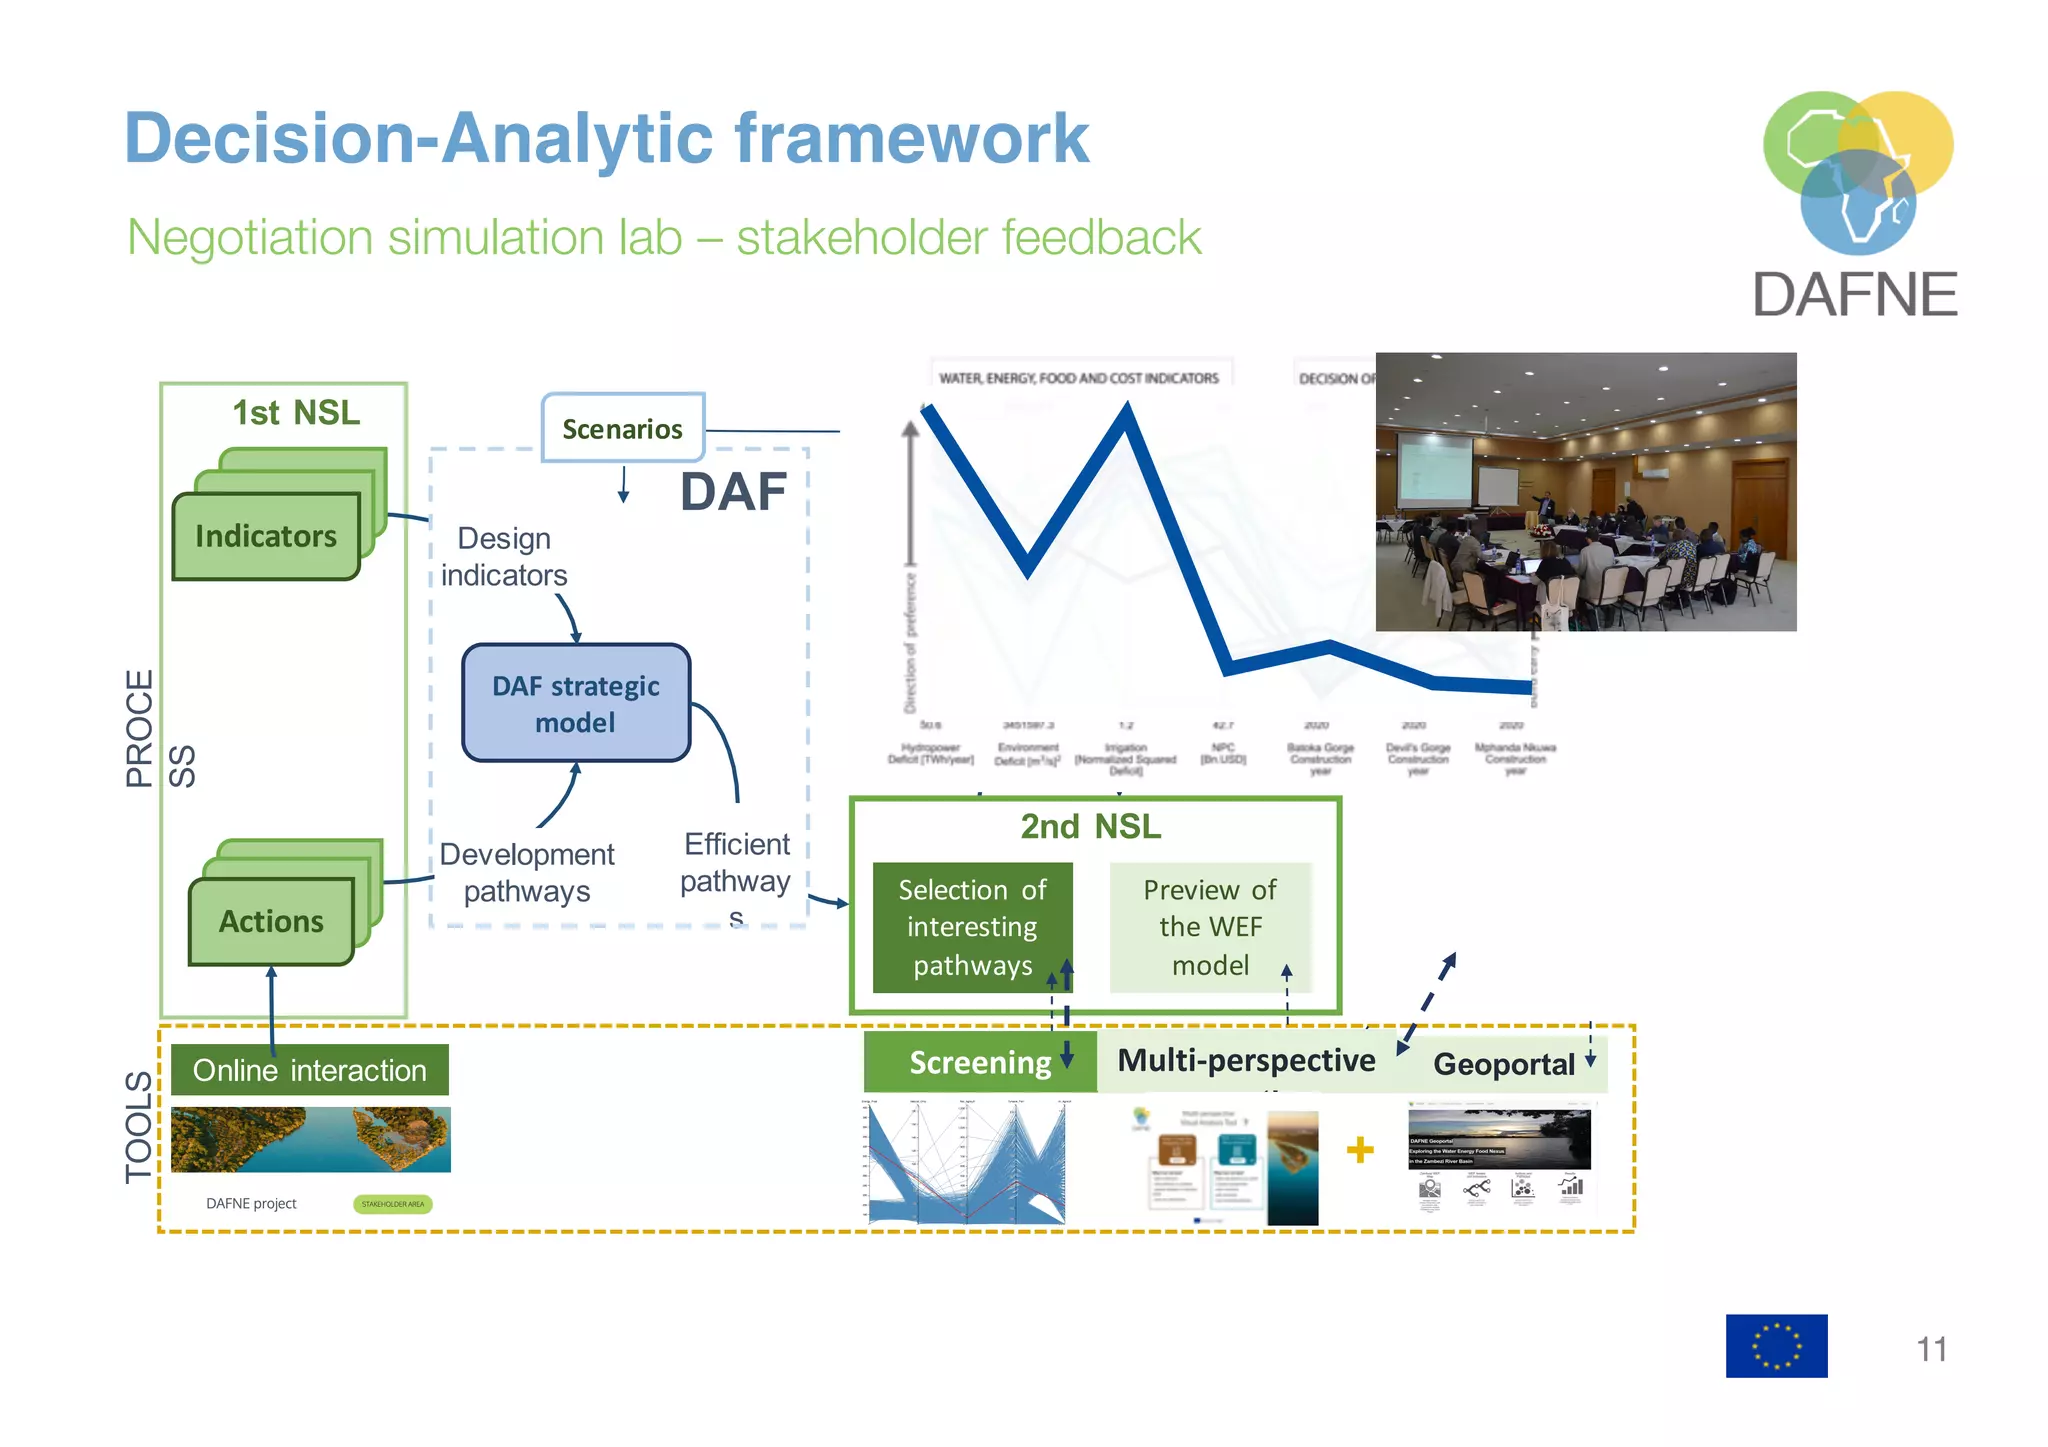
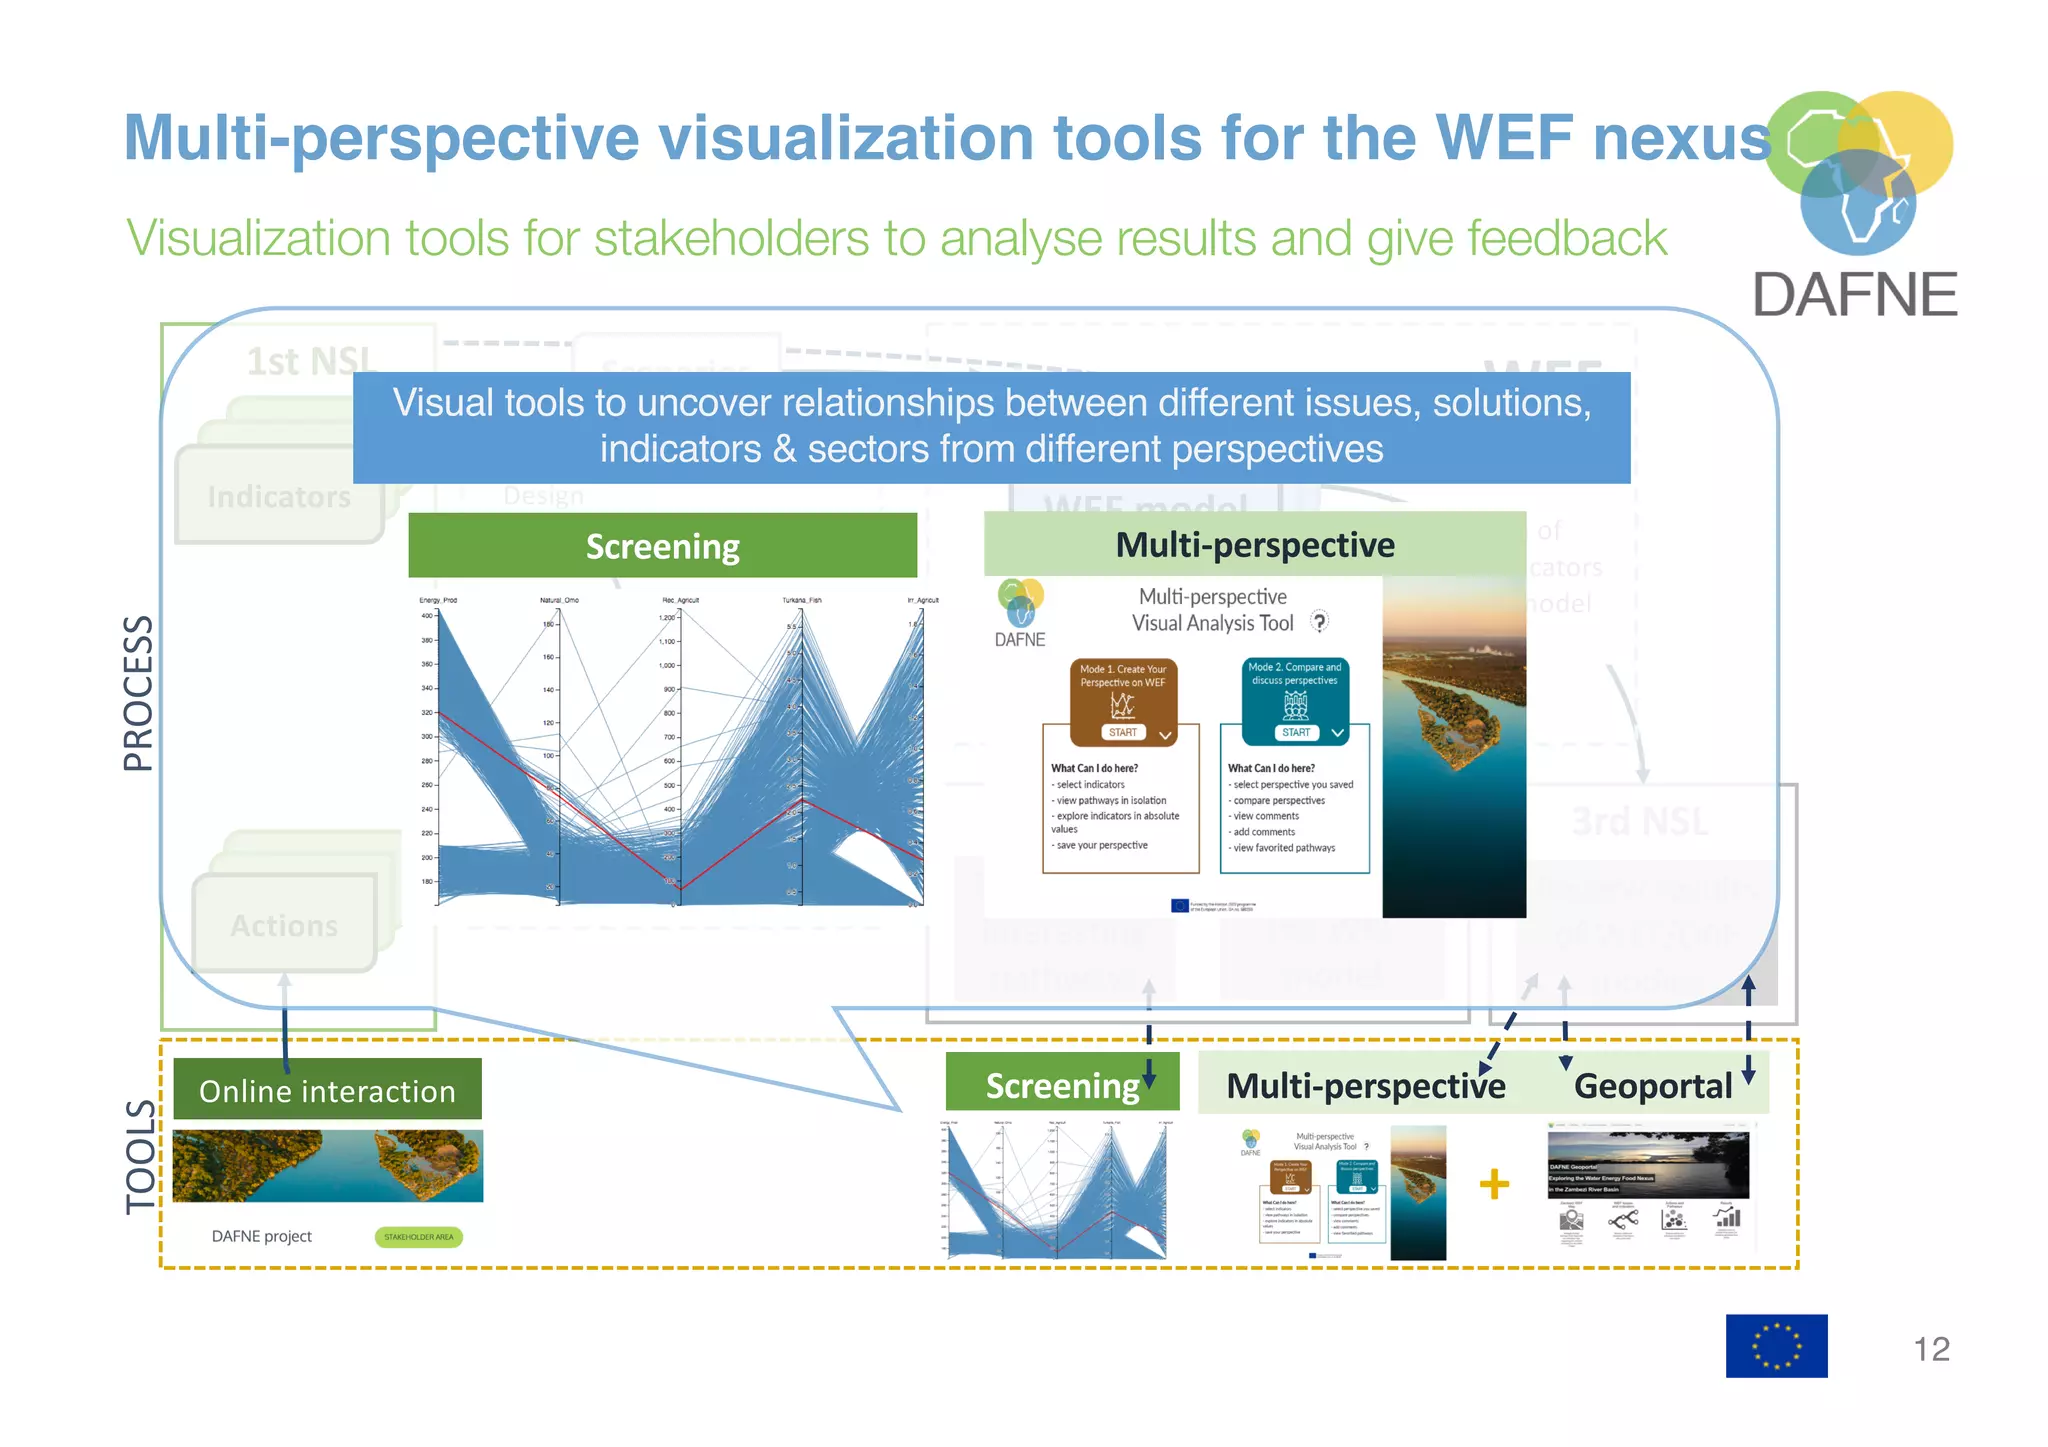
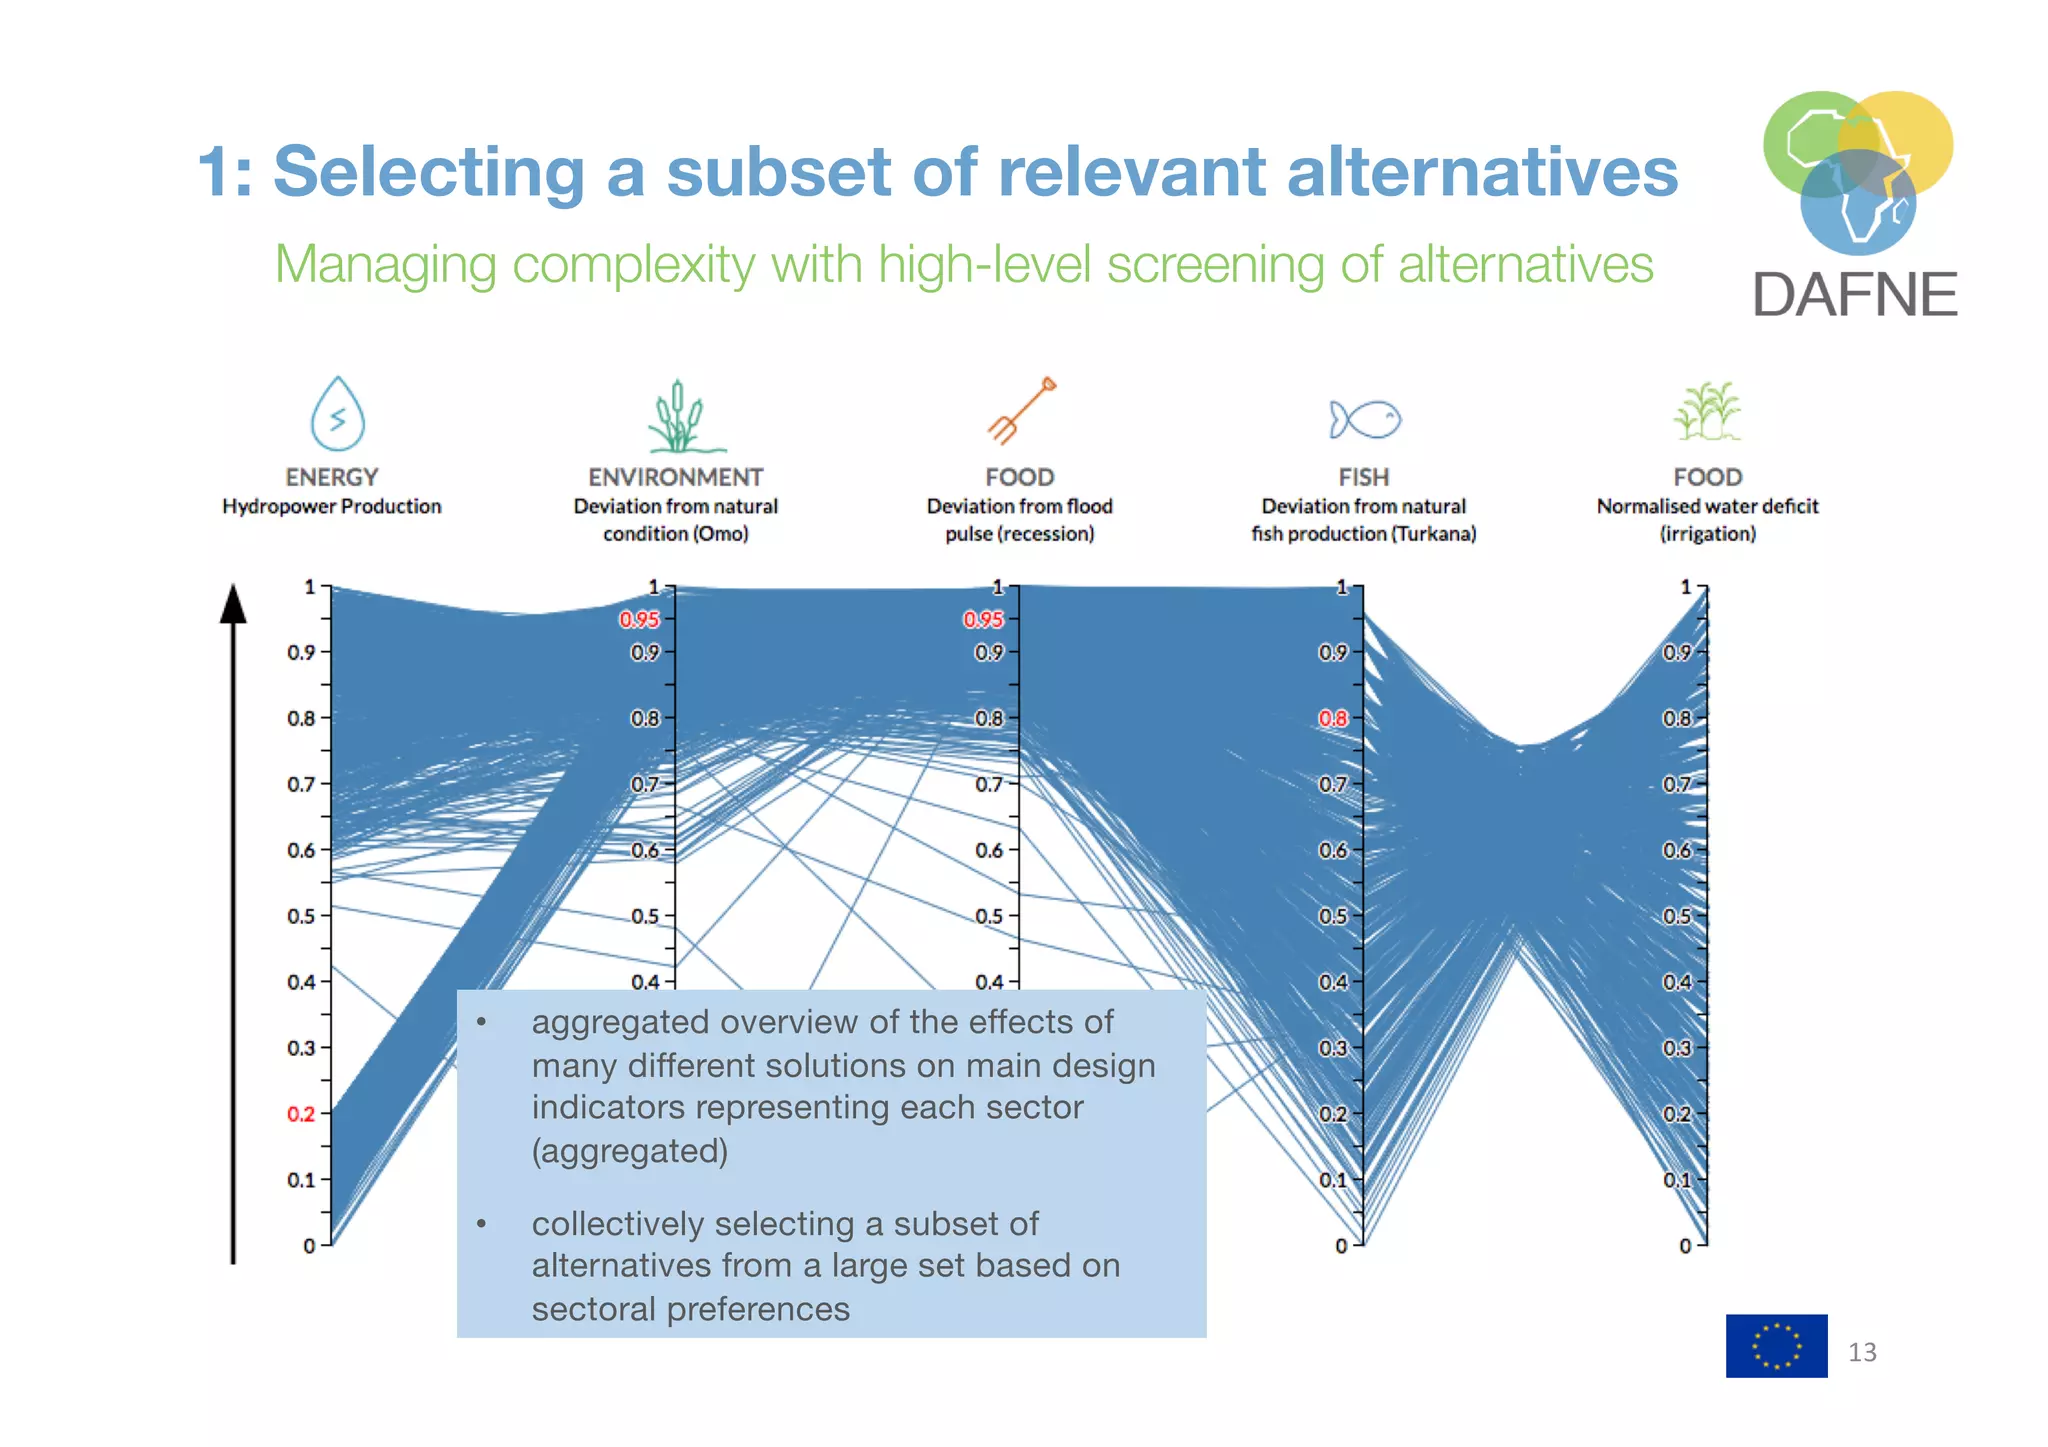
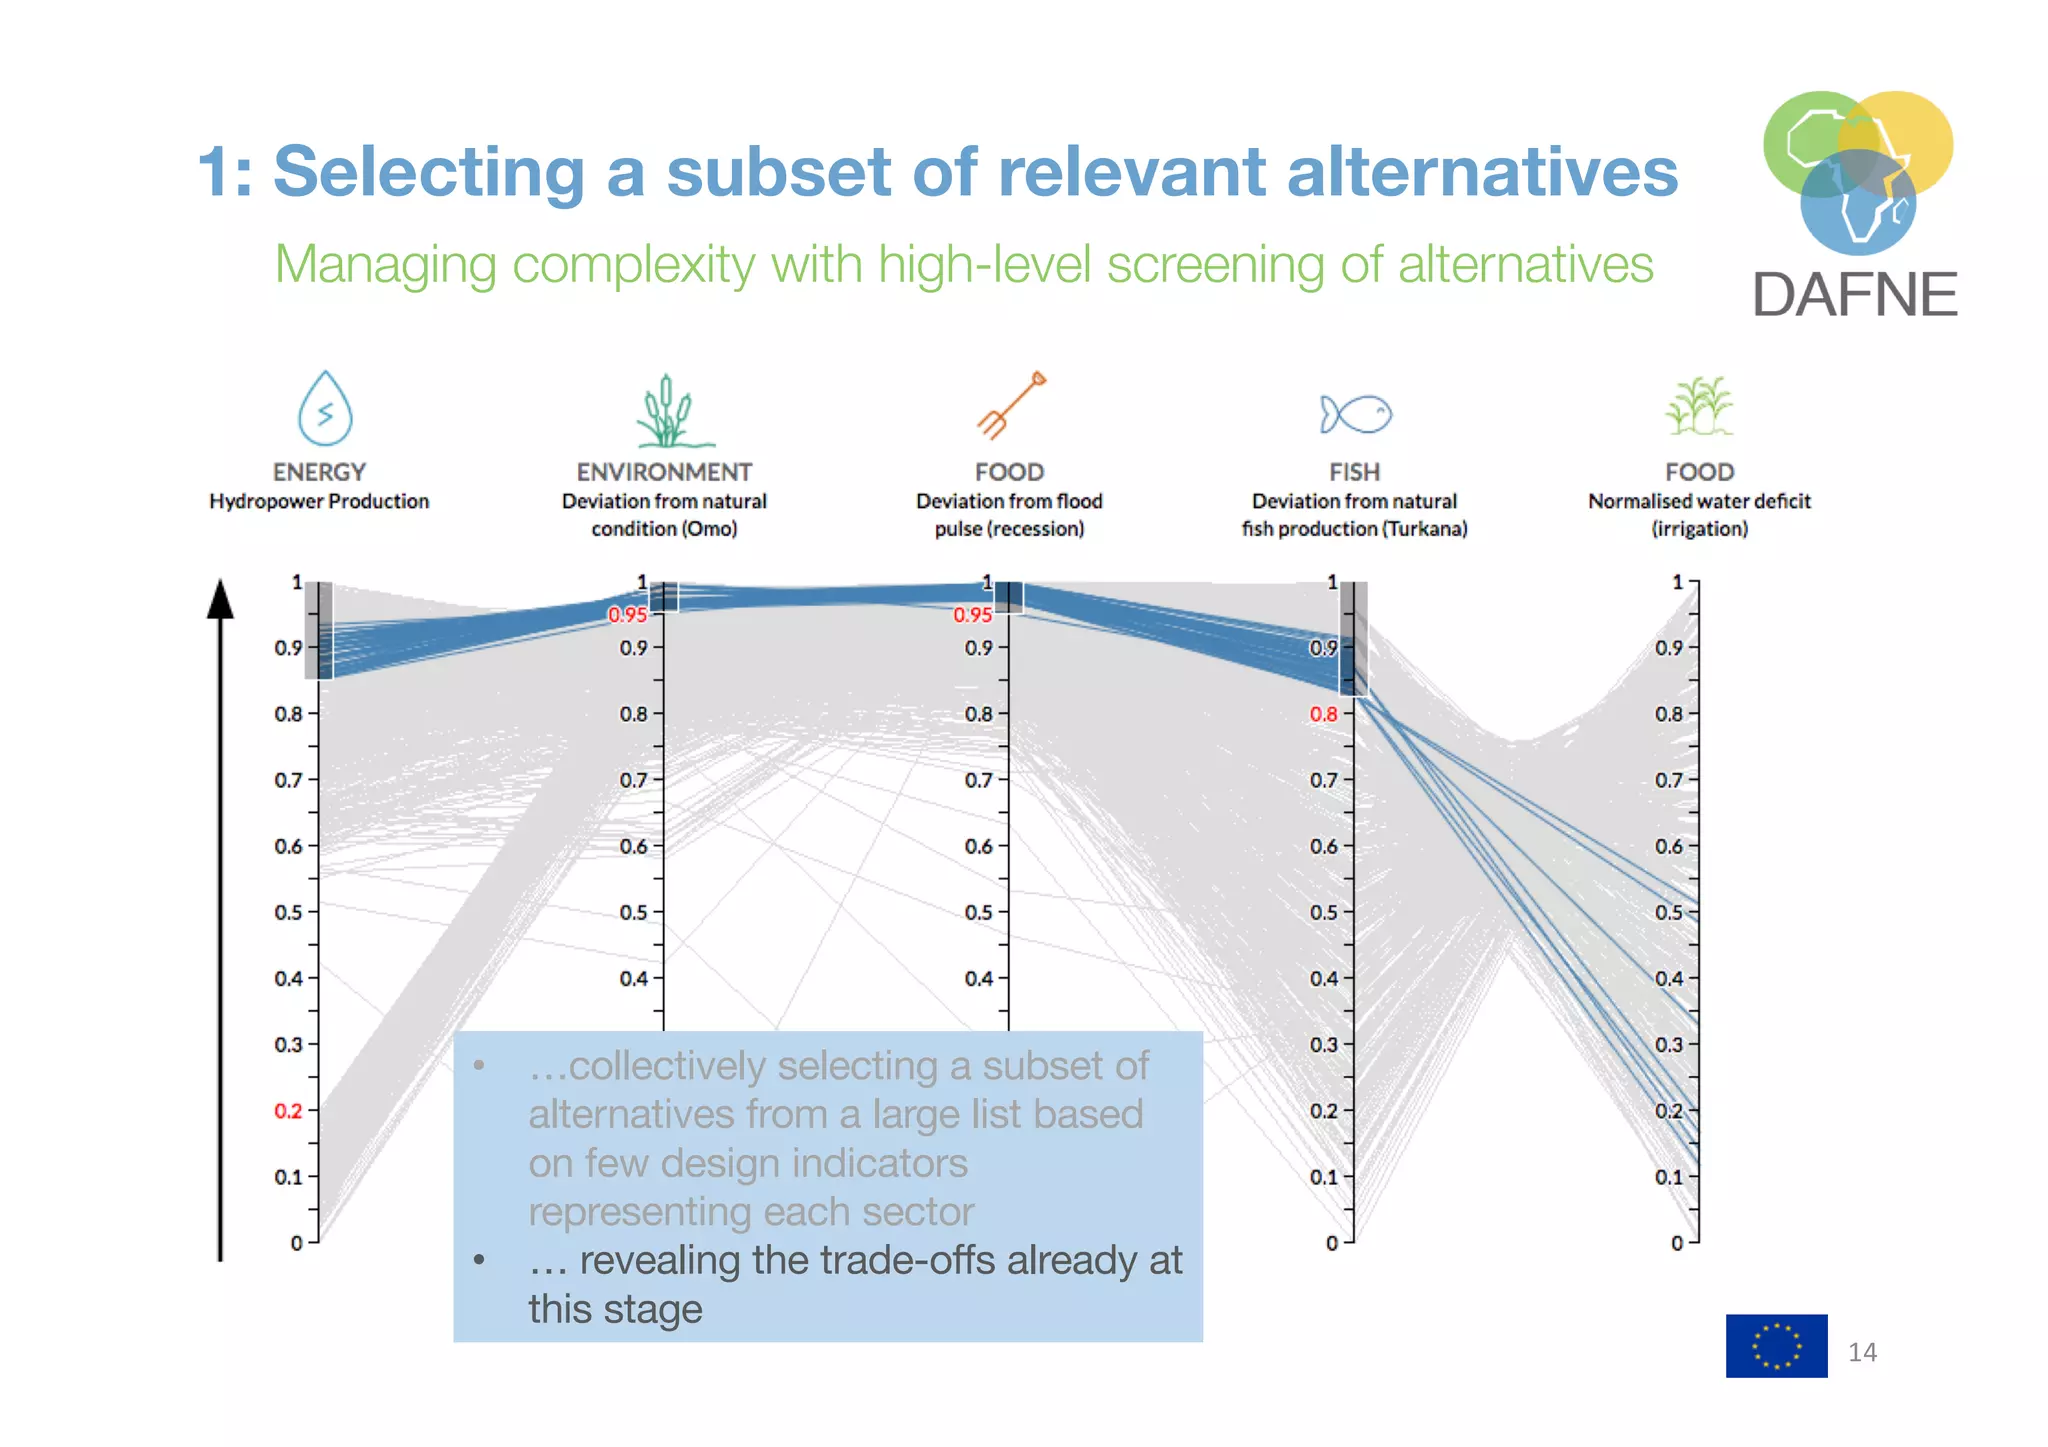
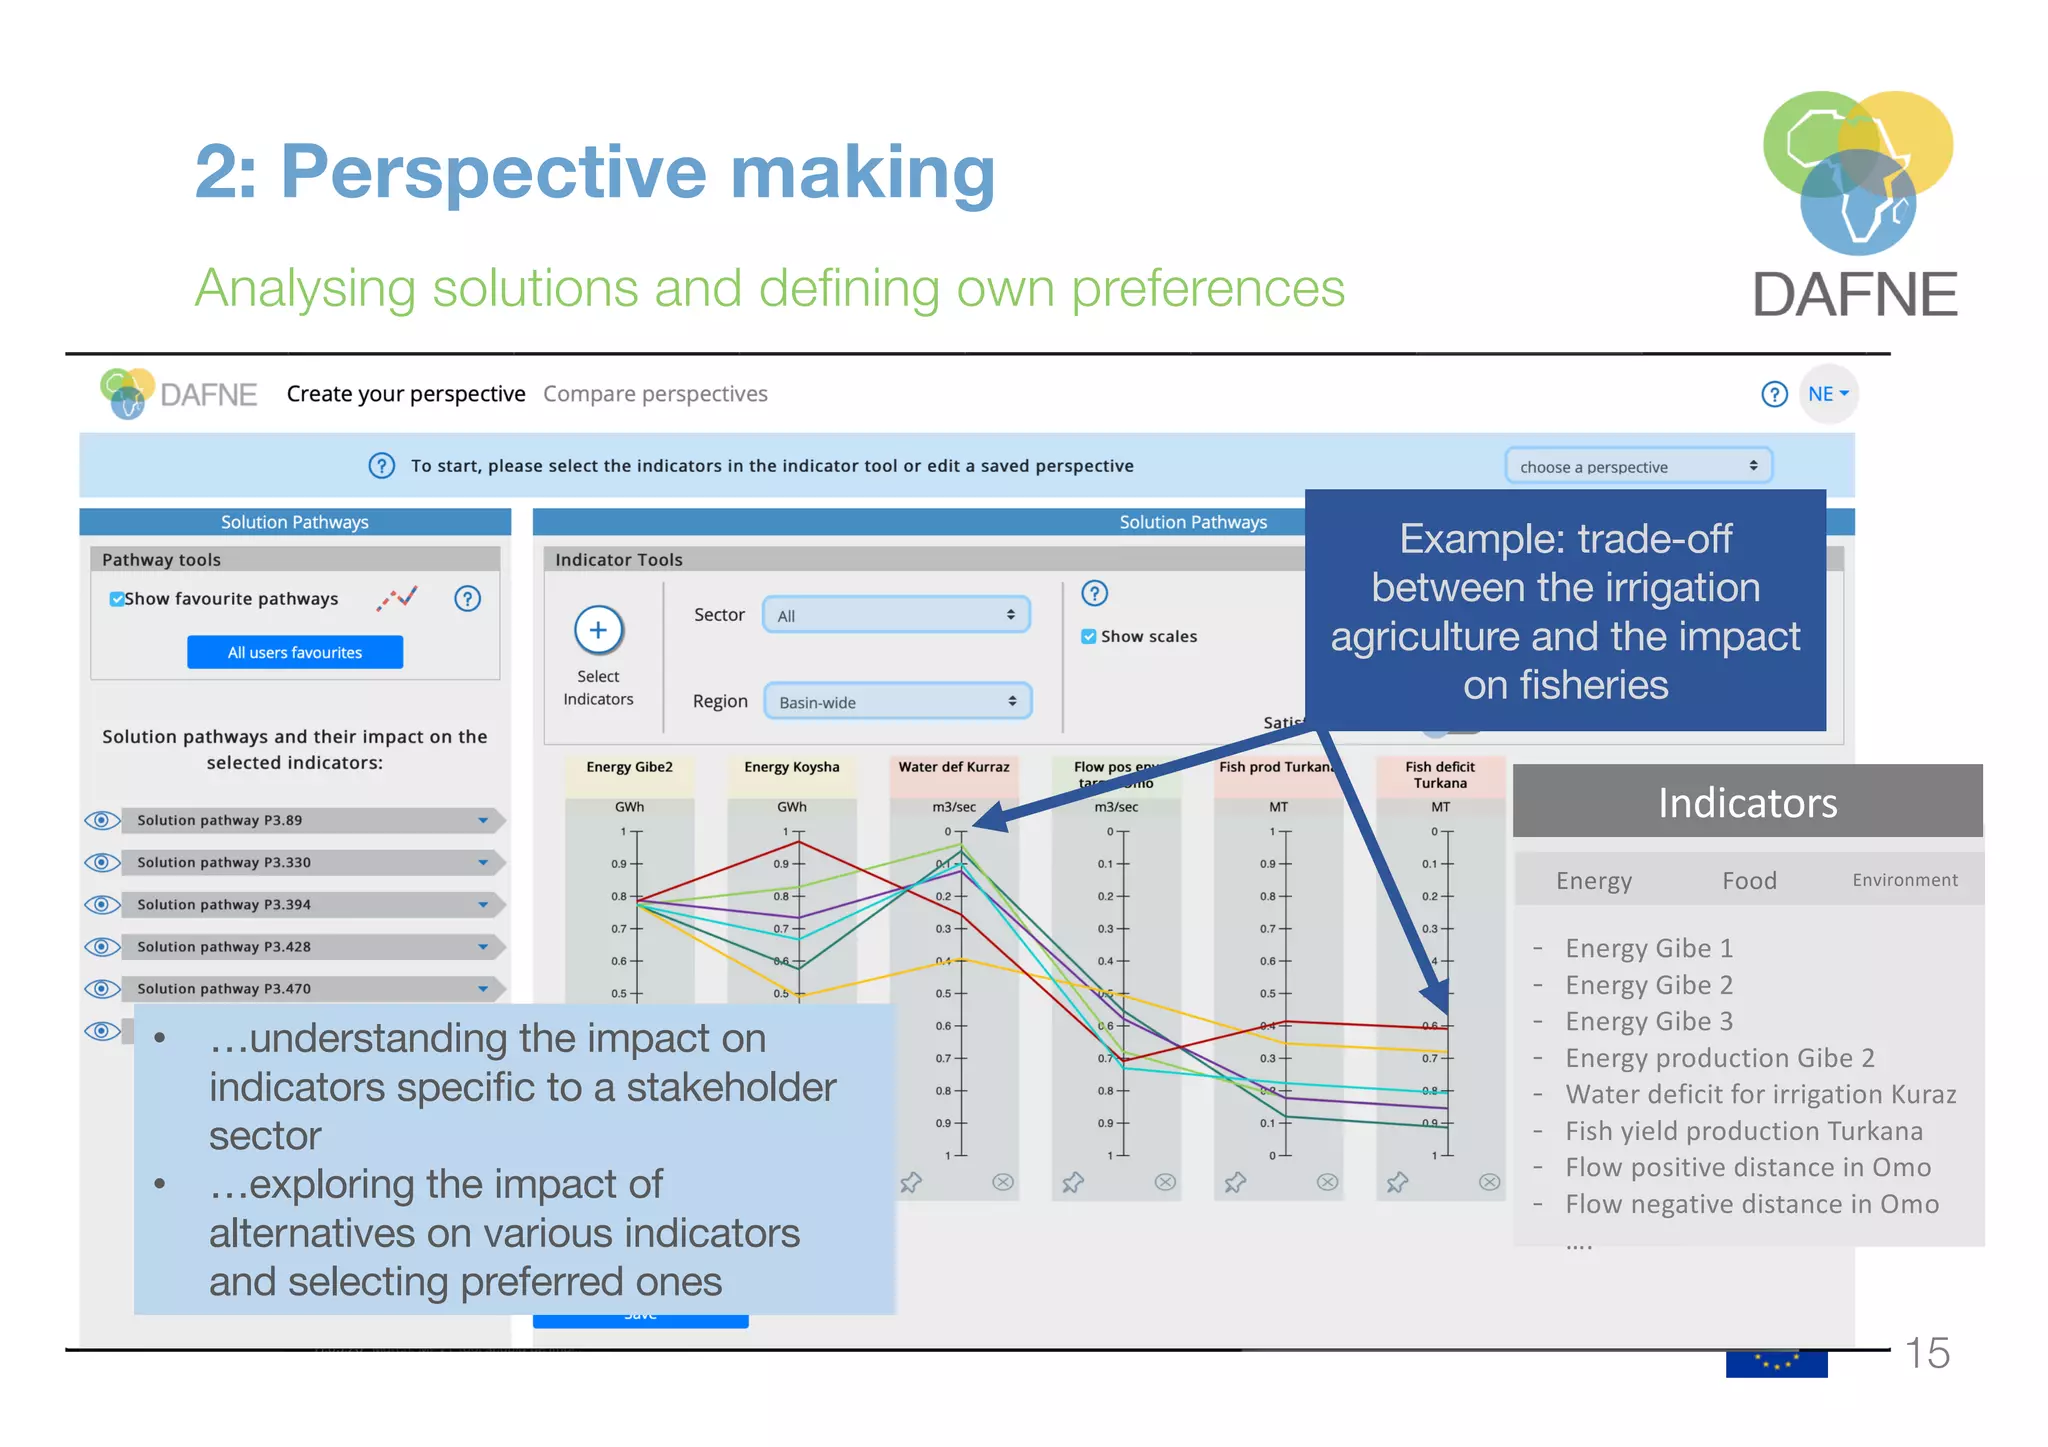
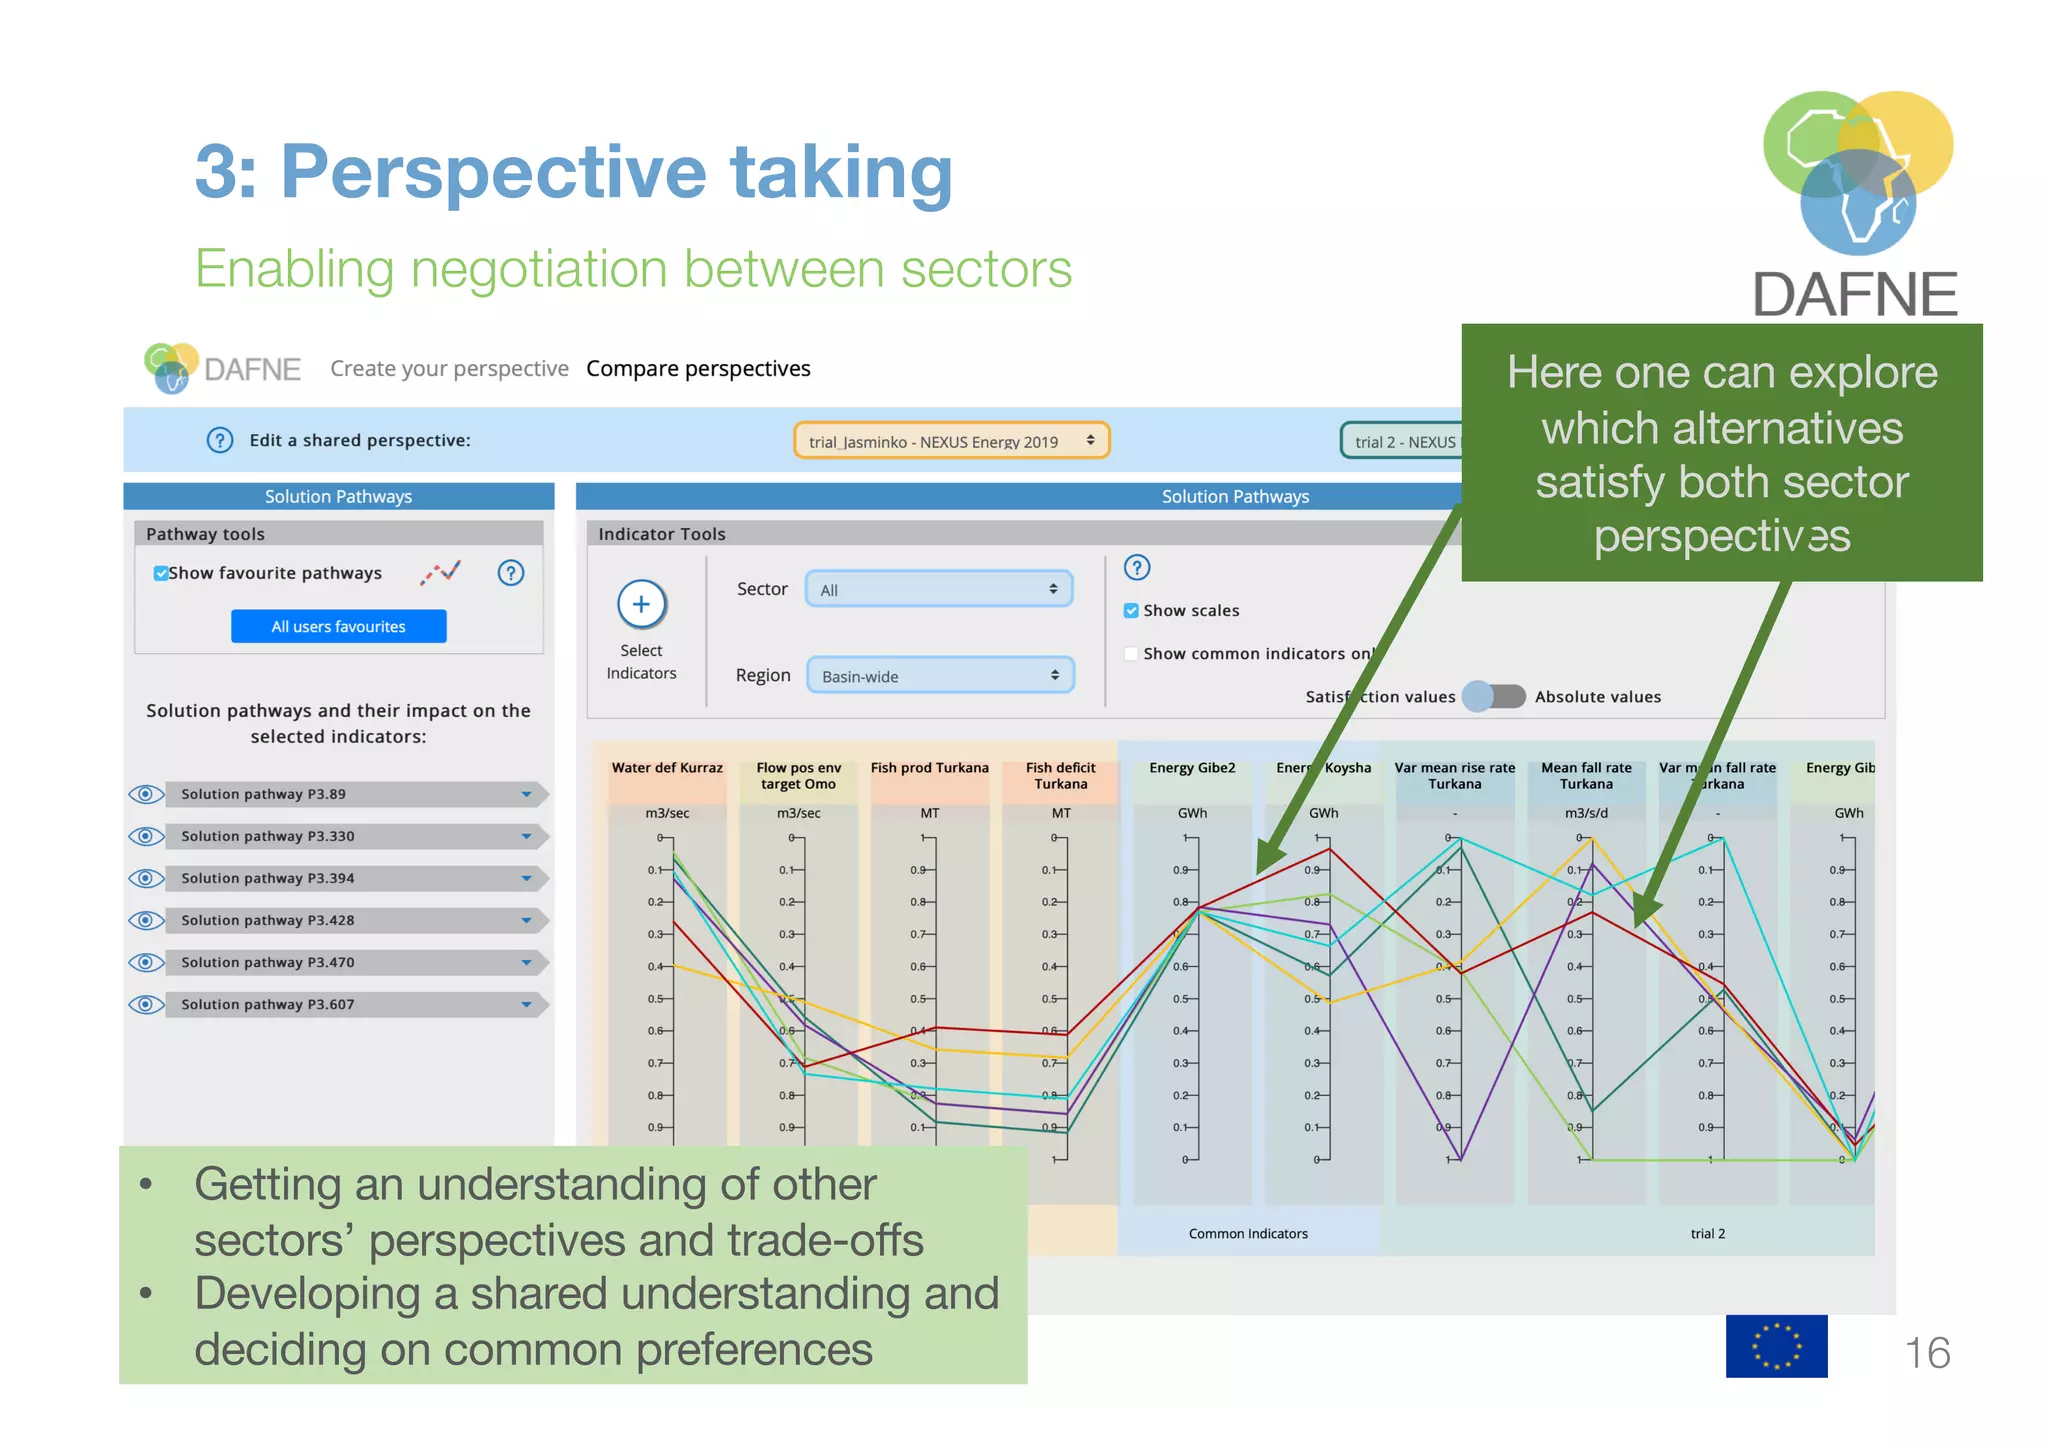
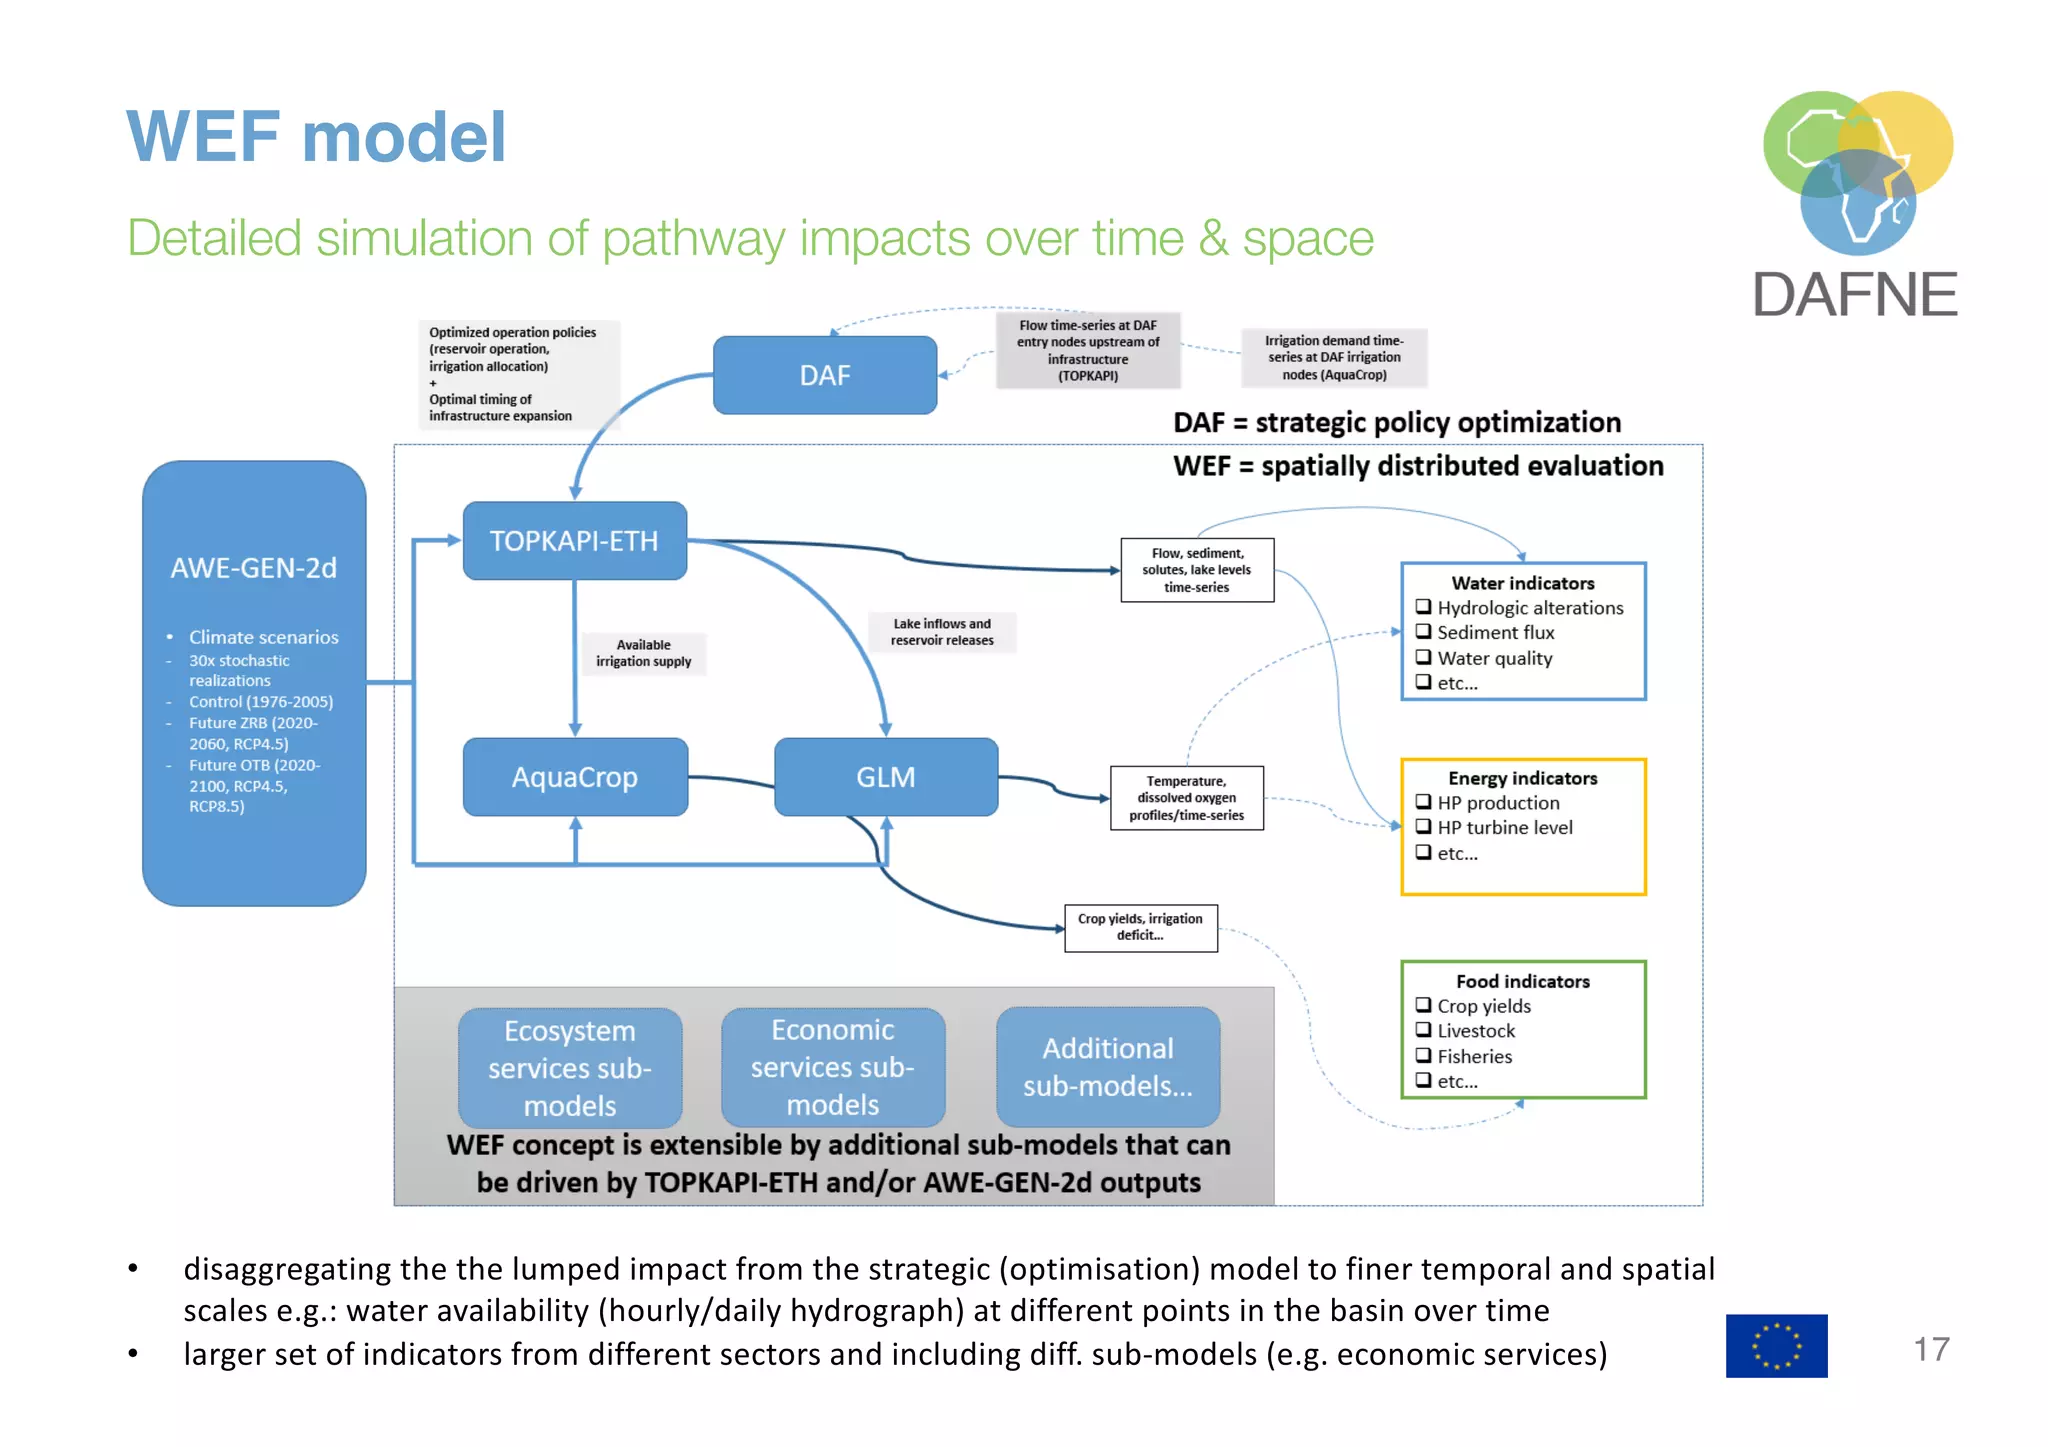
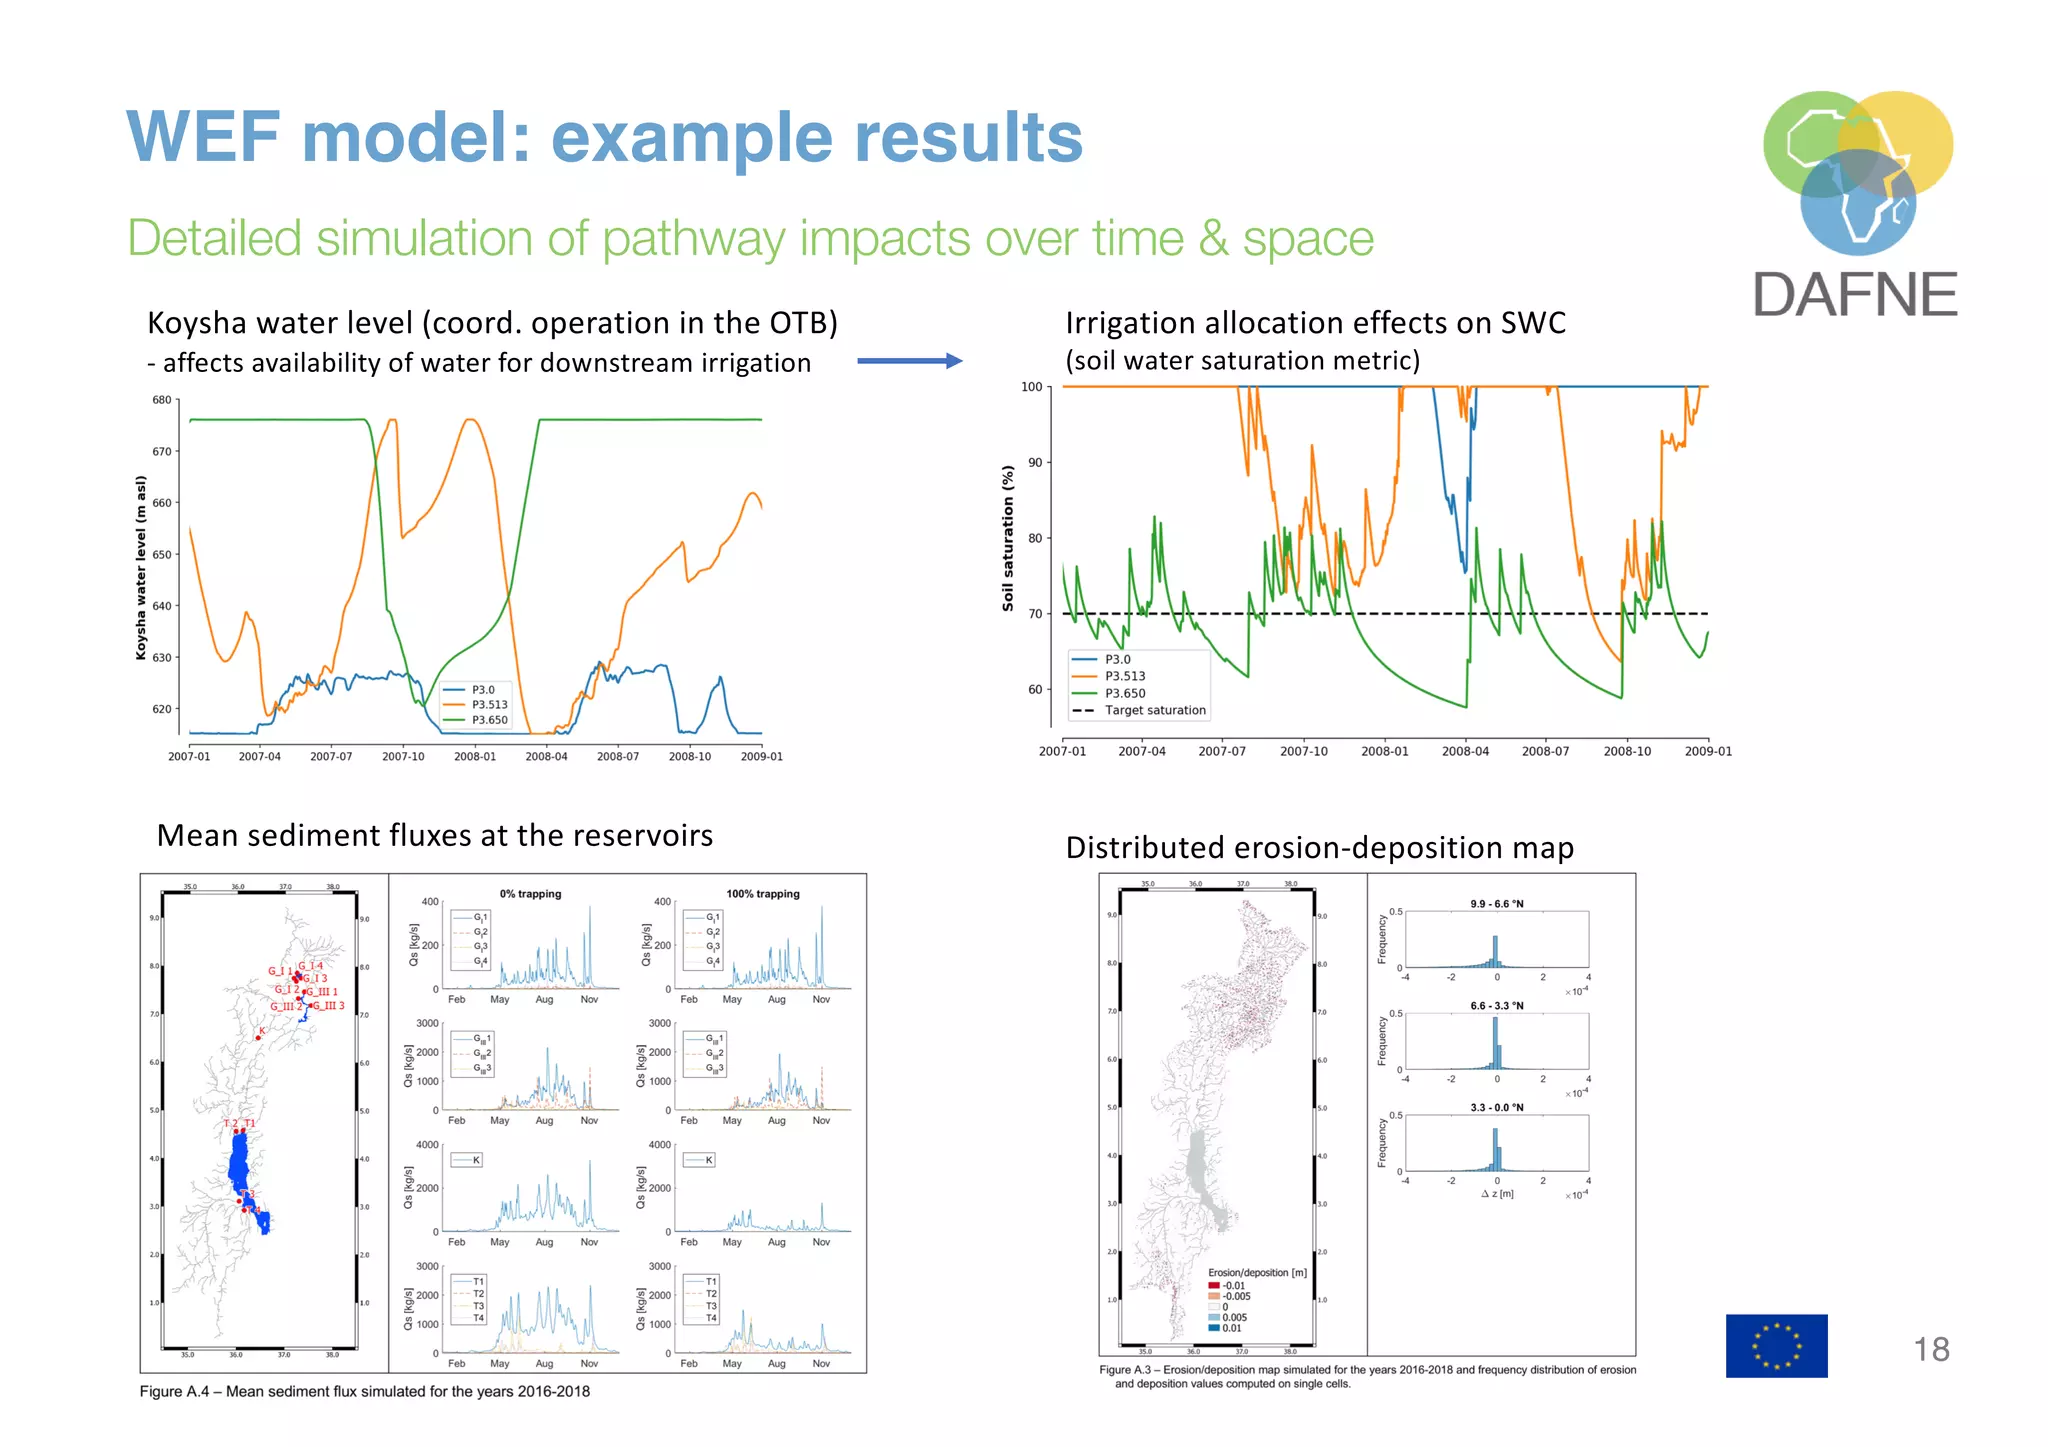
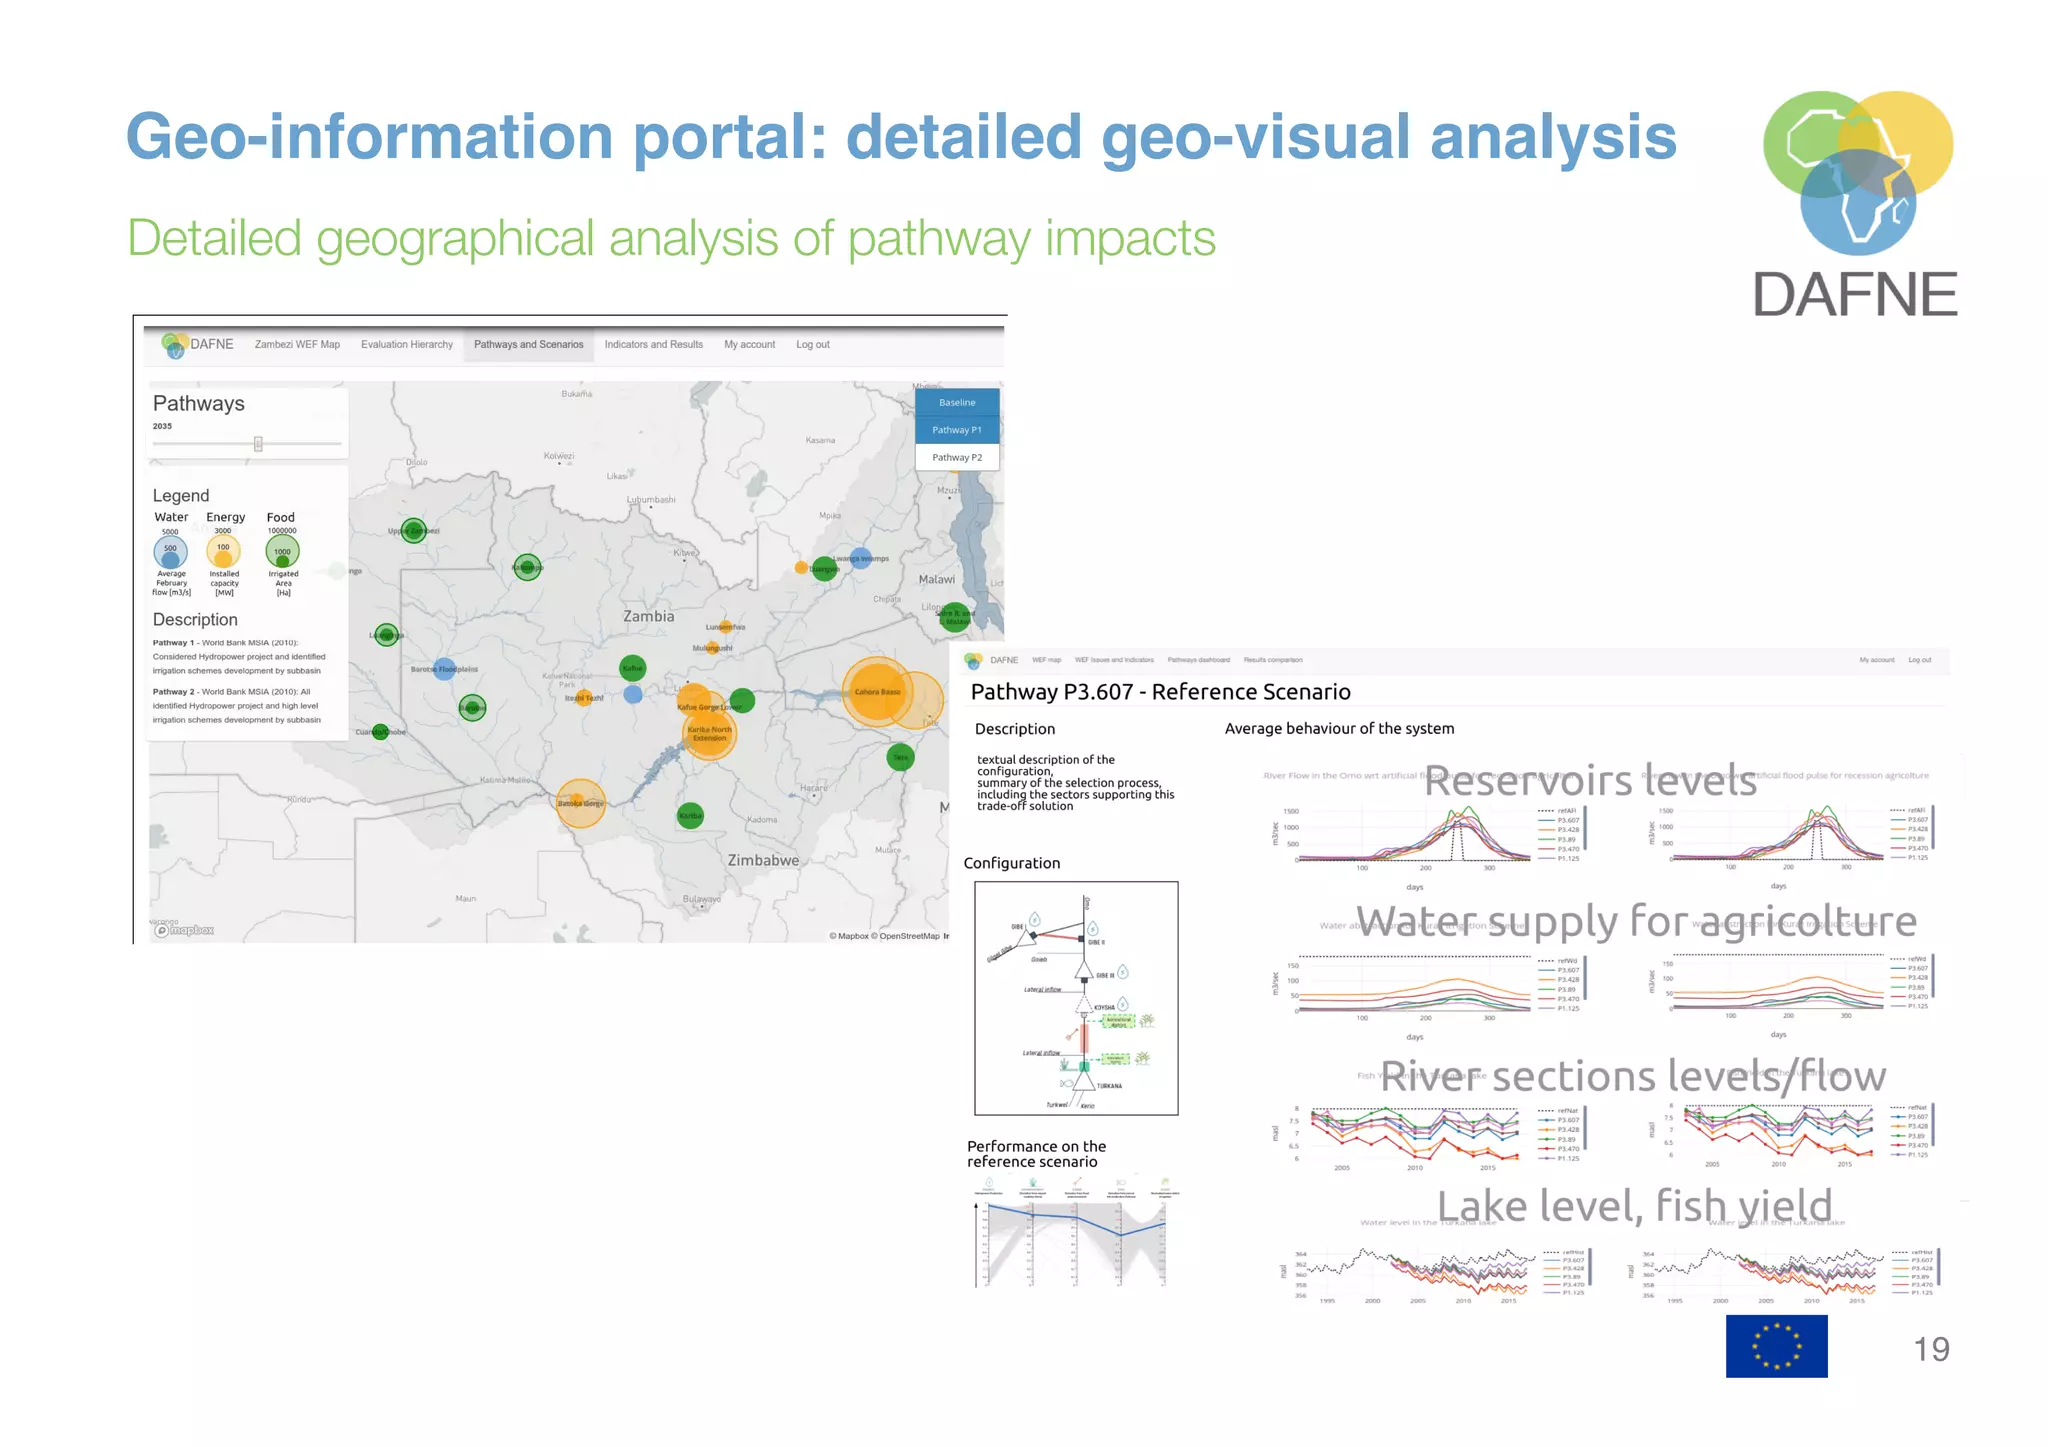
The DAFNE project develops decision-analytic frameworks and visualization tools to analyze the complex water-energy-food nexus in transboundary contexts in fast-growing countries. The project focuses on the Omo-Turkana basin in Ethiopia and the Zambezi basin in Zambia. The frameworks include models to analyze impacts of policies under different future scenarios, identify trade-offs between sectors, and facilitate stakeholder negotiations. Multi-perspective visualization tools allow analyzing results and exploring different perspectives. The tools aim to support sustainable policymaking through comparative analysis and understanding different stakeholder needs.


