SlideShare a Scribd company logo
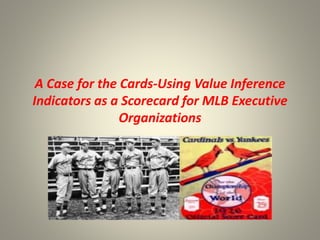
A Case for the Cards-Using Value Inference
Indicators as a Scorecard for MLB Executive
Organizations
DISCLAIMER
All rights reserved. No part of this work covered by the copyrights herein may be reproduced or copied in any form or by
any means—graphically, electronically, or mechanically, including photocopying, audio/video recording, or information
storage and retrieval of any kind—without the express written permission of the CTI, NACVA ,and the presenter.
The information contained in this presentation is only intended for general purposes.
It is designed to provide authoritative and accurate information about the subject covered. It is sold with the understanding
that the copyright holder is not engaged in rendering legal, accounting, or other professional service or advice. If legal or
other expert advice is required, the services of an appropriate professional person should be sought.
The material may not be applicable or suitable for the reader’s specific needs or circumstances. Readers/viewers may not
use this information as a substitute for consultation with qualified professionals in the subject matter presented here.
Although information contained in this publication has been carefully compiled from sources believed to be reliable, the
accuracy of the information is not guaranteed. It is neither intended nor should it be construed as either legal, accounting,
and/or tax advice, nor as an opinion provided by the Consultants’ Training Institute (CTI), National Association of Certified
Valuators and Analysts (NACVA), the Institute of Business Appraisers (IBA), the presenter, or the presenter’s firm.
The authors specifically disclaim any personal liability, loss, or risk incurred as a consequence of the use, either directly or
indirectly, of any information or advice given in these materials. The instructor’s opinion may not reflect those of the CTI,
NACVA, its policies, other instructors, or materials.
Each occurrence and the facts of each occurrence are different. Changes in facts and/or policy terms may result in
conclusions different than those stated herein. It is not intended to reflect the opinions or positions of the authors and
instructors in relation to any specific case, but rather to be illustrative for educational purposes. The user is cautioned that
this course is not all inclusive.
© 2015—1997 NACVA • 5217 South State Street, Suite 400 • Salt Lake City, UT, 84107—ALL RIGHTS RESERVED.
The Consultants' Training Institute (CTI) is registered with the National Association of State Boards of Accountancy (NASBA) as a sponsor of continuing professional education on the
National Registry of CPE Sponsors. State boards of accountancy have final authority on the acceptance of individual courses for CPE credit. Complaints regarding registered sponsors may
be submitted through its web site: learningmarket.org.
2
The Presentation will include periodic online Polling
Questions/Codes to assess continuous participation and to
determine the program’s effectiveness.
You MUST respond to all polling questions (live) or complete a
quiz (recorded) in order to receive CPE credit.
If you view the webinar with a Smartphone or Tablet you may
NOT be able to answer polling questions that are required
for obtaining CPE credit.
If you are viewing this presentation as a recorded webinar it
will not qualify for NASBA QAS CPE credit. You can
however, obtain CPE credit per the instructions included
with your recorded webinar purchase.
How to obtain CPE credit for this webinar:
© 2015 National Association of Certified Valuators and
Analysts
3
IronHorse is a K.C. based special situation professional
services firm with practice specialties in business
valuation & appraisal, forensic services & litigation
support, CFO services, due diligence, and complex
financial & operations restructuring/turnaround
consulting.
Tony is an Adjunct Professor of Accounting at Johnson
Community College in Overland Park, KS and Rockhurst
University in K.C. and serves on the Small Business
Reorganization Committee as well as the Fraud Task
Force with the American Institute of Bankruptcy.
IronHorse has performed numerous valuation
engagements for clients in a variety of industries. In
particular as part of lender credit file reviews & field
exams, high-net worth business owner family law cases,
and as litigation consultants and expert witnesses in a
number of civil cases. Tony has extensive M & A
experience on dozens of transactions, especially with
financially distressed enterprises.
Tony Wayne, CVA, CPA, CIRA, CFF,
FCPA
President
IronHorse LLC
www.ihorsellc.com
twayne@ihorsellc.com
(913) 851-0027
SUBJECT INTEREST DEFINITION
• Defining the subject entity to be valued is crucial to the process of
developing a formal opinion/conclusion of value for an enterprise, as
well as in special-purpose engagements to calculate a range of value
estimation.
• Nowhere is this more dynamic and challenging than with major
league baseball franchises and their closely related business
operations.
• Over the past 18 years, Forbes has undertaken the effort to attempt to
estimate the enterprise asset values of the MLB franchises.
• The “what business are we in” question is fascinating to ponder and
essential to explore in understanding how to evaluate the relative
worth of the 30 MLB franchises. In this paper, we take on this labor of
love while critically examining the foundational assumptions of the
Forbes Business of Baseball Articles published March 26, 2014.
A CASE FOR THE CARDS
• We feel compelled to take up the mantle and champion the cause of
our Missouri friends to the east.
• To build a case for the Cards as the top managed organization in
professional sports and a virtual steal of a bargain at $ 805-830
million as purported to be worth by our friends at Bloomberg and
Forbes.
THE PROCESS
• Developed a comprehensive scorecard of various data, analytics,
business performance indicators, fan demand metrics and financial
information
• Analyzed:
• Relative ticket prices
• Attendance vs. attendance potential
• Relative market population
• Number of television households per Nielsen
• 2011-2013 TV ratings summaries by market (where available
• Annual television rights earnings
• Forbes vs. Bloomberg estimations for enterprise value
GOALS OF THE PROCESS
• Assess if Forbes’ value inference estimations made sense and
appeared consistent in assumption across the 30 teams.
• Consider whether their estimations inferred questions as it pertains to
executive organization performance.
QUESTIONS WE EXPLORED
• Bellwether and a beacon of light into the future or albatross/outlier-
Are the Dodgers really worth in excess of $ 2 billion and will Time-
Warner Cable (TWC) truly pay-off on their guaranteed billions while
providing a rising tide that lifts all boats?
• Peeking into the future, what is the future of live broadcast baseball
and how will the middle and small market teams survive if the
Dodgers deal is indeed an outlier?
• How will a dramatically aging traditional core fan-base, coupled with a
younger demographic turning to more active, engaging and involved
forms of entertainment enable all 30 teams to survive? A youthful
group raised on soccer, video games, and an inter-active, socially
mobile and engaged lifestyle that is their new normal vis a vis those of
us who grew up dreaming to be the next Mickey, Willie or Yaz.
LABOR OF LOVE
LABOR OF LOVE
MAJESTIC OLD SAINT LOUIS
• European exploration of the area was actually recorded as far back as
1673.
• French explorers Louis Jolliet and Jacques Marquette traveled through
the Mississippi River valley
• Five years later, La Salle claimed the region for France as part of La
Louisiane. St. Louis was transferred to the Republic of France in 1800,
and then sold to the United States in 1803 as part of the Louisiana
Purchase.
MAJESTIC OLD SAINT LOUIS
• And sometime very shortly thereafter, Harry Caray stepped up, grabbed
the mic, popped the top on an ice cold Bud and the Cardinals radio
network became the envy of all of professional sports with an astounding
reach east, west as well as south from St. Louis.
MAJESTIC OLD SAINT LOUIS
MLB VALUE SCORECARD
PRIMARY ELEMENTS:
• Forbes value inference estimates for “sport,” “stadium,” “market,” and “brand”
values.
• 2013 average ticket prices.
• 2013 attendance vs attendance “potential” based on seating capacities.
• Annual ticket revenues.
• Where available, 2013 and 2012 Nielsen local market television ratings, and
number of “TV households” per Nielsen.
• Metro area population figures.
• 2013 “sport” revenue as reported by Forbes along with operating profit.
• Bloomberg reported estimated enterprise asset values as of October 2013.
• Annual television rights revenues, contract expiration dates and RSN equity
stakes.
• As of August 2013 NFL Forbes valuation estimates, debt to value ratios, sport
revenues and operating income data by team.
• 1995-2013 post season results.
MLB VALUE SCORECARD
Correlation of consistent on-field performance to enterprise value has been
muddied a great deal from the glory days of the 1950’s and 1960’s for baseball:
• Recent explosion in extraordinary cable deals
• RSN’s and especially the IRSN’s
• Substantial expansion
• Absence of revenue sharing arrangements, salary cap structures,
scheduling, the draft and other NFL business model attributes
MLB VALUE SCORECARD
• Disparity in revenue generating potential vis a vis large and small market clubs has
never been greater and potentially threatens the viability of the league going
forward as currently structured.
• On-field historical performance barometer:
• One point for a play-off appearance
• Two points for participating in the league championship series
• Three points for winning a league pennant
• Four points for winning the world series
MLB VALUE SCORECARD
• Historical, iconic brands such as the Yankees, Dodgers, Giants, Red Sox, Cubs and as
we suggest the Cards, aside, most remaining clubs continue to generate both in-
person and television interest throughout the season depending on their chances
for appearing in the post-season.
• We had the opportunity of speaking with Mike Ozanian, of Forbes who was closely
involved in the exercise to estimate enterprise valuations for the 30 MLB
organizations.
• Revolutionary and dramatic impact of the RSN’s, the IRSN’s, the equity stakes by
some teams in their networks, and in particular the explosive ripple felt throughout
MLB with the $ 2 billion Guggenheim Group Dodger acquisition and their TWC
television rights deal have substantially complicated the “algebra”.
THREAT THAT MAY CREATE 3-TIER POWER STRUCTURE
• Teams in middle and small market regions with smaller numbers of televisions and
leverage with the RSN’s themselves, and the absence of available capital given the
risk of “building” their own networks a la the Yankees.
SOMETHING DIDN’T SMELL QUITE RIGHT
• According to Forbes……………
• The Royals apparently had close to $ 100 million more in additional “sport” value
over and above the Cardinals.
• St. Louis was near the bottom of the list for this component value given their long
and consistent on-field and financial success over multiple decades.
• Their assertion that the Yankees brand value was in excess of 4 times greater the
brand value of the Cardinals even though St. Louis out drew them in attendance
while generating an average of close to 110,000 TV viewers vs the Yankees
viewership of around 195,000
SPORT FORBES RANK RANK RANK RANK FORBES $ (000)
REV REV SPORT MKT STADIUM BRAND TOT DEBT EQUITY
TEAM RANK MULT VALUE VALUE VALUE VALUE VALUE RATIO VALUE
1NY YANKEES 1 5.5 2 1 2 2 $2,535 1% $2,510
2LA DODGERS 4 6.9 1 2 1 3 $2,013 20% $1,610
3BOSTON 2 4.2 11 3 3 4 $1,508 0% $1,508
4CHICAGO CUBS 6 4.5 6 4 4 6 $1,205 35% $783
5SAN FRAN 3 3.2 24 5 5 5 $1,009 9% $918
6PHILLY 7 3.7 15 6 7 10 $979 10% $881
7TEXAS 9 3.2 23 8 8 8 $832 20% $666
8ST. LOUIS 5 2.9 27 10 6 7 $830 35% $540
9NY METS 13 3.4 22 9 12 9 $803 44% $450
10LA ANGELS 10 3.1 26 7 18 11 $776 4% $745
21ARIZONA 25 3.1 12 23 22 21 $586 25% $440
22COLORADO 22 2.9 14 21 21 24 $576 11% $513
23PITTSBURGH 20 2.8 7 26 23 22 $576 16% $484
24CLEVELAND 24 2.9 10 22 27 23 $571 15% $485
25MILWAUKEE 23 2.9 16 25 16 25 $567 9% $516
26HOUSTON 27 2.8 20 24 25 27 $530 49% $270
27OAKLAND 26 2.7 8 27 26 30 $496 13% $432
28ROYALS 29 2.8 3 28 30 28 $491 11% $437
29TAMPA BAY 28 2.7 5 30 29 29 $486 28% $350
30MIAMI 30 3.1 4 29 28 29 $486 44% $272
ANALYSIS COMMENTS
• Only the Dodgers drew more fans than St. Louis did in 2013; 3.7 million vs 3.4
million.
• St. Louis metro area population is 2.8 million in comparison to:
• N.Y.-20 million
• L.A.- 13 million
• Boston-4.6 million
• Chicago-9.5 million
• San Francisco- 4.5 million
• Philadelphia- 6.0 million
• Dallas-6.8 million
• Sport revenue for St. Louis was $ 283 million as compared to:
• N.Y.-$ 461 million
• Boston-$ 357 million
• San Francisco-$ 316 million
• L.A.-$ 293 million
ANALYSIS COMMENTS
• On the $ 283 million, the Cardinals made $ 65 million, vs:
• N.Y-$ 9 million loss
• L.A.-$ 81 million loss
• Philly-$ 21 million loss
• Texas-$ 4.9 million loss
• According to Forbes, the top seven teams alone account for 50% of the total
combined market equity value capitalization for all 30 teams combined. The
Yankees, Dodgers and Red Sox close to 1/3 of this aggregate total. If indeed this is
real, it seems the implications are profound.
ANALYSIS COMMENTS
• The inherent inequity and disproportionate economic leverage poses a potentially
serious if not devastating threat to the lower 1/3 of teams, in particular the small
market ones.
• Apparently and according to the Forbes sport values per team, operating profits
don’t matter.
• As a multiple of revenues, the sport values are all over the map and the extreme
variance and dispersion of these multiples/values calls into question the underlying
assumptions supporting them.
• Why would one pay a multiple of 1.4 times sport revenues for the Royals who lost
$ 7 million in 2013, but only .55 on the dollar for the Cardinals sport revenue stream
that generated $ 65 million in operating profits?
ANALYSIS COMMENTS
• The short answer is no one would and there is simply no way the Royals have close
to $ 100 million more in sport value than St. Louis does. It fails the sniff test and
reflects an apparent failure to sanity check the numbers amongst the teams.
• Moreover, the Dodgers apparently bled operating cash at a rather alarming rate and
the market rewards that performance with a sport value multiple in excess of two
times that of the Cardinals?
• Absent compelling evidence to the contrary, we would suggest the market doesn’t
value this stream at that rate and perhaps there is an effort at play to justify the
$ 2.0 billion price paid by their investors rather than call into question the possibility
that this deal might be an outlier, especially should the Dodgers continue to attract
no more than 150,000 viewers per televised game.
ANALYSIS COMMENTS
• The contrasts to the apparent enterprise valuations done by Forbes for the NFL are
striking:
• Median revenue sport value multiple for the NFL teams was 4.1 times revenue
with a high of 4.8 and a low of 3.2 or a range of 39% around the median.
• In contrast, the range around the median MLB sport value multiple was 111%
reflecting great and unexplained variation in the sports value estimations.
• Using the success metric we described above, since 1994 the Cardinals have scored
39 points exceeded only by New York (79 pts.) and Boston (49 pts.). In contrast:
• Dodgers-13
• Rangers-15
• Cubs-6
• Philly-17
• White Sox-12
• Royals-0
IT’S ALL ABOUT CABLE SUBSCRIBER COUNTS
• The value of the Dodger’s TWC “guarantee” notwithstanding, we are struck
by the Yankee Nielsen sharply downward trend line above in relationship to
the $ 1.3 billion market value estimation by Forbes which is almost 4 times
their estimate for St. Louis.
• A substantially greater market value makes sense, given the tremendous
disparity in population base.
• Yet, given this size of local market differential, the Cardinals drew more in
attendance than the Yankees did in 2013, and their local Nielsen ratings
were 3.4 times higher than the Yankees.
IT’S ALL ABOUT CABLE SUBSCRIBER COUNTS
• At some point and at some level, population size and TV counts have to
translate into revenues and cash-flow-either on an annual basis or in the
form of a terminal/exit payment.
• 2013 estimated average regular season local market tuned-in television sets:
Cardinals-110,000
Yankees-195,000
Boston-178,000
Dodgers-155,000
Cubs-60,000
Rangers-165,000
White Sox-69,000
Angels-86,000
IS THIS DODGER “GRADE INFLATION”??
• When we examine relative “stadium” value between the Dodgers and the
Cards, we see that Forbes valued L.A. ($ 490 million) some 2.3 times higher
than they did the Cardinals.
• This is with roughly only 10% greater attendance (+ 300k) and an average
ticket price that is some 50% lower than the Cardinals ticket price.
• Once again, this fails the sniff test.
• Moreover, when we consider the size and reach of the Cardinals’ popularity
across at least six states in addition to their local market, and the fact that
the Cardinal brand is one of the most iconic in sports history, this also calls
into question a purported Dodger brand value of $ 280 million, some 2.2
times higher than their Cardinal brand value estimate
Scorecard analysis Forbes valuation conclusions:
• Appears to us the Dodger enterprise value estimate may be more of an
exercise to rationalize, justify the $ 2 billion acquisition price than a thorough
analysis of the underlying component value drivers.
• When we bump the Cardinals against those teams above and selected teams
below them, given our scorecard analysis, we conclude the Cardinals are
substantially under-valued. In fact, we suggest their enterprise valuation
estimate should be closer to $ 1.2-$ 1.3 billion.
EXECUTIVE GRADE CARD
• We selected, then ranked the following executive performance attributes:
• Annual television revenue rights
• Average ticket prices
• Actual attendance as percentage of annual attendance potential
• Actual attendance as a percentage of primary local market population
base
• Sport revenue as measured by Forbes
• Operations profitability as reported by Forbes
• On-field success multiple as defined/discussed above
EXECUTIVE GRADE CARD
• We then weighted and compiled the various attribute rankings, weighting
television rights at .8, attendance potential at 1.2, and attendance as a
percentage of local base population at 1.4. All other attributes were
weighted at 1.0.
• To these weighted average attribute rankings we then penalized the top ten
population markets by .15, and added a .15 premium to the ten smallest
markets. Our rationale is based on the very clear advantage that mega
market teams have in sheer numbers and the ability to leverage them vis a
vis the smallest markets.
EXECUTIVE GRADE CARD
• Top five performing organizations:
• Cardinals
• Boston
• Giants
• Tigers
• Cubs
• Bottom five performing organizations:
• Astros
• Mets
• Diamondbacks
• Blue Jays
• Marlins
EXECUTIVE GRADE CARD
• Most under-valued organizations:
• Twins
• Padres
• Cardinals
• Tigers
• Pirates
• Most over-valued organizations:
• Braves
• Mariners
• White Sox
• Blue Jays
• Dodgers
EXECUTIVE GRADECARD
WGTS 0.8 1 1.2 1.4 1 1 1
RANK FORBES
TV TIC ATT ATT/ SPORT OC % REV SUCCESS WTD ADJ FOR AREA POP MGT EQUITY MGT-EQ
RIGHTS
PRICE POT POP REV % MED MULT TOT POP POP ADJ RANK RANK RANK
1ST. LOUIS
23
6 2 2 5 2 3 39.6 33.66 2,810,056 0.85 1 14 (13)
2BOSTON
8
1 3 14 2 11 2 45.6 45.6 4,684,299 1 2 3 (1)
3SAN FRAN
19
9 1 9 3 3 5 49 49 4,500,000 1 3 4 (1)
4DETROIT
14
14 4 10 8 14 9 75 75 4,294,983 1 4 17 (13)
5CHICAGO CUBS
10
3 10 13 6 9 24 80.2 80.2 4,292,000 1 5 6 (1)
6NY YANKEES
5
2 9 25 1 22
1
75.8 87.17
13,000,000
1.15 6 1 5
7MINNESOTA
21
8 12 11 14 7 21 96.6 96.6 3,459,146 1 7 26 (19)
8MILWAUKEE
26
17 13 1 23 13 26 116.8 99.28 1,569,659 0.85 8 15 (7)
9SAN DIEGO
9
30 21 12 19 4 17 119.2 101.32 3,211,252 0.85 9 25 (16)
10PHILLY
16
4 5 16 7 28 10 90.2 103.73 6,034,678 1.15 10 5 5
11PITTSBURGH
29
19 16 4 20 8 28 123 104.55 2,360,867 0.85 11 19 (8)
12CINCY
18
23 14 3 18 26 25 127.4 108.29 2,137,406 0.85 12 13 (1)
13COLORADO
24
28 15 5 22 12 22 128.2 108.97 2,697,476 0.85 13 16 (3)
14BALTIMORE
20
18 20 7 21 17 23 128.8 109.48 2,770,738 0.85 14 20 (6)
15CLEVELAND
13
26 29 8 24 19 6 131.4 111.69 2,064,725 0.85 15 18 (3)
16LA ANGELS
2
13 7 29 10 16 8 97.6 112.24 13,131,431 1.15 16 7 9
17TEXAS
3
20 8 20 9 21 12 102 117.3 6,810,913 1.15 17 11 6
18ATLANTA
30
27 19 21 11 5 4 123.2 123.2 5,522,942 1 18 8 10
19SEATTLE
4
12 30 17 16 15 19 125 125 3,610,105 1 19 9 10
20WASHINGTON
22
5 11 22 12 10 27 115.6 132.94 5,949,859 1.15 20 27 (7)
21CHICAGO WHITE SOX
11
15 26 18 17 20 16 133.2 133.2 3,624,000 1 21 10 11
22LA DODGERS
1
21 6 30 4 30 13 118 135.7 17,000,000 1.15 22 2 20
23TAMPA BAY
27
24 24 15 30 29 7 161.4 137.19 2,870,569 0.85 23 28 (5)
24OAKLAND
12
22 17 24 26 6 20 137.6 137.6 4,500,000 1 24 24 0
25ROYALS
25
25 23 6 29 24 30 164 139.4 2,054,473 0.85 25 23 2
26HOUSTON
6
10 28 28 27 1 14 129.6 149.04 6,313,158 1.15 26 30 (4)
27NY METS
7
16 22 27 13 18 15 131.8 151.57 8,000,000 1.15 27 21 6
28ARIZONA
17
29 25 19 25 23 11 158.2 158.2 4,398,762 1 28 22 6
29TORONTO
15
7 18 23 15 27 29 143.8 165.37 6,054,000 1.15 29 12 17
30MIAMI
28
11 27 26 28 25 18 173.2 199.18 5,828,191 1.15 30 29 1
A GLIMPSE TO THE FUTURE-UNBUNDLING THE BUNDLES?
• Absent bundled programming to absorb and disperse these fees across non-sports
programing, an a la carte, cafeteria programming and pricing structure would be
cost-prohibitive and likely accelerate the steady decline in local MLB viewership
trends.
• Oddly and likely to continue in the immediate-term, ESPN and others have been able
to experience strong revenue growth from declining MLB local tv ratings, and sharply
declining ratings on national MLB programming.
• Across all national stations that broadcast MLB, ratings have been falling.
• This represents a counter-intuitive economic notion that depends on mandated
bundled programming products to cable consumers, who until very recently have
shown no signs of push-back.
• One must have cable to watch MLB locally, and one must buy bundled packages
through their cable operator to see the games.
A GLIMPSE TO THE FUTURE-UNBUNDLING THE BUNDLES?
• Ironically, several of the teams with the most current lucrative cable
deals (L.A. Angels, Astros, White Sox & A’s) are at the very bottom
in local ratings:
A GLIMPSE TO THE FUTURE-UNBUNDLING THE BUNDLES?
• According to ESPN's sports business reporter Darren Rovell, even
after factoring for inflation, baseball revenues are up 242% since
1990. In turn, player salaries have risen 194% in that time.
• Television is bringing riches to everyone involved with baseball.
Footing the bill are consumers who pay an unseen "baseball tax" in
their cable bill each month. Baseball has managed to pull off the
remarkable feat of decoupling revenue from popularity because it's
the single largest beneficiary of cable bundles.
• The bundle gives cable networks themselves a point of tremendous
leverage over cable operators.
• They can expand their revenues by creating lightly watched
channels that get very low affiliate fees, but are assured distribution
to millions of homes they can sell advertising spots to as well.
A GLIMPSE TO THE FUTURE-UNBUNDLING THE BUNDLES?
Stephen Dixon, A Channel Worth Changing? The Individual Regional
Sports Network: Proliferation, Profits, Parity, and the Potential
Administrative and Antitrust Issues That Could Follow (Journal of The
National Association of Administrative Law Judiciary, Pepperdine
University School of Law, 11/6/2013):
• “…………More likely than not, baseball will not face any sort of
adjustments to its financial structure or to its revenue generating
and revenue sharing mechanisms. Whether baseball needs to be
saved from itself is a debate that people will be having more and
more frequently in the coming decades. Many people will look back
on the sale of the Dodgers, and Commissioner Selig’s role in it, and
simply admire it for being a decision made by a commissioner who
loved baseball and who wanted to save one of its most storied
franchises from falling into further disrepair-and they would not be
crazy for feeling that way. But some people will look back at the
mad dash for television money that followed and see something
more. After all, there are only so many elite baseball players to go
around…………..”
Rank 2014 RANK Team % MKT CAP VALUE % CHANGE 14 VAL REV MULT
1 1 New York Yankees 9% $3,200
28% $2,500 6.3
2 2 Los Angeles Dodgers 7% $2,400
20% $2,000 6.0
3 3 Boston Red Sox 6% $2,100
40% $1,500 5.7
4 5 San Francisco Giants 6% $2,000
100% $1,000 5.2
5 4 Chicago Cubs 5% $1,800 50% $1,200 6.0
6 8 St Louis Cardinals 4% $1,400
71% $819 4.8
7 9 New York Mets 4% $1,350
69% $799 5.1
8 10
Los Angeles Angels of
Anaheim
4% $1,300
68% $774 4.3
9 13 Washington Nationals 4% $1,280
83% $699 4.5
10 6 Philadelphia Phillies 3% $1,250
28% $977 4.7
11 7 Texas Rangers 3% $1,220
48% $824 4.6
12 11 Atlanta Braves 3% $1,150 58% $728 4.3
13 15 Detroit Tigers 3% $1,125
65% $682 4.4
14 12 Seattle Mariners 3% $1,100
55% $710 4.4
15 16 Baltimore Orioles 3% $1,000
61% $621 4.1

More Related Content

Similar to A Case for the Cards-Using Value Inference Indicators-NACVA VERSION

FactorTrust NABD Orlando2016
FactorTrust NABD Orlando2016FactorTrust NABD Orlando2016
FactorTrust NABD Orlando2016Scott Brackin
 
Raymond James 35th Annual Institutional Investors Conference
Raymond James 35th Annual Institutional Investors ConferenceRaymond James 35th Annual Institutional Investors Conference
Raymond James 35th Annual Institutional Investors Conference
investorswci
 
Raymond James 35th Annual Institutional Investors Conference
Raymond James 35th Annual Institutional Investors ConferenceRaymond James 35th Annual Institutional Investors Conference
Raymond James 35th Annual Institutional Investors Conference
investorswci
 
Ameriholdings LakePoint Brochure FINAL 3.2.15 hi-res READER
Ameriholdings LakePoint Brochure FINAL 3.2.15 hi-res READERAmeriholdings LakePoint Brochure FINAL 3.2.15 hi-res READER
Ameriholdings LakePoint Brochure FINAL 3.2.15 hi-res READERMichael Woyan
 
Every Door Direct Mail Presentation
Every Door Direct Mail Presentation Every Door Direct Mail Presentation
T Wayne Valuing a Dream Working File
T Wayne Valuing a Dream Working FileT Wayne Valuing a Dream Working File
T Wayne Valuing a Dream Working FileTony Wayne
 
Dollar General in Mechanicsville, VA
Dollar General in Mechanicsville, VADollar General in Mechanicsville, VA
Dollar General in Mechanicsville, VA
Kevin Boeve
 
anéa-asna-newsletter-summer-2015-(compressed)16c586300f9d6b7db06cff000005a1a8
anéa-asna-newsletter-summer-2015-(compressed)16c586300f9d6b7db06cff000005a1a8anéa-asna-newsletter-summer-2015-(compressed)16c586300f9d6b7db06cff000005a1a8
anéa-asna-newsletter-summer-2015-(compressed)16c586300f9d6b7db06cff000005a1a8Karchie Trinh
 
Mastering Multi-Touchpoint Content Strategy: Navigate Fragmented User Journeys
Mastering Multi-Touchpoint Content Strategy: Navigate Fragmented User JourneysMastering Multi-Touchpoint Content Strategy: Navigate Fragmented User Journeys
Mastering Multi-Touchpoint Content Strategy: Navigate Fragmented User Journeys
Search Engine Journal
 
Entrepreneurial Opportunities for Military Families
Entrepreneurial Opportunities for Military FamiliesEntrepreneurial Opportunities for Military Families
Entrepreneurial Opportunities for Military Families
milfamln
 
Managing Your Charity Watchdog Profile To Increase Giving
Managing Your Charity Watchdog Profile To Increase GivingManaging Your Charity Watchdog Profile To Increase Giving
Managing Your Charity Watchdog Profile To Increase Giving
Bloomerang
 
ROUNDTABLE 2016: DIETZ
ROUNDTABLE 2016: DIETZROUNDTABLE 2016: DIETZ
Professional Diversity Network, Inc. (NASDAQ:IPDN)
Professional Diversity Network, Inc. (NASDAQ:IPDN)Professional Diversity Network, Inc. (NASDAQ:IPDN)
Professional Diversity Network, Inc. (NASDAQ:IPDN)
RedChip Companies, Inc.
 
PROFESSIONAL DIVERSITY NETWORK
PROFESSIONAL DIVERSITY NETWORKPROFESSIONAL DIVERSITY NETWORK
PROFESSIONAL DIVERSITY NETWORK
RedChip Companies, Inc.
 
ComCap Shoptalk 2016 Presentation
ComCap Shoptalk 2016 PresentationComCap Shoptalk 2016 Presentation
ComCap Shoptalk 2016 Presentation
Uren Dhanani
 
Investment Bank Overview from OpenView
Investment Bank Overview from OpenViewInvestment Bank Overview from OpenView
Investment Bank Overview from OpenView
OpenView
 
Wellbeing Tips Activities For Children - Twinkl
Wellbeing Tips  Activities For Children - TwinklWellbeing Tips  Activities For Children - Twinkl
Wellbeing Tips Activities For Children - Twinkl
Nicole Kathol
 

Similar to A Case for the Cards-Using Value Inference Indicators-NACVA VERSION (20)

FactorTrust NABD Orlando2016
FactorTrust NABD Orlando2016FactorTrust NABD Orlando2016
FactorTrust NABD Orlando2016
 
Raymond James 35th Annual Institutional Investors Conference
Raymond James 35th Annual Institutional Investors ConferenceRaymond James 35th Annual Institutional Investors Conference
Raymond James 35th Annual Institutional Investors Conference
 
Raymond James 35th Annual Institutional Investors Conference
Raymond James 35th Annual Institutional Investors ConferenceRaymond James 35th Annual Institutional Investors Conference
Raymond James 35th Annual Institutional Investors Conference
 
Ameriholdings LakePoint Brochure FINAL 3.2.15 hi-res READER
Ameriholdings LakePoint Brochure FINAL 3.2.15 hi-res READERAmeriholdings LakePoint Brochure FINAL 3.2.15 hi-res READER
Ameriholdings LakePoint Brochure FINAL 3.2.15 hi-res READER
 
Every Door Direct Mail Presentation
Every Door Direct Mail Presentation Every Door Direct Mail Presentation
Every Door Direct Mail Presentation
 
T Wayne Valuing a Dream Working File
T Wayne Valuing a Dream Working FileT Wayne Valuing a Dream Working File
T Wayne Valuing a Dream Working File
 
Dollar General in Mechanicsville, VA
Dollar General in Mechanicsville, VADollar General in Mechanicsville, VA
Dollar General in Mechanicsville, VA
 
anéa-asna-newsletter-summer-2015-(compressed)16c586300f9d6b7db06cff000005a1a8
anéa-asna-newsletter-summer-2015-(compressed)16c586300f9d6b7db06cff000005a1a8anéa-asna-newsletter-summer-2015-(compressed)16c586300f9d6b7db06cff000005a1a8
anéa-asna-newsletter-summer-2015-(compressed)16c586300f9d6b7db06cff000005a1a8
 
Mastering Multi-Touchpoint Content Strategy: Navigate Fragmented User Journeys
Mastering Multi-Touchpoint Content Strategy: Navigate Fragmented User JourneysMastering Multi-Touchpoint Content Strategy: Navigate Fragmented User Journeys
Mastering Multi-Touchpoint Content Strategy: Navigate Fragmented User Journeys
 
Entrepreneurial Opportunities for Military Families
Entrepreneurial Opportunities for Military FamiliesEntrepreneurial Opportunities for Military Families
Entrepreneurial Opportunities for Military Families
 
Cmg Ohio Presentation
Cmg Ohio PresentationCmg Ohio Presentation
Cmg Ohio Presentation
 
Cmg Ohio Presentation
Cmg Ohio PresentationCmg Ohio Presentation
Cmg Ohio Presentation
 
Managing Your Charity Watchdog Profile To Increase Giving
Managing Your Charity Watchdog Profile To Increase GivingManaging Your Charity Watchdog Profile To Increase Giving
Managing Your Charity Watchdog Profile To Increase Giving
 
ROUNDTABLE 2016: DIETZ
ROUNDTABLE 2016: DIETZROUNDTABLE 2016: DIETZ
ROUNDTABLE 2016: DIETZ
 
Professional Diversity Network, Inc. (NASDAQ:IPDN)
Professional Diversity Network, Inc. (NASDAQ:IPDN)Professional Diversity Network, Inc. (NASDAQ:IPDN)
Professional Diversity Network, Inc. (NASDAQ:IPDN)
 
PROFESSIONAL DIVERSITY NETWORK
PROFESSIONAL DIVERSITY NETWORKPROFESSIONAL DIVERSITY NETWORK
PROFESSIONAL DIVERSITY NETWORK
 
ComCap Shoptalk 2016 Presentation
ComCap Shoptalk 2016 PresentationComCap Shoptalk 2016 Presentation
ComCap Shoptalk 2016 Presentation
 
FINAL PAPER THBC
FINAL PAPER THBCFINAL PAPER THBC
FINAL PAPER THBC
 
Investment Bank Overview from OpenView
Investment Bank Overview from OpenViewInvestment Bank Overview from OpenView
Investment Bank Overview from OpenView
 
Wellbeing Tips Activities For Children - Twinkl
Wellbeing Tips  Activities For Children - TwinklWellbeing Tips  Activities For Children - Twinkl
Wellbeing Tips Activities For Children - Twinkl
 

More from Tony Wayne

Acquisition International August 2013 41
Acquisition International August 2013 41Acquisition International August 2013 41
Acquisition International August 2013 41Tony Wayne
 
Turnaround CASE STUDY
Turnaround CASE STUDYTurnaround CASE STUDY
Turnaround CASE STUDYTony Wayne
 
2014.07 ABI Article
2014.07 ABI Article2014.07 ABI Article
2014.07 ABI ArticleTony Wayne
 
IronHorseJCCC-Account-Ability
IronHorseJCCC-Account-AbilityIronHorseJCCC-Account-Ability
IronHorseJCCC-Account-AbilityTony Wayne
 
ACG_09_Advertorial
ACG_09_AdvertorialACG_09_Advertorial
ACG_09_AdvertorialTony Wayne
 
Presentation CM-B.E.-CVPA
Presentation CM-B.E.-CVPAPresentation CM-B.E.-CVPA
Presentation CM-B.E.-CVPATony Wayne
 
IronHorse LLC Assessments-CFO Outsourcing
IronHorse LLC Assessments-CFO OutsourcingIronHorse LLC Assessments-CFO Outsourcing
IronHorse LLC Assessments-CFO OutsourcingTony Wayne
 
TRIAGE CHECKLIST
TRIAGE CHECKLISTTRIAGE CHECKLIST
TRIAGE CHECKLISTTony Wayne
 
IronHorse Business valuation presentation
IronHorse Business valuation presentationIronHorse Business valuation presentation
IronHorse Business valuation presentationTony Wayne
 
T Wayne-IronHorse CV for Liquidations Wind-downs receiverships
T Wayne-IronHorse CV for Liquidations Wind-downs receivershipsT Wayne-IronHorse CV for Liquidations Wind-downs receiverships
T Wayne-IronHorse CV for Liquidations Wind-downs receivershipsTony Wayne
 
CV Tony Wayne-Business Valuation-Expert Witness & Lit Support
CV Tony Wayne-Business Valuation-Expert Witness & Lit SupportCV Tony Wayne-Business Valuation-Expert Witness & Lit Support
CV Tony Wayne-Business Valuation-Expert Witness & Lit SupportTony Wayne
 
2014 Sept-Oct Value Examiner Article-Case for the Cards
2014 Sept-Oct Value Examiner Article-Case for the Cards2014 Sept-Oct Value Examiner Article-Case for the Cards
2014 Sept-Oct Value Examiner Article-Case for the CardsTony Wayne
 
CJ On-line article
CJ On-line articleCJ On-line article
CJ On-line articleTony Wayne
 
2005.12.18 KCBJ re Kert Rabe
2005.12.18 KCBJ re Kert Rabe2005.12.18 KCBJ re Kert Rabe
2005.12.18 KCBJ re Kert RabeTony Wayne
 
Debt & Equity-Financing The Deal Considerations & Trends
Debt & Equity-Financing The Deal Considerations & TrendsDebt & Equity-Financing The Deal Considerations & Trends
Debt & Equity-Financing The Deal Considerations & TrendsTony Wayne
 
Due Diligence-Financial & Operations Risk Analysis & Assessment
Due Diligence-Financial & Operations Risk Analysis & AssessmentDue Diligence-Financial & Operations Risk Analysis & Assessment
Due Diligence-Financial & Operations Risk Analysis & AssessmentTony Wayne
 
Top M & A mistakes
Top M & A mistakesTop M & A mistakes
Top M & A mistakesTony Wayne
 
2013.03.01 JCCC Educator Conference-Tony Wayne Presentation
2013.03.01 JCCC Educator Conference-Tony Wayne Presentation2013.03.01 JCCC Educator Conference-Tony Wayne Presentation
2013.03.01 JCCC Educator Conference-Tony Wayne PresentationTony Wayne
 

More from Tony Wayne (18)

Acquisition International August 2013 41
Acquisition International August 2013 41Acquisition International August 2013 41
Acquisition International August 2013 41
 
Turnaround CASE STUDY
Turnaround CASE STUDYTurnaround CASE STUDY
Turnaround CASE STUDY
 
2014.07 ABI Article
2014.07 ABI Article2014.07 ABI Article
2014.07 ABI Article
 
IronHorseJCCC-Account-Ability
IronHorseJCCC-Account-AbilityIronHorseJCCC-Account-Ability
IronHorseJCCC-Account-Ability
 
ACG_09_Advertorial
ACG_09_AdvertorialACG_09_Advertorial
ACG_09_Advertorial
 
Presentation CM-B.E.-CVPA
Presentation CM-B.E.-CVPAPresentation CM-B.E.-CVPA
Presentation CM-B.E.-CVPA
 
IronHorse LLC Assessments-CFO Outsourcing
IronHorse LLC Assessments-CFO OutsourcingIronHorse LLC Assessments-CFO Outsourcing
IronHorse LLC Assessments-CFO Outsourcing
 
TRIAGE CHECKLIST
TRIAGE CHECKLISTTRIAGE CHECKLIST
TRIAGE CHECKLIST
 
IronHorse Business valuation presentation
IronHorse Business valuation presentationIronHorse Business valuation presentation
IronHorse Business valuation presentation
 
T Wayne-IronHorse CV for Liquidations Wind-downs receiverships
T Wayne-IronHorse CV for Liquidations Wind-downs receivershipsT Wayne-IronHorse CV for Liquidations Wind-downs receiverships
T Wayne-IronHorse CV for Liquidations Wind-downs receiverships
 
CV Tony Wayne-Business Valuation-Expert Witness & Lit Support
CV Tony Wayne-Business Valuation-Expert Witness & Lit SupportCV Tony Wayne-Business Valuation-Expert Witness & Lit Support
CV Tony Wayne-Business Valuation-Expert Witness & Lit Support
 
2014 Sept-Oct Value Examiner Article-Case for the Cards
2014 Sept-Oct Value Examiner Article-Case for the Cards2014 Sept-Oct Value Examiner Article-Case for the Cards
2014 Sept-Oct Value Examiner Article-Case for the Cards
 
CJ On-line article
CJ On-line articleCJ On-line article
CJ On-line article
 
2005.12.18 KCBJ re Kert Rabe
2005.12.18 KCBJ re Kert Rabe2005.12.18 KCBJ re Kert Rabe
2005.12.18 KCBJ re Kert Rabe
 
Debt & Equity-Financing The Deal Considerations & Trends
Debt & Equity-Financing The Deal Considerations & TrendsDebt & Equity-Financing The Deal Considerations & Trends
Debt & Equity-Financing The Deal Considerations & Trends
 
Due Diligence-Financial & Operations Risk Analysis & Assessment
Due Diligence-Financial & Operations Risk Analysis & AssessmentDue Diligence-Financial & Operations Risk Analysis & Assessment
Due Diligence-Financial & Operations Risk Analysis & Assessment
 
Top M & A mistakes
Top M & A mistakesTop M & A mistakes
Top M & A mistakes
 
2013.03.01 JCCC Educator Conference-Tony Wayne Presentation
2013.03.01 JCCC Educator Conference-Tony Wayne Presentation2013.03.01 JCCC Educator Conference-Tony Wayne Presentation
2013.03.01 JCCC Educator Conference-Tony Wayne Presentation
 

A Case for the Cards-Using Value Inference Indicators-NACVA VERSION

  • 1. A Case for the Cards-Using Value Inference Indicators as a Scorecard for MLB Executive Organizations
  • 2. DISCLAIMER All rights reserved. No part of this work covered by the copyrights herein may be reproduced or copied in any form or by any means—graphically, electronically, or mechanically, including photocopying, audio/video recording, or information storage and retrieval of any kind—without the express written permission of the CTI, NACVA ,and the presenter. The information contained in this presentation is only intended for general purposes. It is designed to provide authoritative and accurate information about the subject covered. It is sold with the understanding that the copyright holder is not engaged in rendering legal, accounting, or other professional service or advice. If legal or other expert advice is required, the services of an appropriate professional person should be sought. The material may not be applicable or suitable for the reader’s specific needs or circumstances. Readers/viewers may not use this information as a substitute for consultation with qualified professionals in the subject matter presented here. Although information contained in this publication has been carefully compiled from sources believed to be reliable, the accuracy of the information is not guaranteed. It is neither intended nor should it be construed as either legal, accounting, and/or tax advice, nor as an opinion provided by the Consultants’ Training Institute (CTI), National Association of Certified Valuators and Analysts (NACVA), the Institute of Business Appraisers (IBA), the presenter, or the presenter’s firm. The authors specifically disclaim any personal liability, loss, or risk incurred as a consequence of the use, either directly or indirectly, of any information or advice given in these materials. The instructor’s opinion may not reflect those of the CTI, NACVA, its policies, other instructors, or materials. Each occurrence and the facts of each occurrence are different. Changes in facts and/or policy terms may result in conclusions different than those stated herein. It is not intended to reflect the opinions or positions of the authors and instructors in relation to any specific case, but rather to be illustrative for educational purposes. The user is cautioned that this course is not all inclusive. © 2015—1997 NACVA • 5217 South State Street, Suite 400 • Salt Lake City, UT, 84107—ALL RIGHTS RESERVED. The Consultants' Training Institute (CTI) is registered with the National Association of State Boards of Accountancy (NASBA) as a sponsor of continuing professional education on the National Registry of CPE Sponsors. State boards of accountancy have final authority on the acceptance of individual courses for CPE credit. Complaints regarding registered sponsors may be submitted through its web site: learningmarket.org. 2
  • 3. The Presentation will include periodic online Polling Questions/Codes to assess continuous participation and to determine the program’s effectiveness. You MUST respond to all polling questions (live) or complete a quiz (recorded) in order to receive CPE credit. If you view the webinar with a Smartphone or Tablet you may NOT be able to answer polling questions that are required for obtaining CPE credit. If you are viewing this presentation as a recorded webinar it will not qualify for NASBA QAS CPE credit. You can however, obtain CPE credit per the instructions included with your recorded webinar purchase. How to obtain CPE credit for this webinar: © 2015 National Association of Certified Valuators and Analysts 3
  • 4. IronHorse is a K.C. based special situation professional services firm with practice specialties in business valuation & appraisal, forensic services & litigation support, CFO services, due diligence, and complex financial & operations restructuring/turnaround consulting. Tony is an Adjunct Professor of Accounting at Johnson Community College in Overland Park, KS and Rockhurst University in K.C. and serves on the Small Business Reorganization Committee as well as the Fraud Task Force with the American Institute of Bankruptcy. IronHorse has performed numerous valuation engagements for clients in a variety of industries. In particular as part of lender credit file reviews & field exams, high-net worth business owner family law cases, and as litigation consultants and expert witnesses in a number of civil cases. Tony has extensive M & A experience on dozens of transactions, especially with financially distressed enterprises. Tony Wayne, CVA, CPA, CIRA, CFF, FCPA President IronHorse LLC www.ihorsellc.com twayne@ihorsellc.com (913) 851-0027
  • 5. SUBJECT INTEREST DEFINITION • Defining the subject entity to be valued is crucial to the process of developing a formal opinion/conclusion of value for an enterprise, as well as in special-purpose engagements to calculate a range of value estimation. • Nowhere is this more dynamic and challenging than with major league baseball franchises and their closely related business operations. • Over the past 18 years, Forbes has undertaken the effort to attempt to estimate the enterprise asset values of the MLB franchises. • The “what business are we in” question is fascinating to ponder and essential to explore in understanding how to evaluate the relative worth of the 30 MLB franchises. In this paper, we take on this labor of love while critically examining the foundational assumptions of the Forbes Business of Baseball Articles published March 26, 2014.
  • 6. A CASE FOR THE CARDS • We feel compelled to take up the mantle and champion the cause of our Missouri friends to the east. • To build a case for the Cards as the top managed organization in professional sports and a virtual steal of a bargain at $ 805-830 million as purported to be worth by our friends at Bloomberg and Forbes.
  • 7. THE PROCESS • Developed a comprehensive scorecard of various data, analytics, business performance indicators, fan demand metrics and financial information • Analyzed: • Relative ticket prices • Attendance vs. attendance potential • Relative market population • Number of television households per Nielsen • 2011-2013 TV ratings summaries by market (where available • Annual television rights earnings • Forbes vs. Bloomberg estimations for enterprise value
  • 8. GOALS OF THE PROCESS • Assess if Forbes’ value inference estimations made sense and appeared consistent in assumption across the 30 teams. • Consider whether their estimations inferred questions as it pertains to executive organization performance.
  • 9. QUESTIONS WE EXPLORED • Bellwether and a beacon of light into the future or albatross/outlier- Are the Dodgers really worth in excess of $ 2 billion and will Time- Warner Cable (TWC) truly pay-off on their guaranteed billions while providing a rising tide that lifts all boats? • Peeking into the future, what is the future of live broadcast baseball and how will the middle and small market teams survive if the Dodgers deal is indeed an outlier? • How will a dramatically aging traditional core fan-base, coupled with a younger demographic turning to more active, engaging and involved forms of entertainment enable all 30 teams to survive? A youthful group raised on soccer, video games, and an inter-active, socially mobile and engaged lifestyle that is their new normal vis a vis those of us who grew up dreaming to be the next Mickey, Willie or Yaz.
  • 12. MAJESTIC OLD SAINT LOUIS • European exploration of the area was actually recorded as far back as 1673. • French explorers Louis Jolliet and Jacques Marquette traveled through the Mississippi River valley • Five years later, La Salle claimed the region for France as part of La Louisiane. St. Louis was transferred to the Republic of France in 1800, and then sold to the United States in 1803 as part of the Louisiana Purchase.
  • 13. MAJESTIC OLD SAINT LOUIS • And sometime very shortly thereafter, Harry Caray stepped up, grabbed the mic, popped the top on an ice cold Bud and the Cardinals radio network became the envy of all of professional sports with an astounding reach east, west as well as south from St. Louis.
  • 15. MLB VALUE SCORECARD PRIMARY ELEMENTS: • Forbes value inference estimates for “sport,” “stadium,” “market,” and “brand” values. • 2013 average ticket prices. • 2013 attendance vs attendance “potential” based on seating capacities. • Annual ticket revenues. • Where available, 2013 and 2012 Nielsen local market television ratings, and number of “TV households” per Nielsen. • Metro area population figures. • 2013 “sport” revenue as reported by Forbes along with operating profit. • Bloomberg reported estimated enterprise asset values as of October 2013. • Annual television rights revenues, contract expiration dates and RSN equity stakes. • As of August 2013 NFL Forbes valuation estimates, debt to value ratios, sport revenues and operating income data by team. • 1995-2013 post season results.
  • 16. MLB VALUE SCORECARD Correlation of consistent on-field performance to enterprise value has been muddied a great deal from the glory days of the 1950’s and 1960’s for baseball: • Recent explosion in extraordinary cable deals • RSN’s and especially the IRSN’s • Substantial expansion • Absence of revenue sharing arrangements, salary cap structures, scheduling, the draft and other NFL business model attributes
  • 17. MLB VALUE SCORECARD • Disparity in revenue generating potential vis a vis large and small market clubs has never been greater and potentially threatens the viability of the league going forward as currently structured. • On-field historical performance barometer: • One point for a play-off appearance • Two points for participating in the league championship series • Three points for winning a league pennant • Four points for winning the world series
  • 18. MLB VALUE SCORECARD • Historical, iconic brands such as the Yankees, Dodgers, Giants, Red Sox, Cubs and as we suggest the Cards, aside, most remaining clubs continue to generate both in- person and television interest throughout the season depending on their chances for appearing in the post-season. • We had the opportunity of speaking with Mike Ozanian, of Forbes who was closely involved in the exercise to estimate enterprise valuations for the 30 MLB organizations. • Revolutionary and dramatic impact of the RSN’s, the IRSN’s, the equity stakes by some teams in their networks, and in particular the explosive ripple felt throughout MLB with the $ 2 billion Guggenheim Group Dodger acquisition and their TWC television rights deal have substantially complicated the “algebra”.
  • 19. THREAT THAT MAY CREATE 3-TIER POWER STRUCTURE • Teams in middle and small market regions with smaller numbers of televisions and leverage with the RSN’s themselves, and the absence of available capital given the risk of “building” their own networks a la the Yankees.
  • 20. SOMETHING DIDN’T SMELL QUITE RIGHT • According to Forbes…………… • The Royals apparently had close to $ 100 million more in additional “sport” value over and above the Cardinals. • St. Louis was near the bottom of the list for this component value given their long and consistent on-field and financial success over multiple decades. • Their assertion that the Yankees brand value was in excess of 4 times greater the brand value of the Cardinals even though St. Louis out drew them in attendance while generating an average of close to 110,000 TV viewers vs the Yankees viewership of around 195,000
  • 21. SPORT FORBES RANK RANK RANK RANK FORBES $ (000) REV REV SPORT MKT STADIUM BRAND TOT DEBT EQUITY TEAM RANK MULT VALUE VALUE VALUE VALUE VALUE RATIO VALUE 1NY YANKEES 1 5.5 2 1 2 2 $2,535 1% $2,510 2LA DODGERS 4 6.9 1 2 1 3 $2,013 20% $1,610 3BOSTON 2 4.2 11 3 3 4 $1,508 0% $1,508 4CHICAGO CUBS 6 4.5 6 4 4 6 $1,205 35% $783 5SAN FRAN 3 3.2 24 5 5 5 $1,009 9% $918 6PHILLY 7 3.7 15 6 7 10 $979 10% $881 7TEXAS 9 3.2 23 8 8 8 $832 20% $666 8ST. LOUIS 5 2.9 27 10 6 7 $830 35% $540 9NY METS 13 3.4 22 9 12 9 $803 44% $450 10LA ANGELS 10 3.1 26 7 18 11 $776 4% $745 21ARIZONA 25 3.1 12 23 22 21 $586 25% $440 22COLORADO 22 2.9 14 21 21 24 $576 11% $513 23PITTSBURGH 20 2.8 7 26 23 22 $576 16% $484 24CLEVELAND 24 2.9 10 22 27 23 $571 15% $485 25MILWAUKEE 23 2.9 16 25 16 25 $567 9% $516 26HOUSTON 27 2.8 20 24 25 27 $530 49% $270 27OAKLAND 26 2.7 8 27 26 30 $496 13% $432 28ROYALS 29 2.8 3 28 30 28 $491 11% $437 29TAMPA BAY 28 2.7 5 30 29 29 $486 28% $350 30MIAMI 30 3.1 4 29 28 29 $486 44% $272
  • 22. ANALYSIS COMMENTS • Only the Dodgers drew more fans than St. Louis did in 2013; 3.7 million vs 3.4 million. • St. Louis metro area population is 2.8 million in comparison to: • N.Y.-20 million • L.A.- 13 million • Boston-4.6 million • Chicago-9.5 million • San Francisco- 4.5 million • Philadelphia- 6.0 million • Dallas-6.8 million • Sport revenue for St. Louis was $ 283 million as compared to: • N.Y.-$ 461 million • Boston-$ 357 million • San Francisco-$ 316 million • L.A.-$ 293 million
  • 23. ANALYSIS COMMENTS • On the $ 283 million, the Cardinals made $ 65 million, vs: • N.Y-$ 9 million loss • L.A.-$ 81 million loss • Philly-$ 21 million loss • Texas-$ 4.9 million loss • According to Forbes, the top seven teams alone account for 50% of the total combined market equity value capitalization for all 30 teams combined. The Yankees, Dodgers and Red Sox close to 1/3 of this aggregate total. If indeed this is real, it seems the implications are profound.
  • 24. ANALYSIS COMMENTS • The inherent inequity and disproportionate economic leverage poses a potentially serious if not devastating threat to the lower 1/3 of teams, in particular the small market ones. • Apparently and according to the Forbes sport values per team, operating profits don’t matter. • As a multiple of revenues, the sport values are all over the map and the extreme variance and dispersion of these multiples/values calls into question the underlying assumptions supporting them. • Why would one pay a multiple of 1.4 times sport revenues for the Royals who lost $ 7 million in 2013, but only .55 on the dollar for the Cardinals sport revenue stream that generated $ 65 million in operating profits?
  • 25. ANALYSIS COMMENTS • The short answer is no one would and there is simply no way the Royals have close to $ 100 million more in sport value than St. Louis does. It fails the sniff test and reflects an apparent failure to sanity check the numbers amongst the teams. • Moreover, the Dodgers apparently bled operating cash at a rather alarming rate and the market rewards that performance with a sport value multiple in excess of two times that of the Cardinals? • Absent compelling evidence to the contrary, we would suggest the market doesn’t value this stream at that rate and perhaps there is an effort at play to justify the $ 2.0 billion price paid by their investors rather than call into question the possibility that this deal might be an outlier, especially should the Dodgers continue to attract no more than 150,000 viewers per televised game.
  • 26. ANALYSIS COMMENTS • The contrasts to the apparent enterprise valuations done by Forbes for the NFL are striking: • Median revenue sport value multiple for the NFL teams was 4.1 times revenue with a high of 4.8 and a low of 3.2 or a range of 39% around the median. • In contrast, the range around the median MLB sport value multiple was 111% reflecting great and unexplained variation in the sports value estimations. • Using the success metric we described above, since 1994 the Cardinals have scored 39 points exceeded only by New York (79 pts.) and Boston (49 pts.). In contrast: • Dodgers-13 • Rangers-15 • Cubs-6 • Philly-17 • White Sox-12 • Royals-0
  • 27. IT’S ALL ABOUT CABLE SUBSCRIBER COUNTS
  • 28. IT’S ALL ABOUT CABLE SUBSCRIBER COUNTS
  • 29. IT’S ALL ABOUT CABLE SUBSCRIBER COUNTS
  • 30. IT’S ALL ABOUT CABLE SUBSCRIBER COUNTS • The value of the Dodger’s TWC “guarantee” notwithstanding, we are struck by the Yankee Nielsen sharply downward trend line above in relationship to the $ 1.3 billion market value estimation by Forbes which is almost 4 times their estimate for St. Louis. • A substantially greater market value makes sense, given the tremendous disparity in population base. • Yet, given this size of local market differential, the Cardinals drew more in attendance than the Yankees did in 2013, and their local Nielsen ratings were 3.4 times higher than the Yankees.
  • 31. IT’S ALL ABOUT CABLE SUBSCRIBER COUNTS • At some point and at some level, population size and TV counts have to translate into revenues and cash-flow-either on an annual basis or in the form of a terminal/exit payment. • 2013 estimated average regular season local market tuned-in television sets: Cardinals-110,000 Yankees-195,000 Boston-178,000 Dodgers-155,000 Cubs-60,000 Rangers-165,000 White Sox-69,000 Angels-86,000
  • 32. IS THIS DODGER “GRADE INFLATION”?? • When we examine relative “stadium” value between the Dodgers and the Cards, we see that Forbes valued L.A. ($ 490 million) some 2.3 times higher than they did the Cardinals. • This is with roughly only 10% greater attendance (+ 300k) and an average ticket price that is some 50% lower than the Cardinals ticket price. • Once again, this fails the sniff test. • Moreover, when we consider the size and reach of the Cardinals’ popularity across at least six states in addition to their local market, and the fact that the Cardinal brand is one of the most iconic in sports history, this also calls into question a purported Dodger brand value of $ 280 million, some 2.2 times higher than their Cardinal brand value estimate
  • 33. Scorecard analysis Forbes valuation conclusions: • Appears to us the Dodger enterprise value estimate may be more of an exercise to rationalize, justify the $ 2 billion acquisition price than a thorough analysis of the underlying component value drivers. • When we bump the Cardinals against those teams above and selected teams below them, given our scorecard analysis, we conclude the Cardinals are substantially under-valued. In fact, we suggest their enterprise valuation estimate should be closer to $ 1.2-$ 1.3 billion.
  • 34. EXECUTIVE GRADE CARD • We selected, then ranked the following executive performance attributes: • Annual television revenue rights • Average ticket prices • Actual attendance as percentage of annual attendance potential • Actual attendance as a percentage of primary local market population base • Sport revenue as measured by Forbes • Operations profitability as reported by Forbes • On-field success multiple as defined/discussed above
  • 35. EXECUTIVE GRADE CARD • We then weighted and compiled the various attribute rankings, weighting television rights at .8, attendance potential at 1.2, and attendance as a percentage of local base population at 1.4. All other attributes were weighted at 1.0. • To these weighted average attribute rankings we then penalized the top ten population markets by .15, and added a .15 premium to the ten smallest markets. Our rationale is based on the very clear advantage that mega market teams have in sheer numbers and the ability to leverage them vis a vis the smallest markets.
  • 36. EXECUTIVE GRADE CARD • Top five performing organizations: • Cardinals • Boston • Giants • Tigers • Cubs • Bottom five performing organizations: • Astros • Mets • Diamondbacks • Blue Jays • Marlins
  • 37. EXECUTIVE GRADE CARD • Most under-valued organizations: • Twins • Padres • Cardinals • Tigers • Pirates • Most over-valued organizations: • Braves • Mariners • White Sox • Blue Jays • Dodgers
  • 38. EXECUTIVE GRADECARD WGTS 0.8 1 1.2 1.4 1 1 1 RANK FORBES TV TIC ATT ATT/ SPORT OC % REV SUCCESS WTD ADJ FOR AREA POP MGT EQUITY MGT-EQ RIGHTS PRICE POT POP REV % MED MULT TOT POP POP ADJ RANK RANK RANK 1ST. LOUIS 23 6 2 2 5 2 3 39.6 33.66 2,810,056 0.85 1 14 (13) 2BOSTON 8 1 3 14 2 11 2 45.6 45.6 4,684,299 1 2 3 (1) 3SAN FRAN 19 9 1 9 3 3 5 49 49 4,500,000 1 3 4 (1) 4DETROIT 14 14 4 10 8 14 9 75 75 4,294,983 1 4 17 (13) 5CHICAGO CUBS 10 3 10 13 6 9 24 80.2 80.2 4,292,000 1 5 6 (1) 6NY YANKEES 5 2 9 25 1 22 1 75.8 87.17 13,000,000 1.15 6 1 5 7MINNESOTA 21 8 12 11 14 7 21 96.6 96.6 3,459,146 1 7 26 (19) 8MILWAUKEE 26 17 13 1 23 13 26 116.8 99.28 1,569,659 0.85 8 15 (7) 9SAN DIEGO 9 30 21 12 19 4 17 119.2 101.32 3,211,252 0.85 9 25 (16) 10PHILLY 16 4 5 16 7 28 10 90.2 103.73 6,034,678 1.15 10 5 5 11PITTSBURGH 29 19 16 4 20 8 28 123 104.55 2,360,867 0.85 11 19 (8) 12CINCY 18 23 14 3 18 26 25 127.4 108.29 2,137,406 0.85 12 13 (1) 13COLORADO 24 28 15 5 22 12 22 128.2 108.97 2,697,476 0.85 13 16 (3) 14BALTIMORE 20 18 20 7 21 17 23 128.8 109.48 2,770,738 0.85 14 20 (6) 15CLEVELAND 13 26 29 8 24 19 6 131.4 111.69 2,064,725 0.85 15 18 (3) 16LA ANGELS 2 13 7 29 10 16 8 97.6 112.24 13,131,431 1.15 16 7 9 17TEXAS 3 20 8 20 9 21 12 102 117.3 6,810,913 1.15 17 11 6 18ATLANTA 30 27 19 21 11 5 4 123.2 123.2 5,522,942 1 18 8 10 19SEATTLE 4 12 30 17 16 15 19 125 125 3,610,105 1 19 9 10 20WASHINGTON 22 5 11 22 12 10 27 115.6 132.94 5,949,859 1.15 20 27 (7) 21CHICAGO WHITE SOX 11 15 26 18 17 20 16 133.2 133.2 3,624,000 1 21 10 11 22LA DODGERS 1 21 6 30 4 30 13 118 135.7 17,000,000 1.15 22 2 20 23TAMPA BAY 27 24 24 15 30 29 7 161.4 137.19 2,870,569 0.85 23 28 (5) 24OAKLAND 12 22 17 24 26 6 20 137.6 137.6 4,500,000 1 24 24 0 25ROYALS 25 25 23 6 29 24 30 164 139.4 2,054,473 0.85 25 23 2 26HOUSTON 6 10 28 28 27 1 14 129.6 149.04 6,313,158 1.15 26 30 (4) 27NY METS 7 16 22 27 13 18 15 131.8 151.57 8,000,000 1.15 27 21 6 28ARIZONA 17 29 25 19 25 23 11 158.2 158.2 4,398,762 1 28 22 6 29TORONTO 15 7 18 23 15 27 29 143.8 165.37 6,054,000 1.15 29 12 17 30MIAMI 28 11 27 26 28 25 18 173.2 199.18 5,828,191 1.15 30 29 1
  • 39. A GLIMPSE TO THE FUTURE-UNBUNDLING THE BUNDLES? • Absent bundled programming to absorb and disperse these fees across non-sports programing, an a la carte, cafeteria programming and pricing structure would be cost-prohibitive and likely accelerate the steady decline in local MLB viewership trends. • Oddly and likely to continue in the immediate-term, ESPN and others have been able to experience strong revenue growth from declining MLB local tv ratings, and sharply declining ratings on national MLB programming. • Across all national stations that broadcast MLB, ratings have been falling. • This represents a counter-intuitive economic notion that depends on mandated bundled programming products to cable consumers, who until very recently have shown no signs of push-back. • One must have cable to watch MLB locally, and one must buy bundled packages through their cable operator to see the games.
  • 40. A GLIMPSE TO THE FUTURE-UNBUNDLING THE BUNDLES?
  • 41. A GLIMPSE TO THE FUTURE-UNBUNDLING THE BUNDLES?
  • 42. A GLIMPSE TO THE FUTURE-UNBUNDLING THE BUNDLES? • Ironically, several of the teams with the most current lucrative cable deals (L.A. Angels, Astros, White Sox & A’s) are at the very bottom in local ratings:
  • 43. A GLIMPSE TO THE FUTURE-UNBUNDLING THE BUNDLES? • According to ESPN's sports business reporter Darren Rovell, even after factoring for inflation, baseball revenues are up 242% since 1990. In turn, player salaries have risen 194% in that time. • Television is bringing riches to everyone involved with baseball. Footing the bill are consumers who pay an unseen "baseball tax" in their cable bill each month. Baseball has managed to pull off the remarkable feat of decoupling revenue from popularity because it's the single largest beneficiary of cable bundles. • The bundle gives cable networks themselves a point of tremendous leverage over cable operators. • They can expand their revenues by creating lightly watched channels that get very low affiliate fees, but are assured distribution to millions of homes they can sell advertising spots to as well.
  • 44. A GLIMPSE TO THE FUTURE-UNBUNDLING THE BUNDLES? Stephen Dixon, A Channel Worth Changing? The Individual Regional Sports Network: Proliferation, Profits, Parity, and the Potential Administrative and Antitrust Issues That Could Follow (Journal of The National Association of Administrative Law Judiciary, Pepperdine University School of Law, 11/6/2013): • “…………More likely than not, baseball will not face any sort of adjustments to its financial structure or to its revenue generating and revenue sharing mechanisms. Whether baseball needs to be saved from itself is a debate that people will be having more and more frequently in the coming decades. Many people will look back on the sale of the Dodgers, and Commissioner Selig’s role in it, and simply admire it for being a decision made by a commissioner who loved baseball and who wanted to save one of its most storied franchises from falling into further disrepair-and they would not be crazy for feeling that way. But some people will look back at the mad dash for television money that followed and see something more. After all, there are only so many elite baseball players to go around…………..”
  • 45. Rank 2014 RANK Team % MKT CAP VALUE % CHANGE 14 VAL REV MULT 1 1 New York Yankees 9% $3,200 28% $2,500 6.3 2 2 Los Angeles Dodgers 7% $2,400 20% $2,000 6.0 3 3 Boston Red Sox 6% $2,100 40% $1,500 5.7 4 5 San Francisco Giants 6% $2,000 100% $1,000 5.2 5 4 Chicago Cubs 5% $1,800 50% $1,200 6.0 6 8 St Louis Cardinals 4% $1,400 71% $819 4.8 7 9 New York Mets 4% $1,350 69% $799 5.1 8 10 Los Angeles Angels of Anaheim 4% $1,300 68% $774 4.3 9 13 Washington Nationals 4% $1,280 83% $699 4.5 10 6 Philadelphia Phillies 3% $1,250 28% $977 4.7 11 7 Texas Rangers 3% $1,220 48% $824 4.6 12 11 Atlanta Braves 3% $1,150 58% $728 4.3 13 15 Detroit Tigers 3% $1,125 65% $682 4.4 14 12 Seattle Mariners 3% $1,100 55% $710 4.4 15 16 Baltimore Orioles 3% $1,000 61% $621 4.1