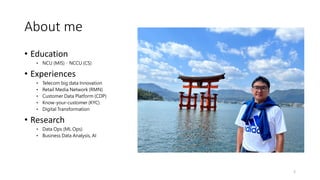
About me
• Education
•NCU (MIS)、NCCU (CS)
• Experiences
• Telecom big data Innovation
• Retail Media Network (RMN)
• Customer Data Platform (CDP)
• Know-your-customer (KYC)
• Digital Transformation
• Research
• Data Ops (ML Ops)
• Business Data Analysis, AI
2
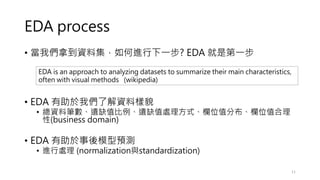
EDA process
• 當我們拿到資料集,如何進行下一步?EDA 就是第一步
• EDA 有助於我們了解資料樣貌
• 總資料筆數、遺缺值比例、遺缺值處理方式、欄位值分布、欄位值合理
性(business domain)
• EDA 有助於事後模型預測
• 進行處理 (normalization與standardization)
11
EDA is an approach to analyzing datasets to summarize their main characteristics,
often with visual methods (wikipedia)
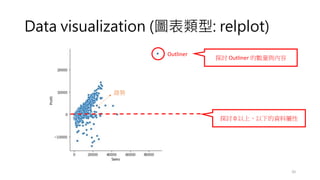
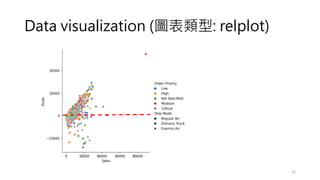
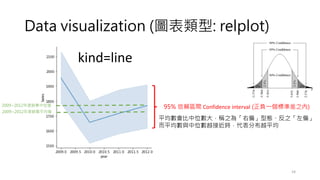
Data visualization (圖表類型:relplot)
• Visualizing statistical relationships
• Statistical analysis is a process of understanding how variables in a dataset
relate to each other and how those relationships depend on other variables.
• Visualization can be a core component of this process because, when data are
visualized properly, the human visual system can see trends and patterns that
indicate a relationship.
19
參考: https://www.cntofu.com/book/172/docs/10.md
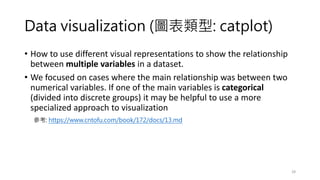
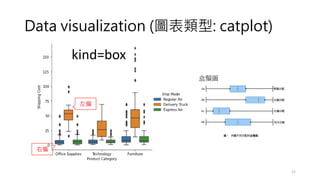
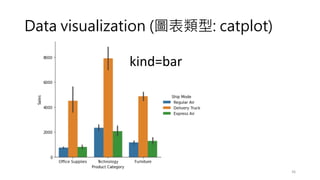
Data visualization (圖表類型:catplot)
• How to use different visual representations to show the relationship
between multiple variables in a dataset.
• We focused on cases where the main relationship was between two
numerical variables. If one of the main variables is categorical
(divided into discrete groups) it may be helpful to use a more
specialized approach to visualization
28
參考: https://www.cntofu.com/book/172/docs/13.md
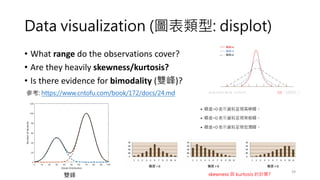
Data visualization (圖表類型:displot)
• What range do the observations cover?
• Are they heavily skewness/kurtosis?
• Is there evidence for bimodality (雙峰)?
39
參考: https://www.cntofu.com/book/172/docs/24.md
雙峰 skewness 與 kurtosis 的計算?


![[系列活動] 給工程師的統計學及資料分析 123](https://cdn.slidesharecdn.com/ss_thumbnails/0114lckungtdsaprerequisite-170110090917-thumbnail.jpg?width=640&height=640&fit=bounds)

![[系列活動] 手把手教你R語言資料分析實務](https://cdn.slidesharecdn.com/ss_thumbnails/stepbystepr20170114-170113030702-thumbnail.jpg?width=640&height=640&fit=bounds)