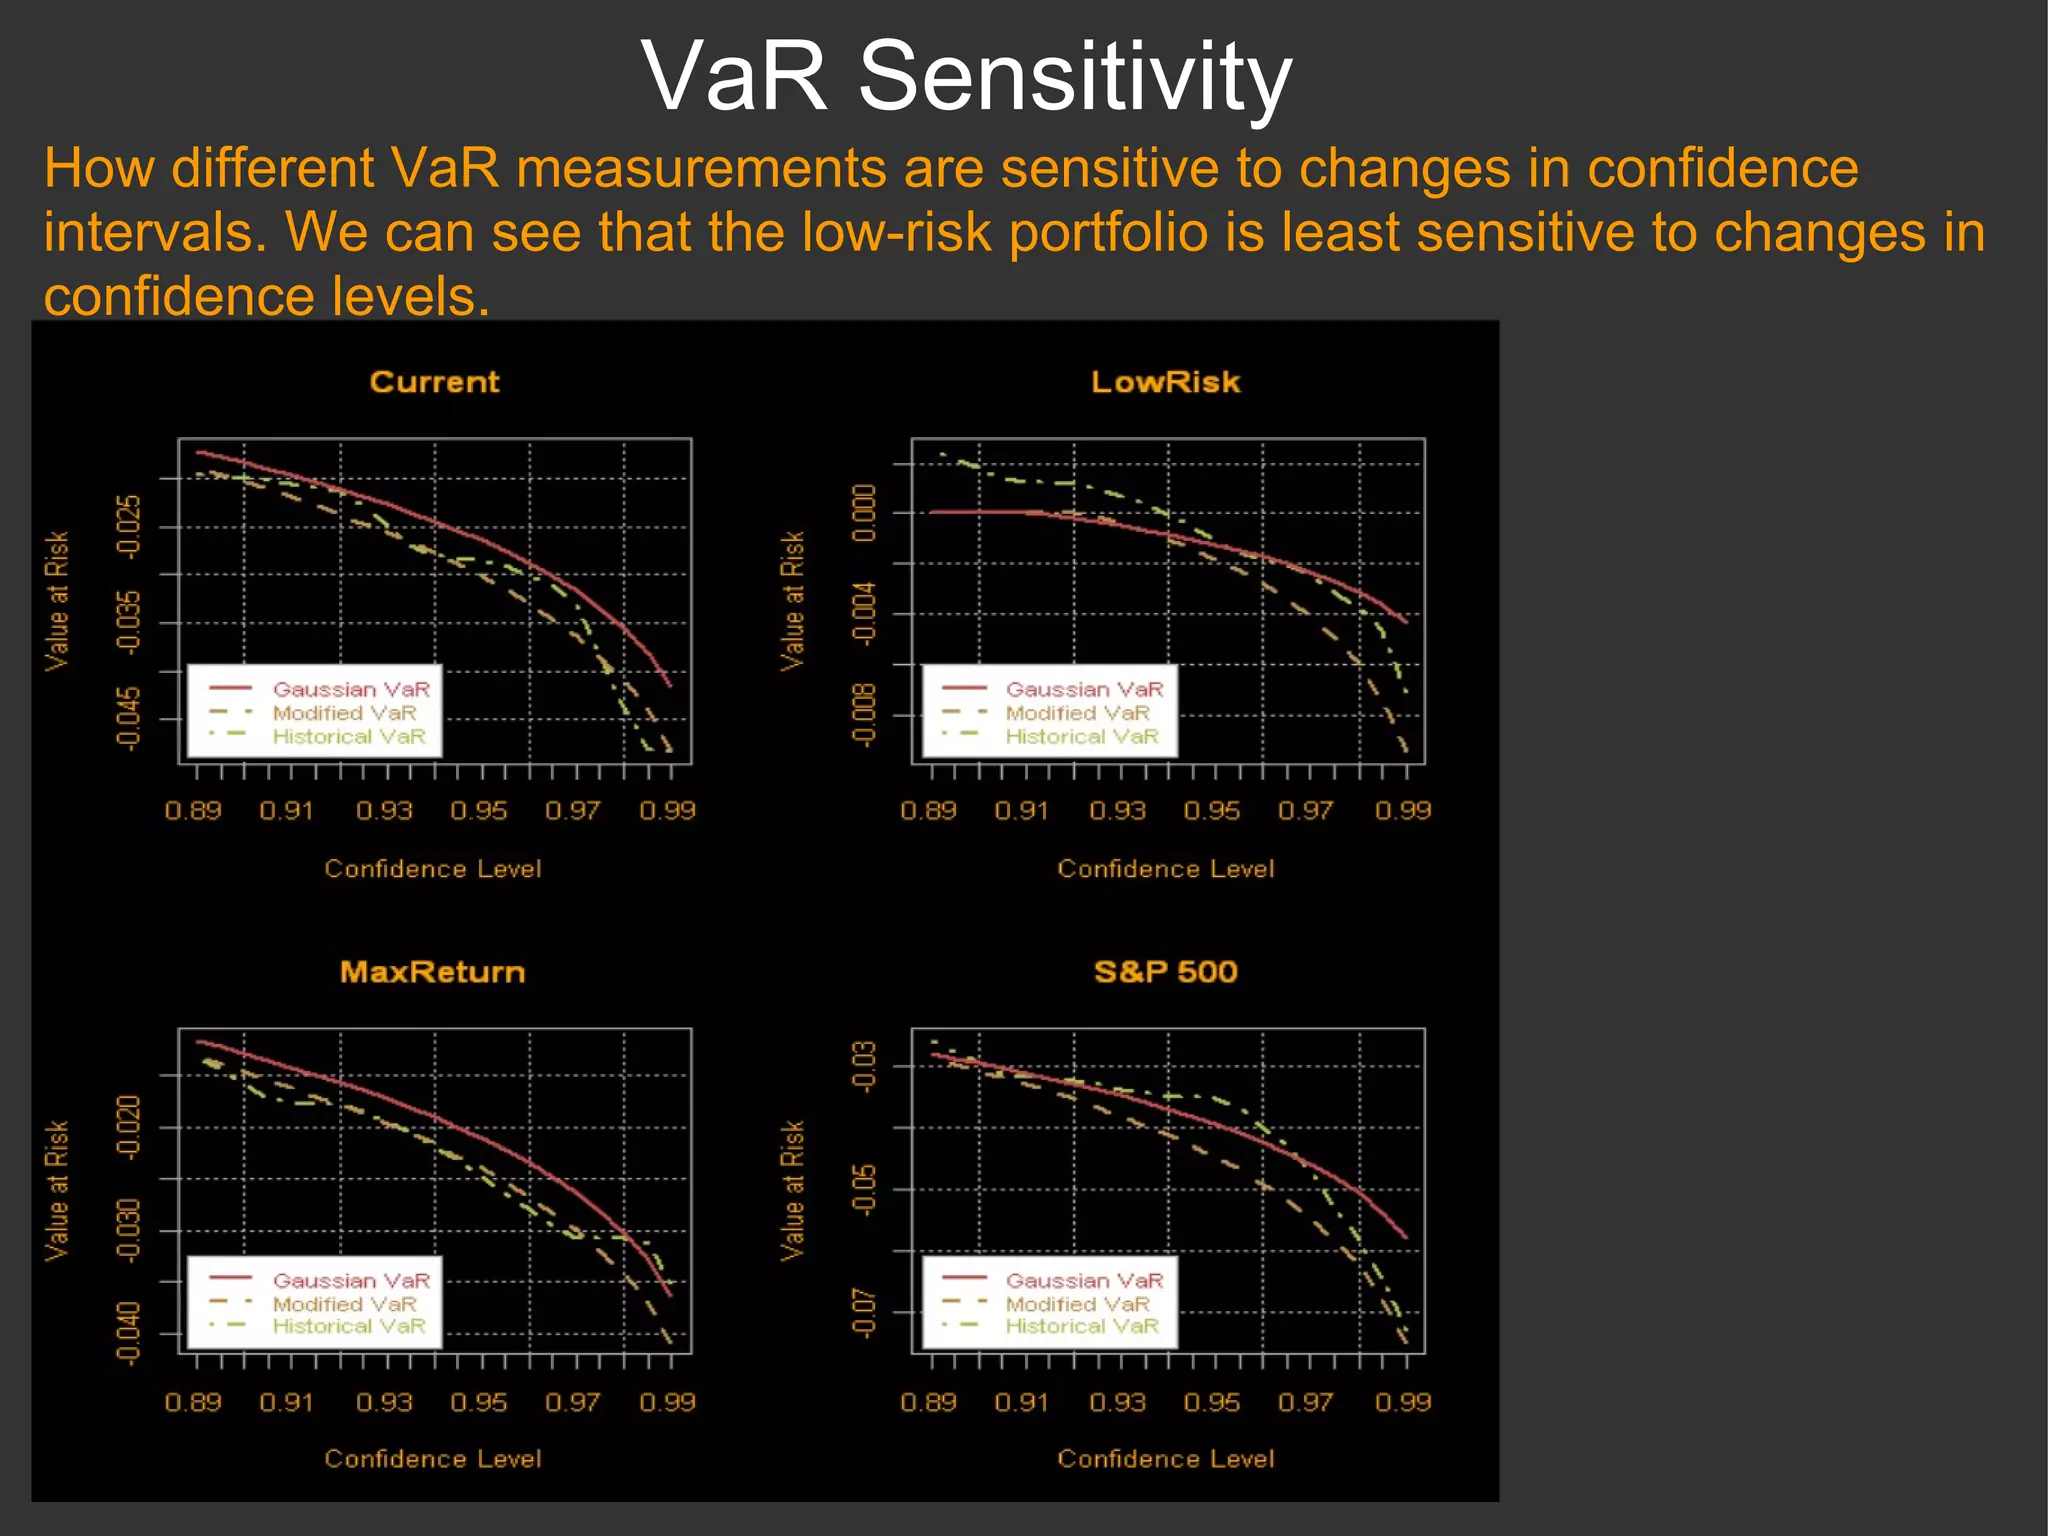
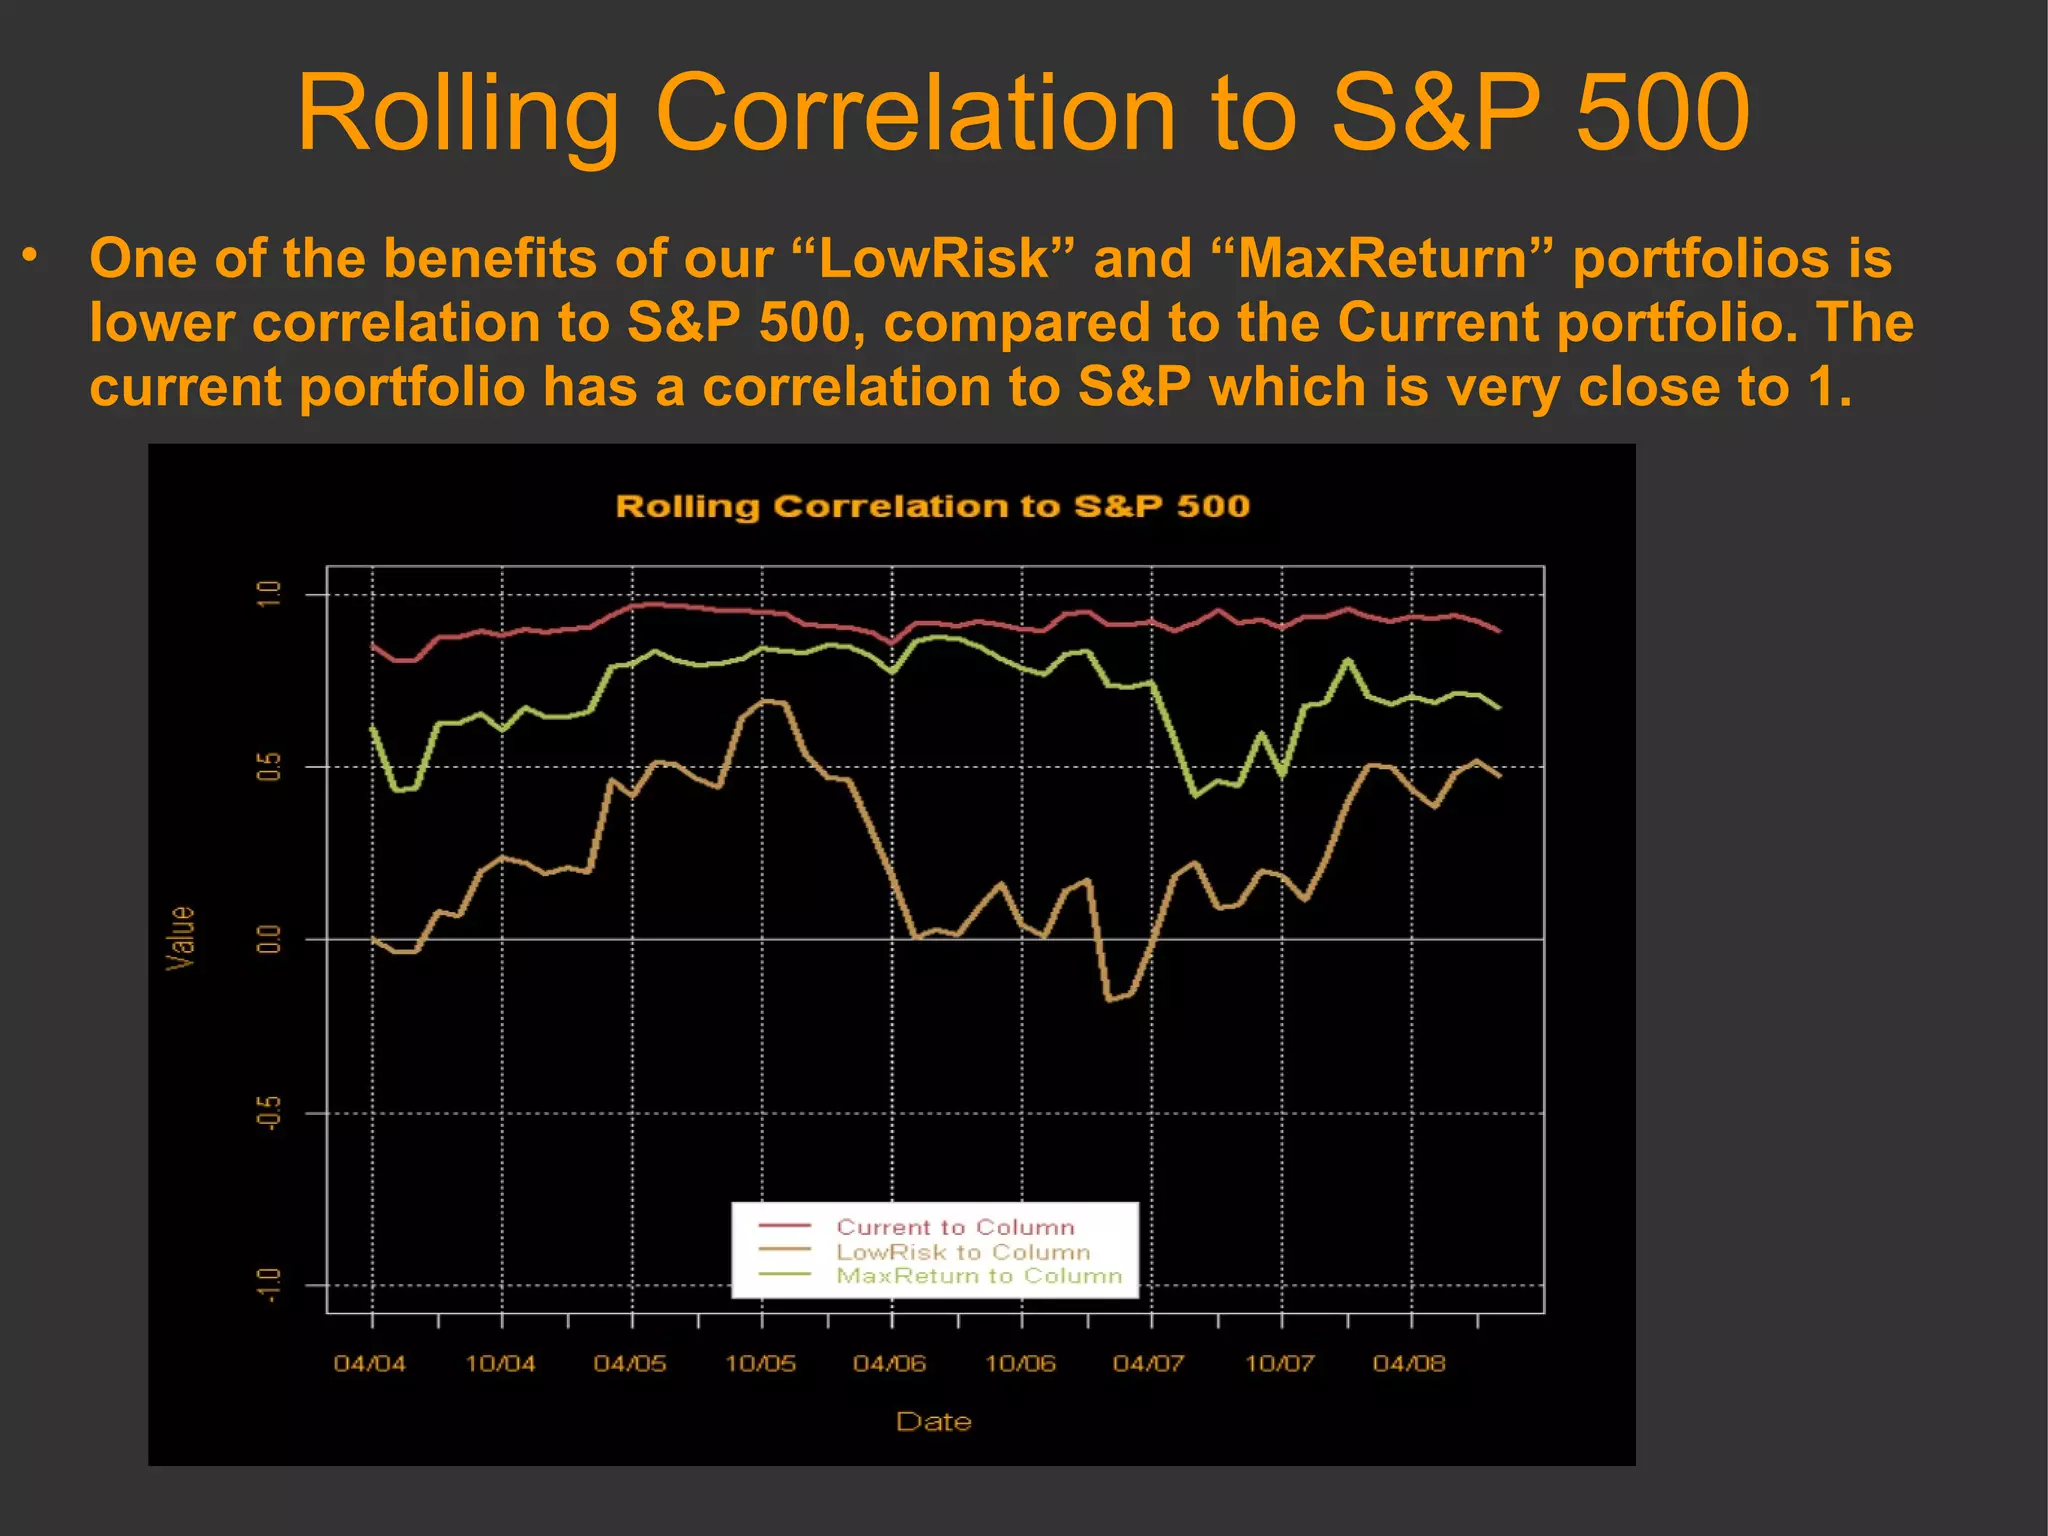
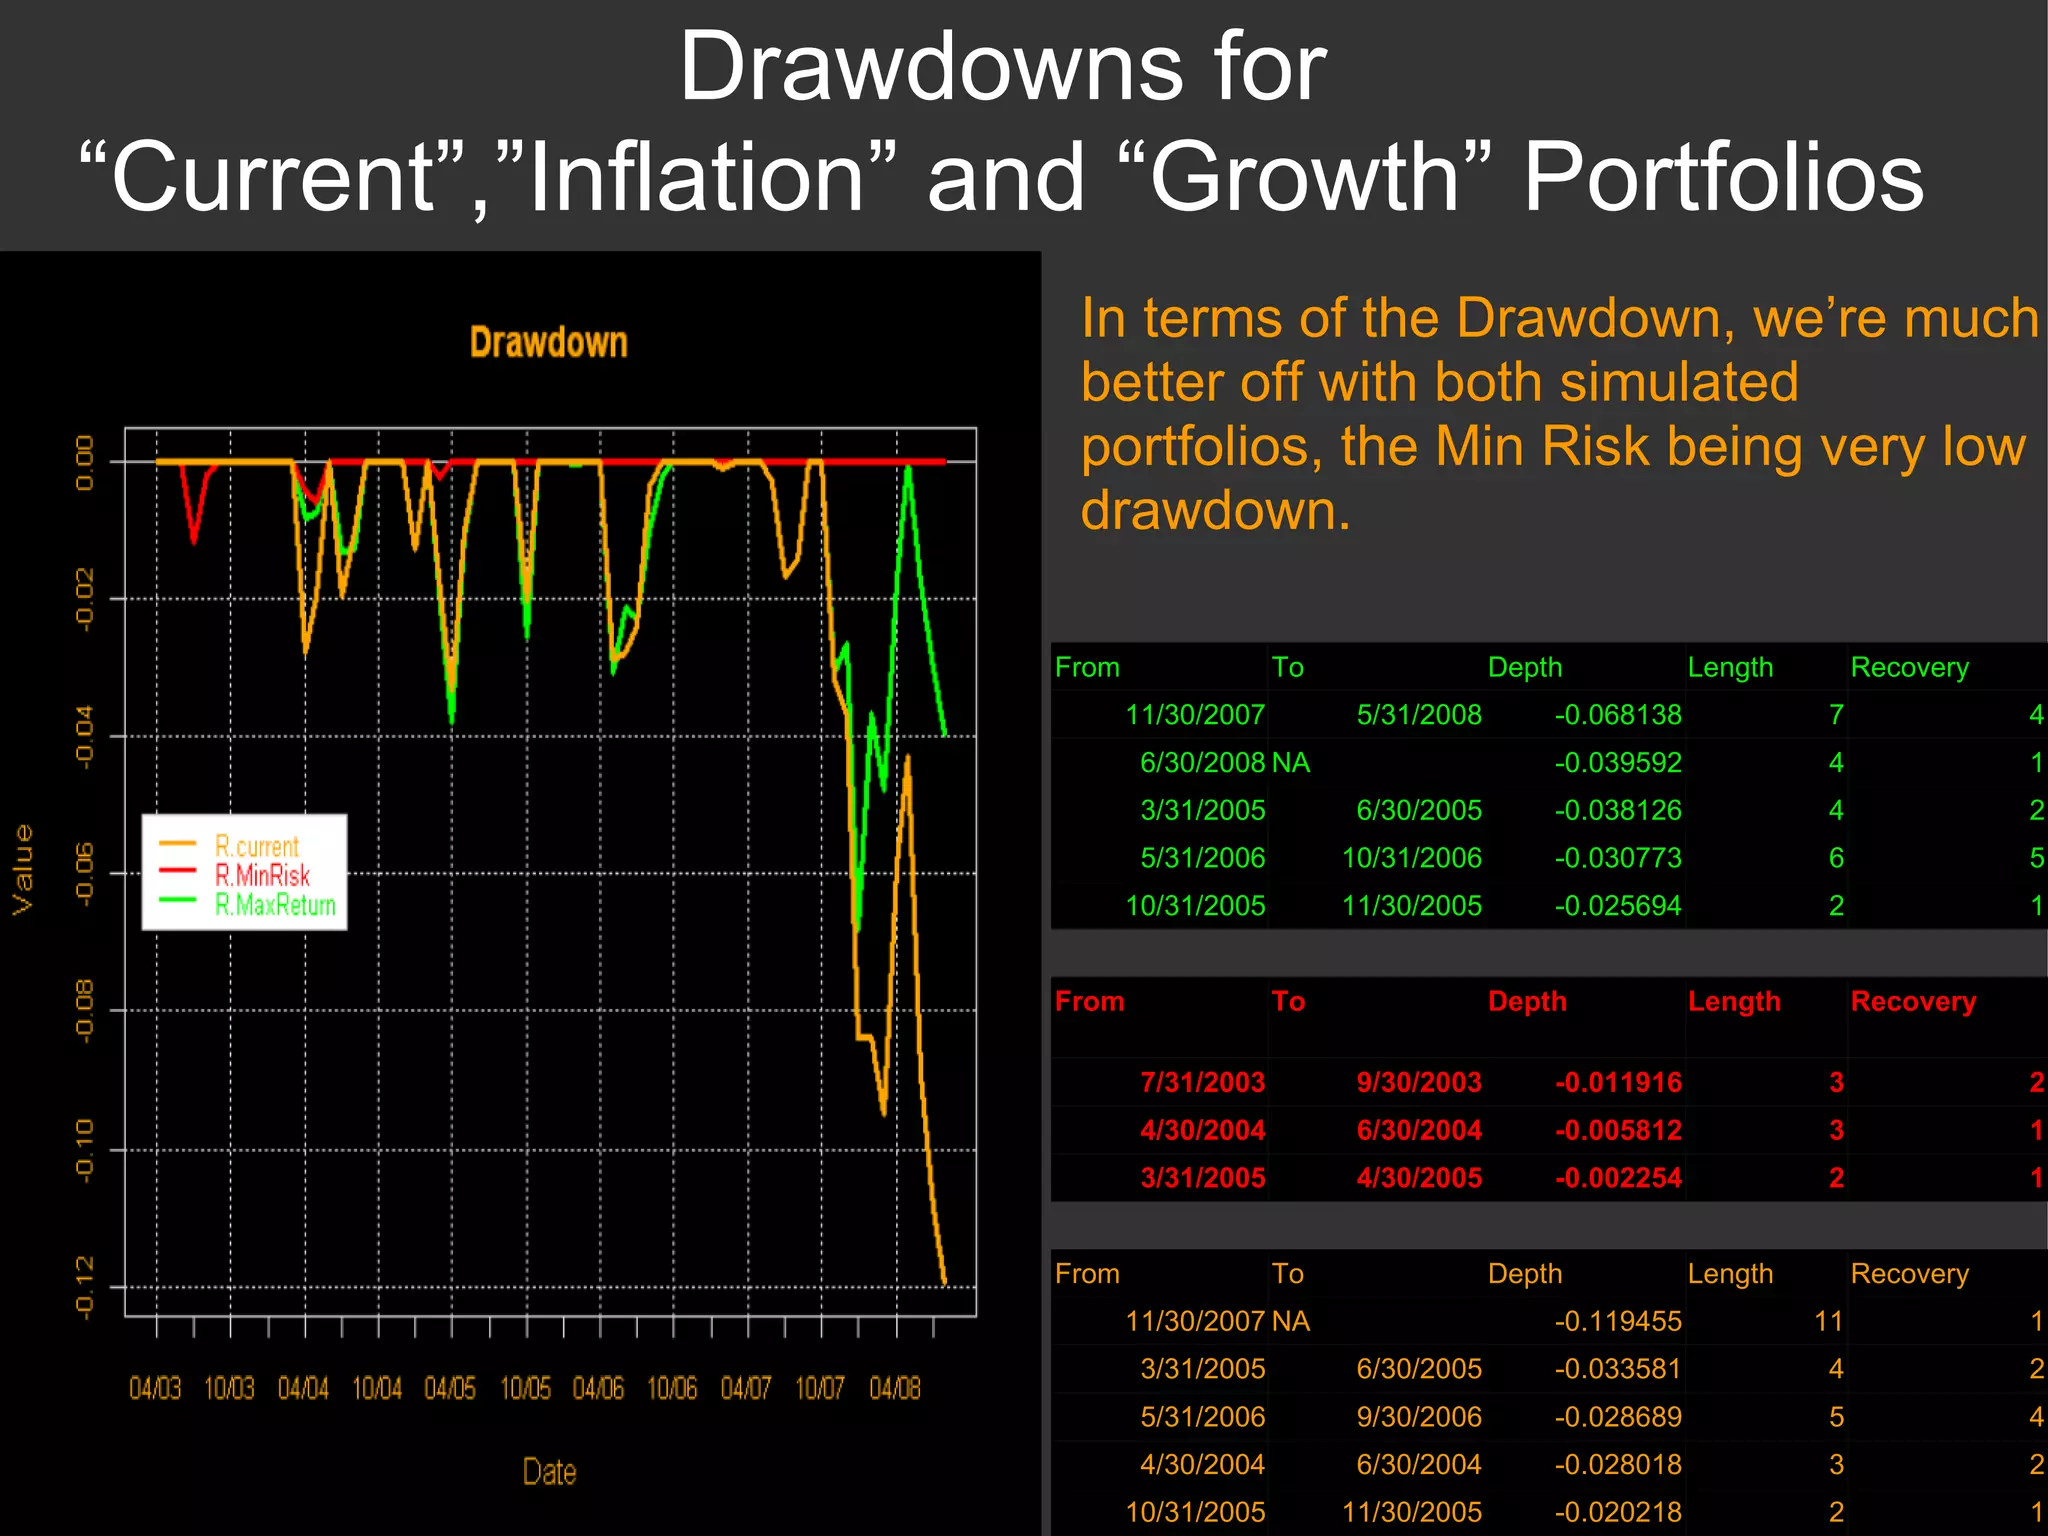
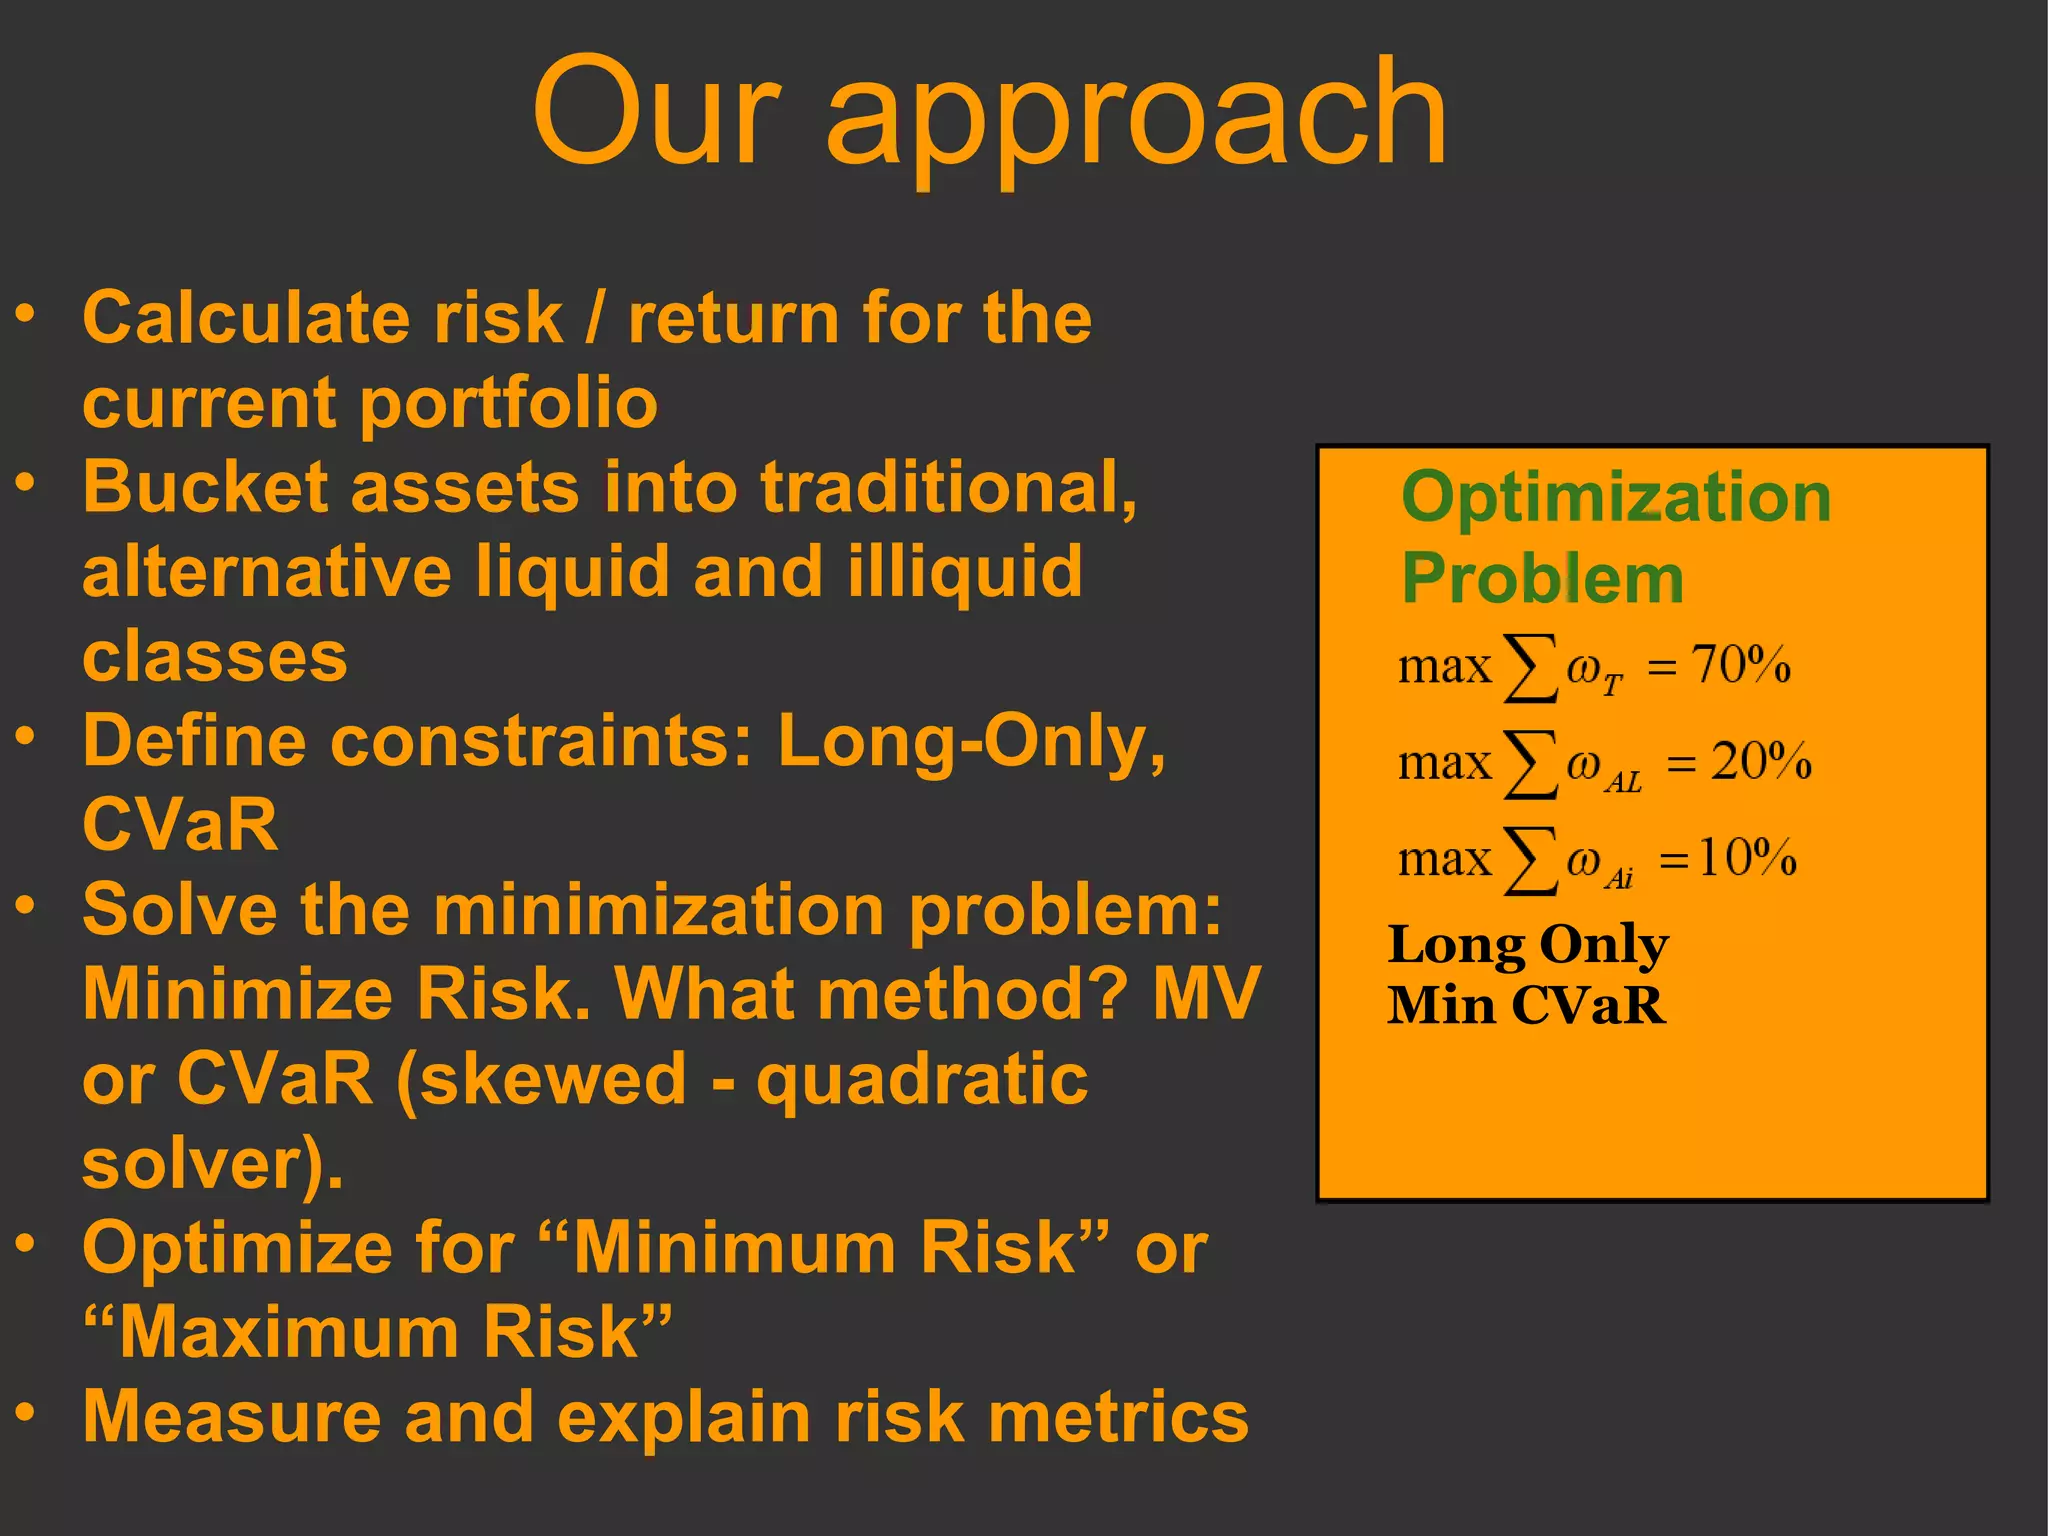
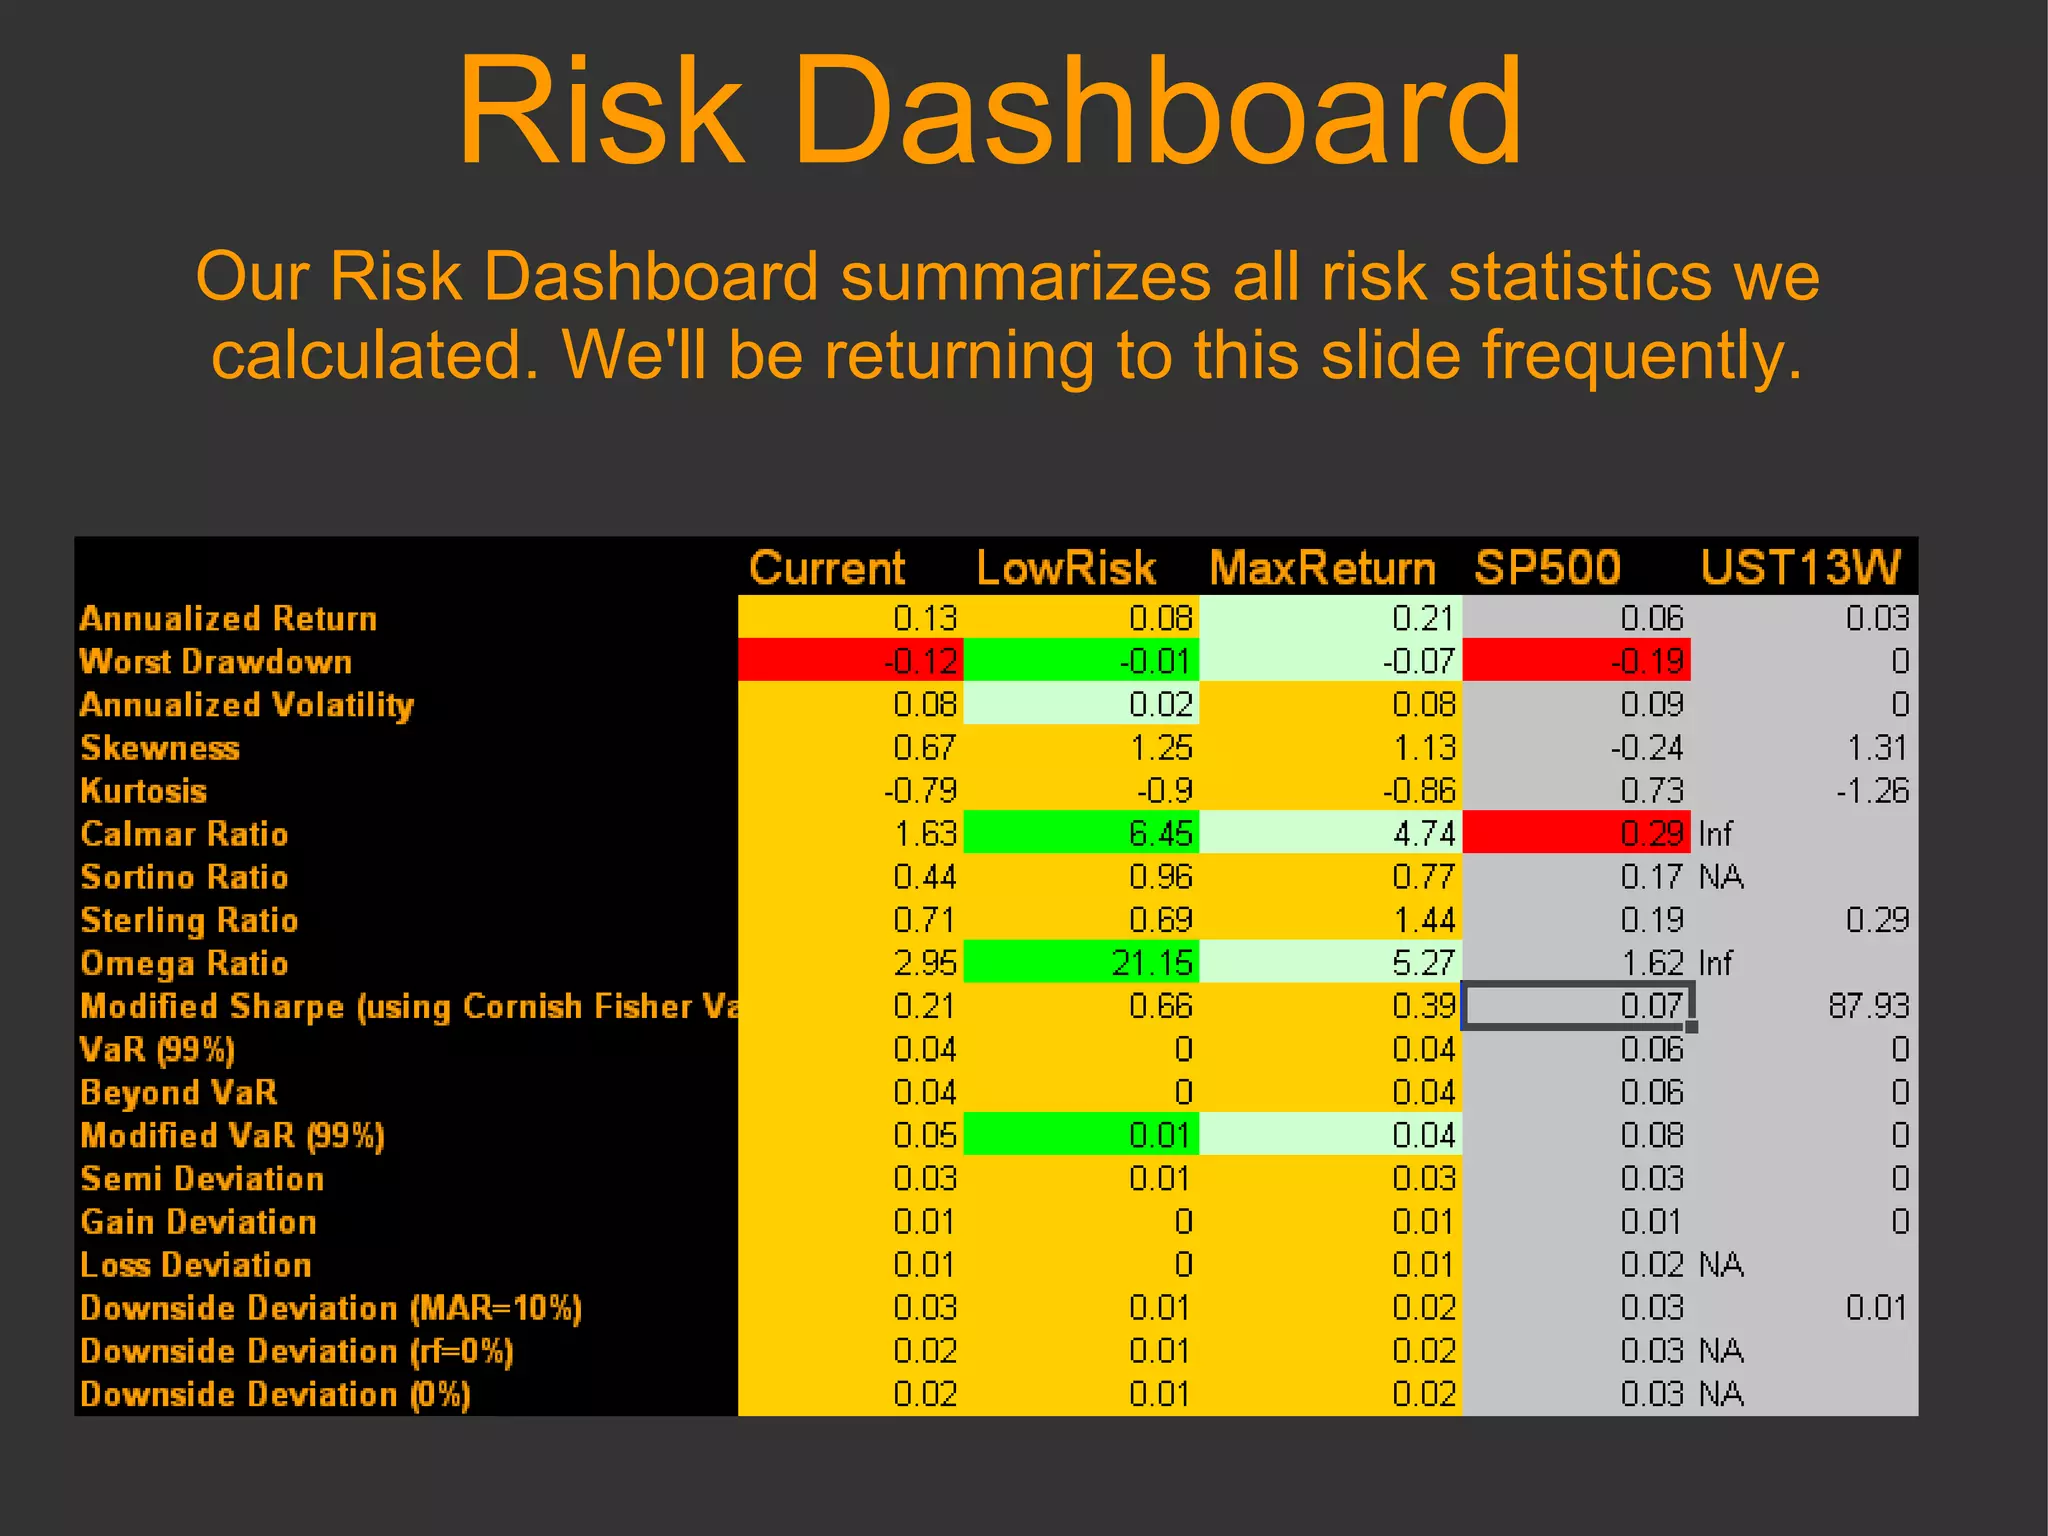
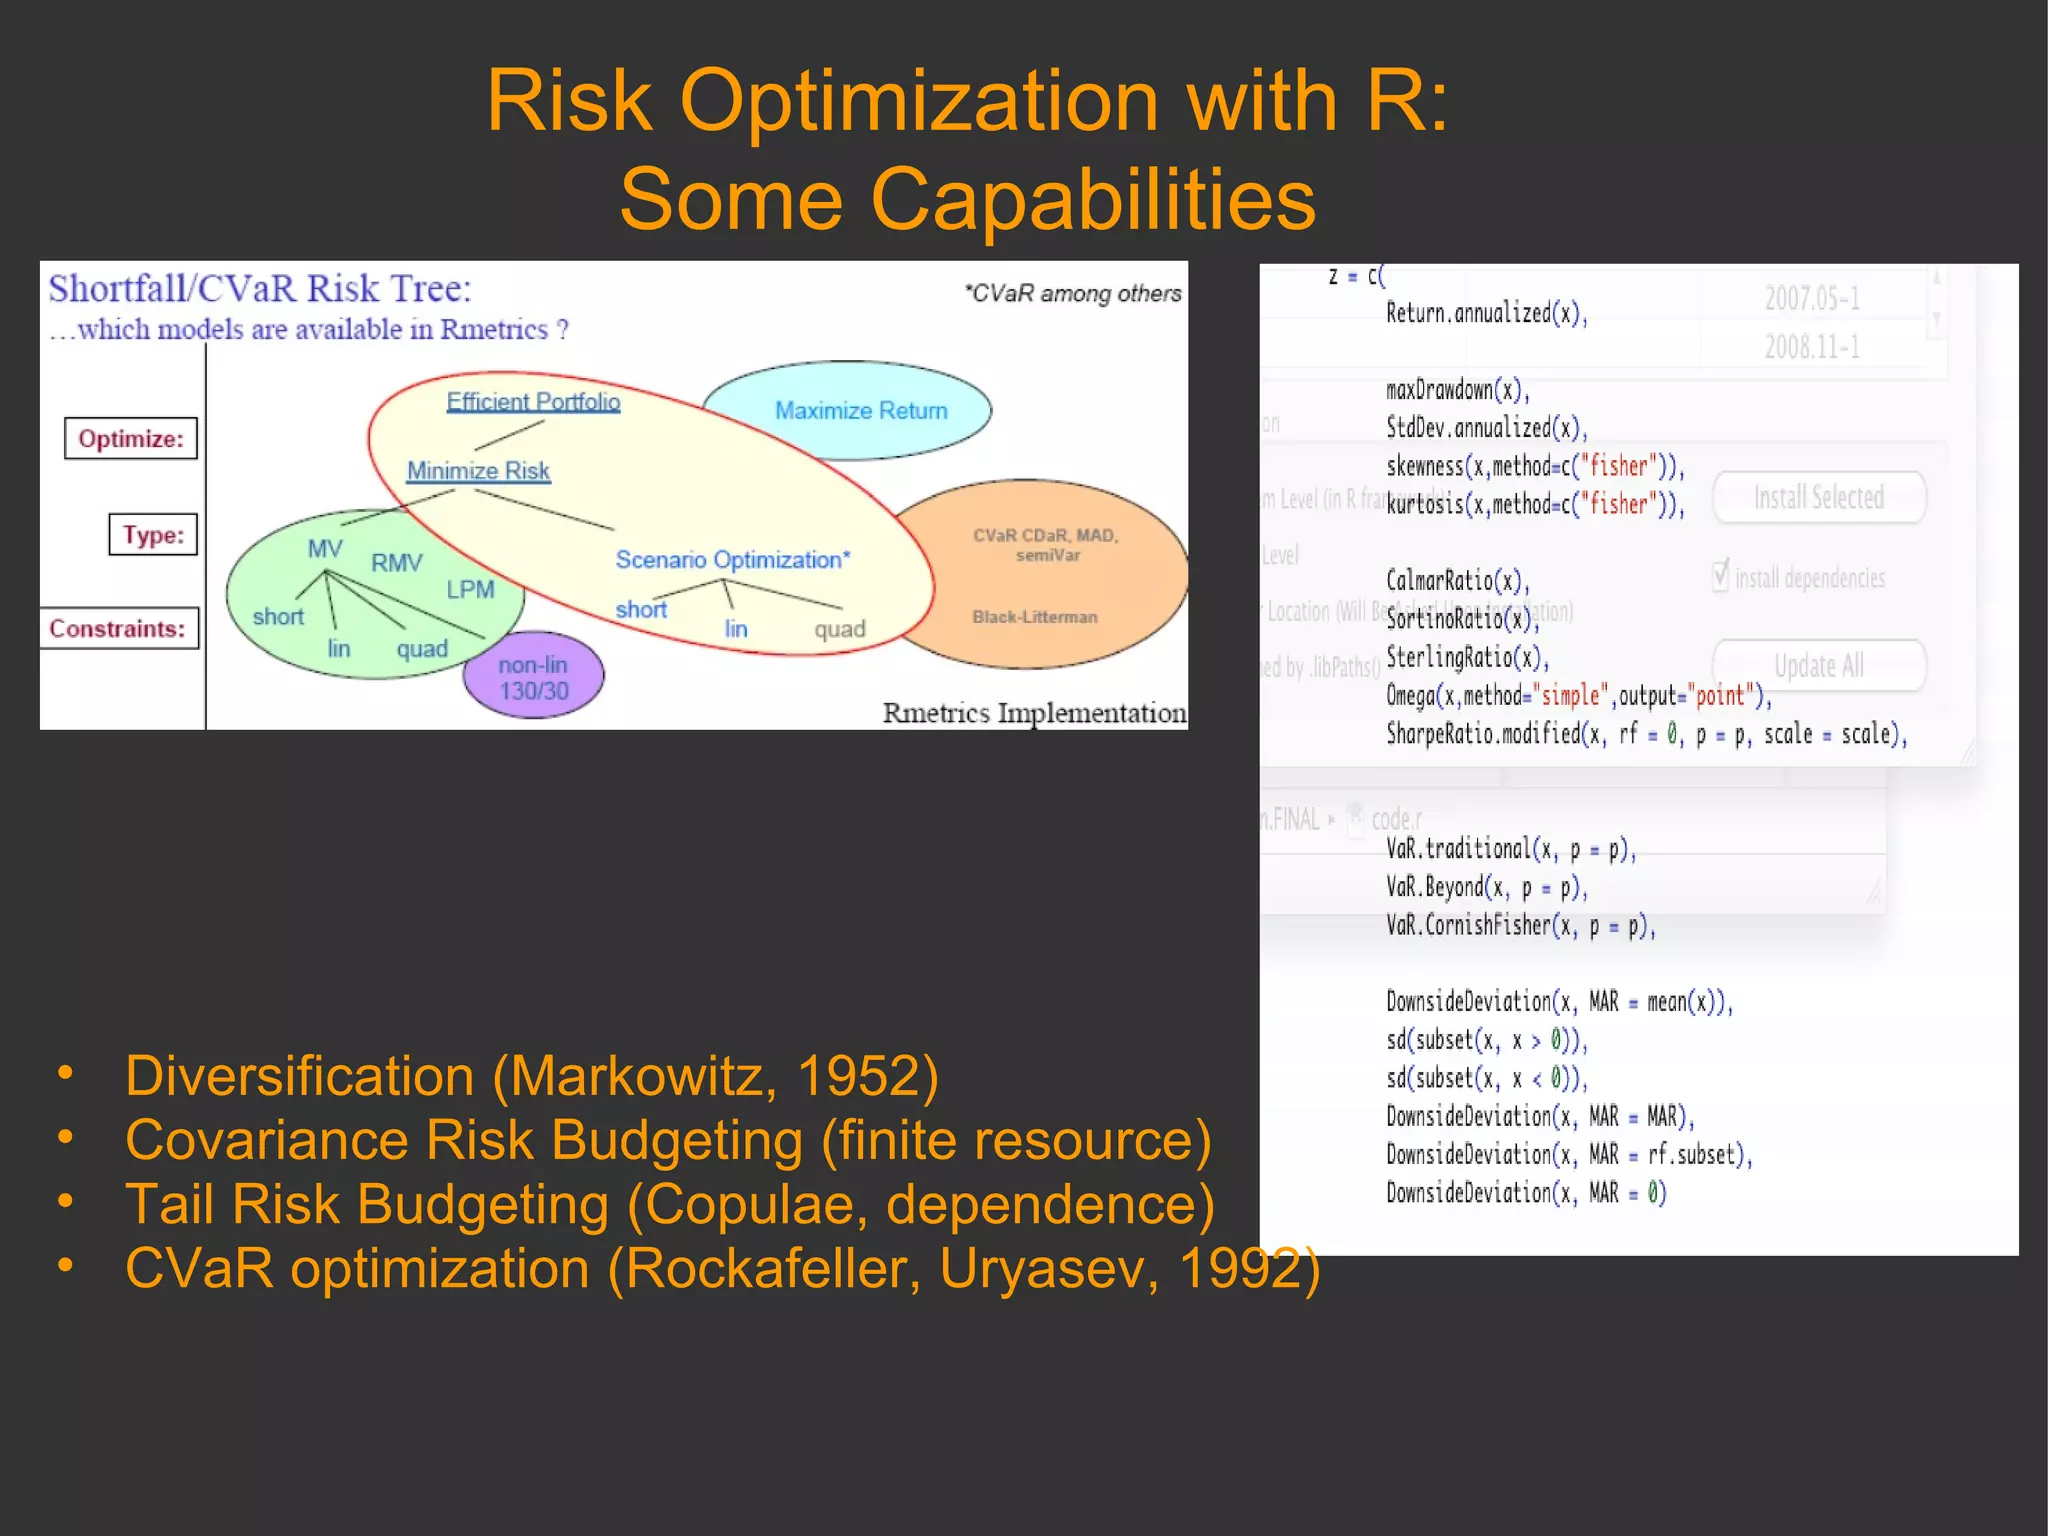
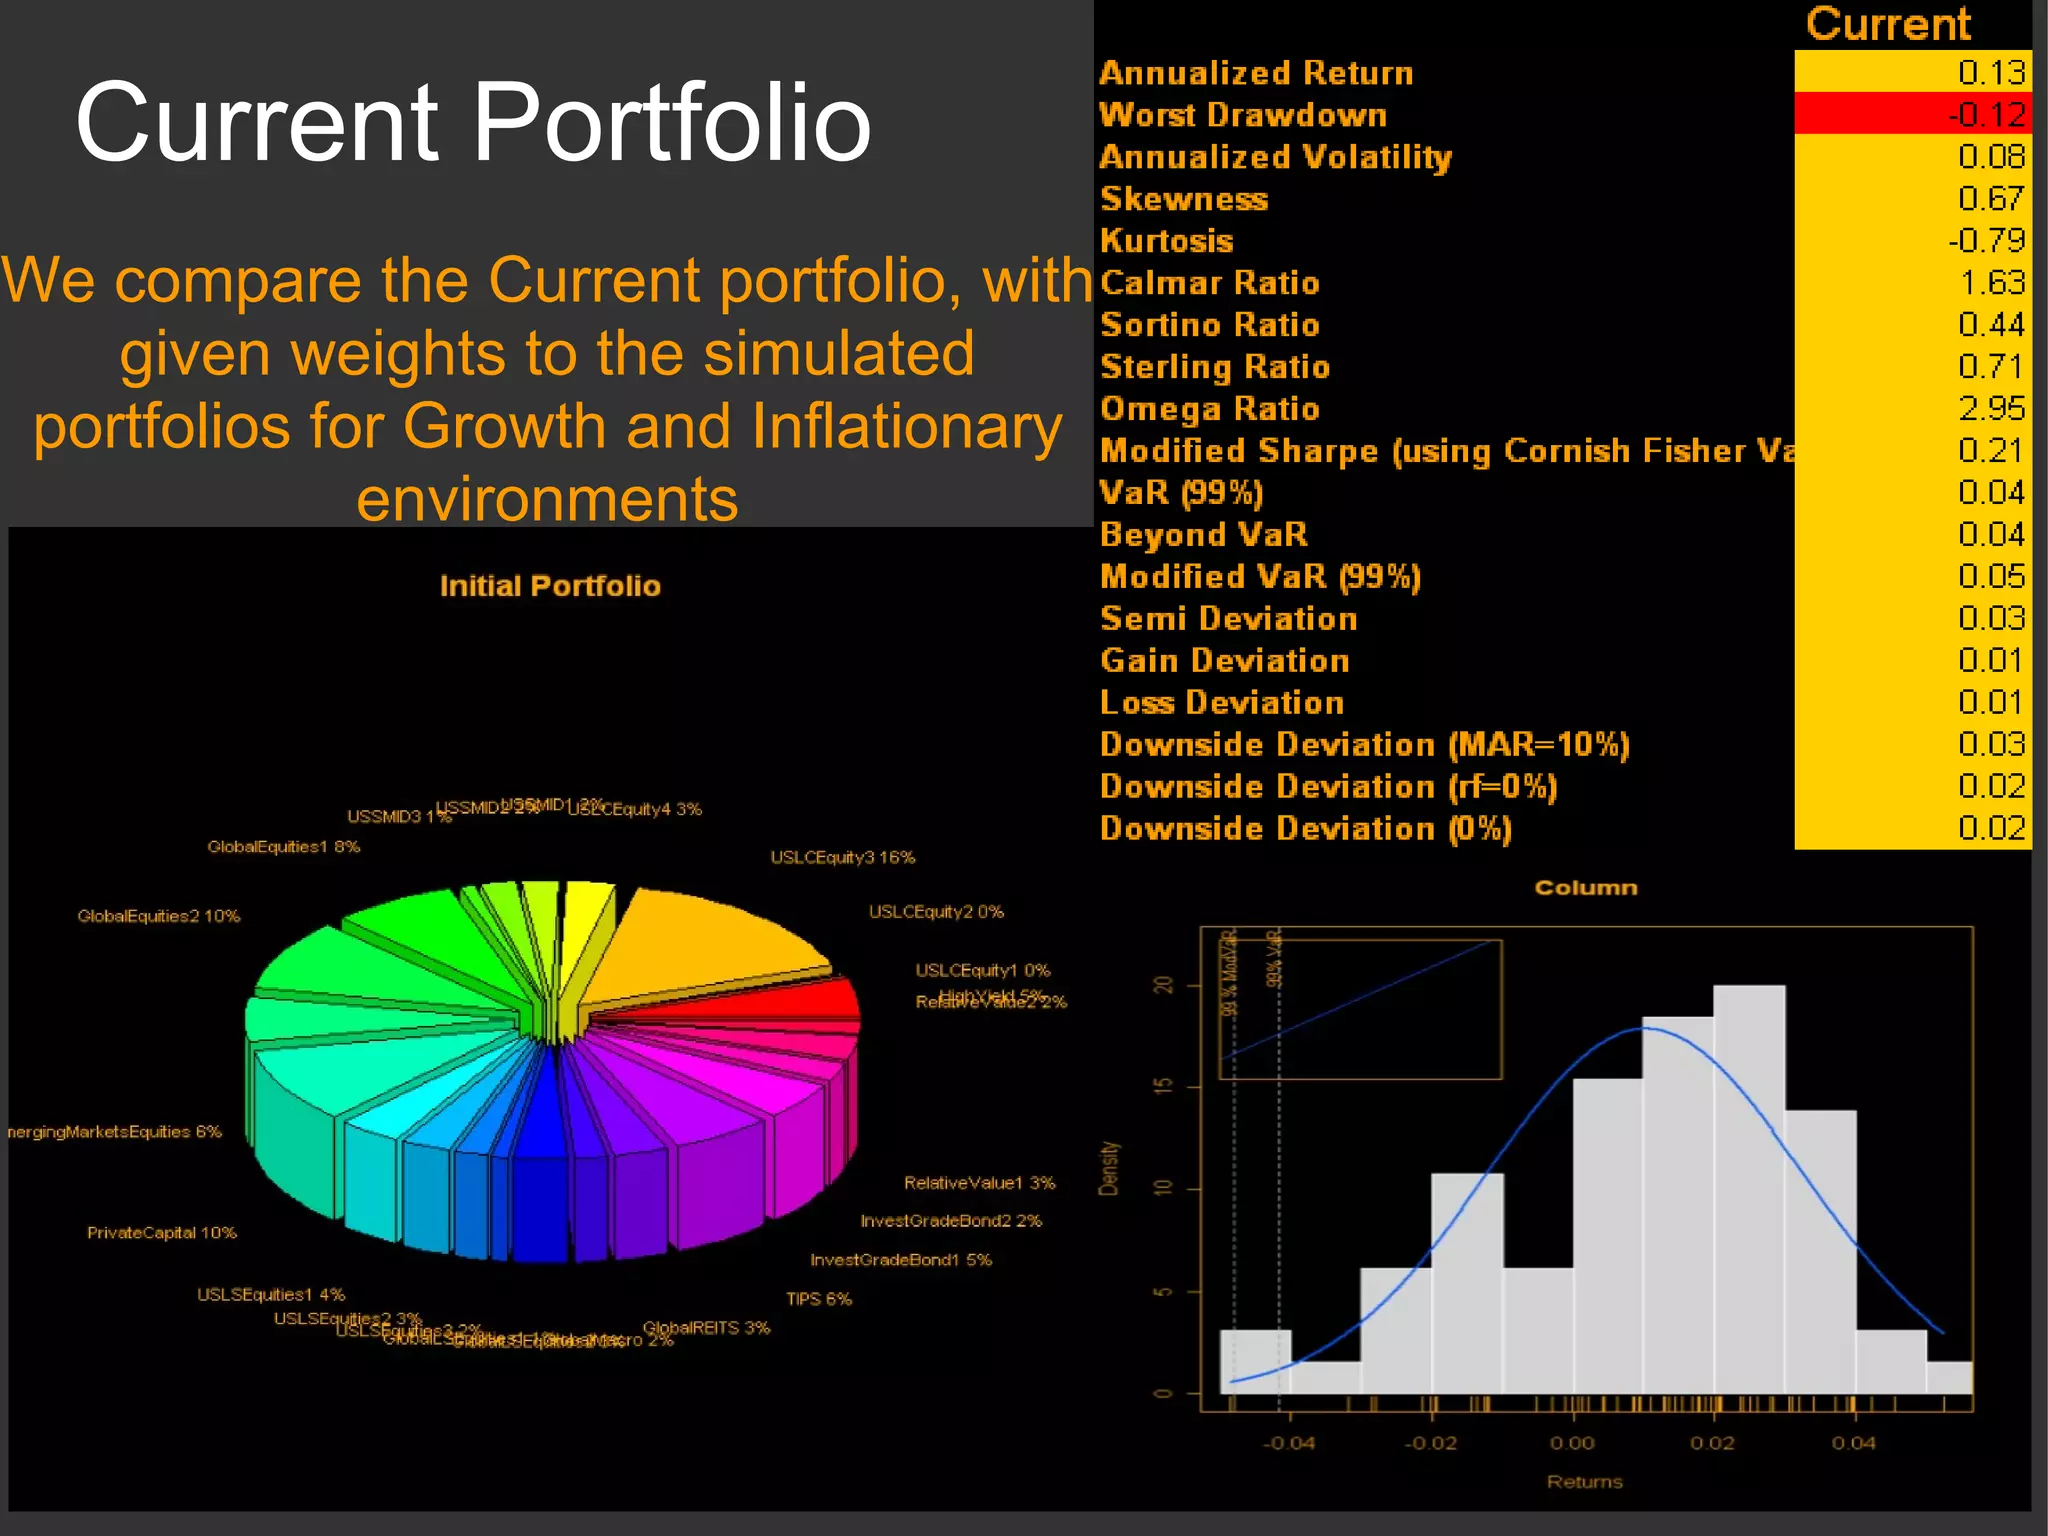
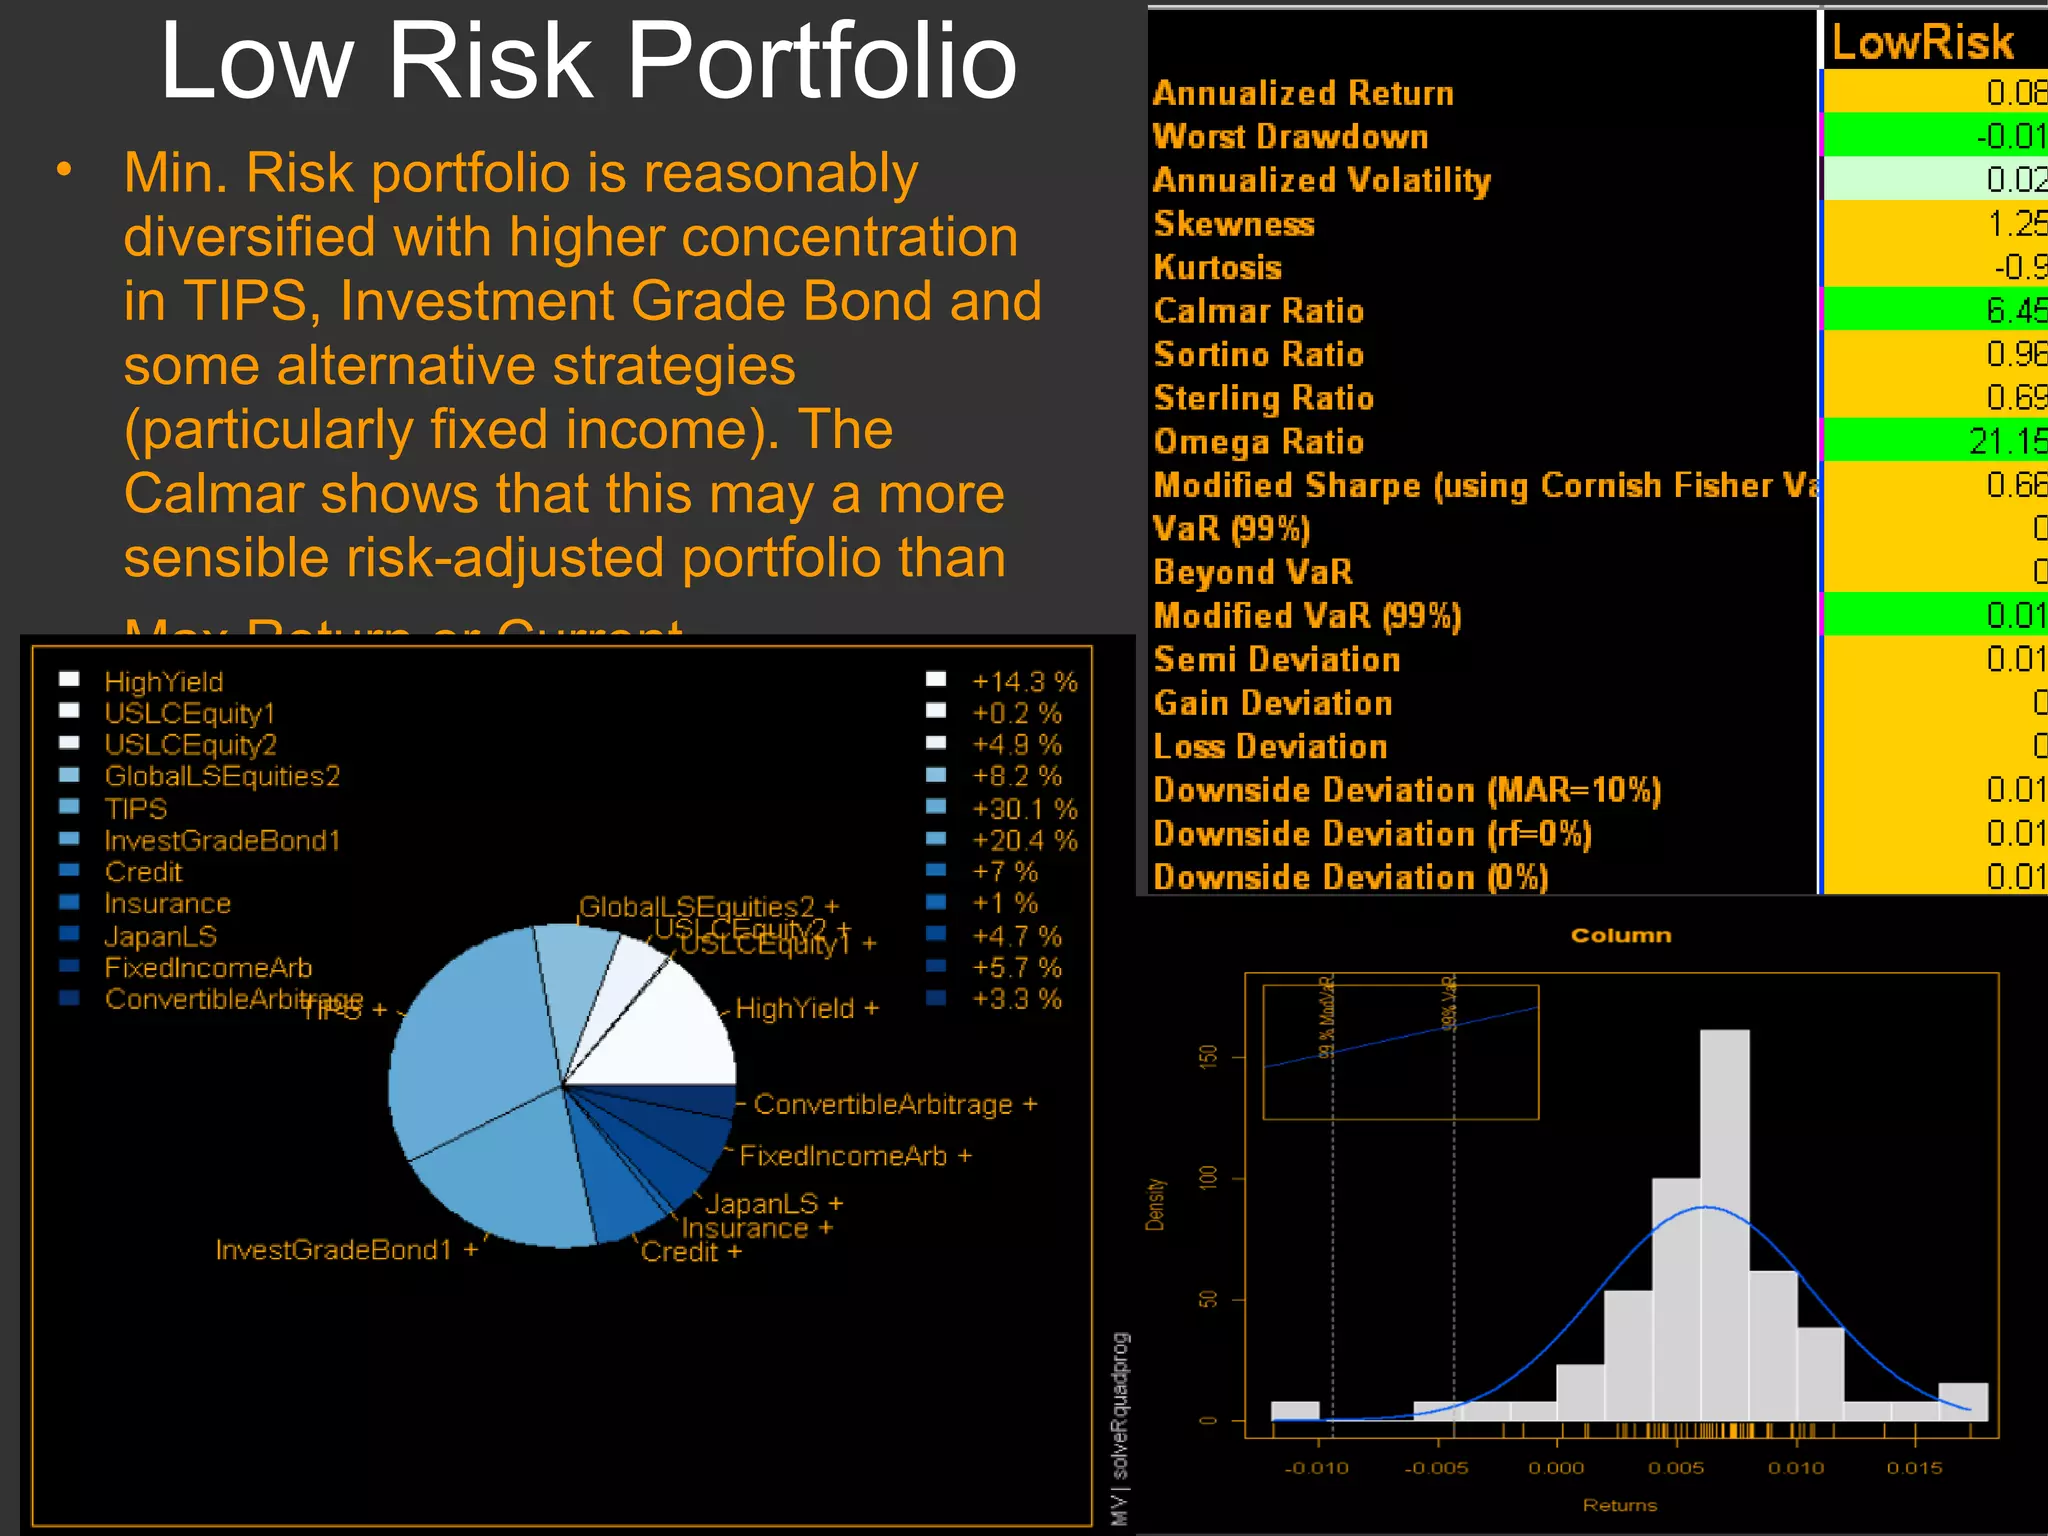
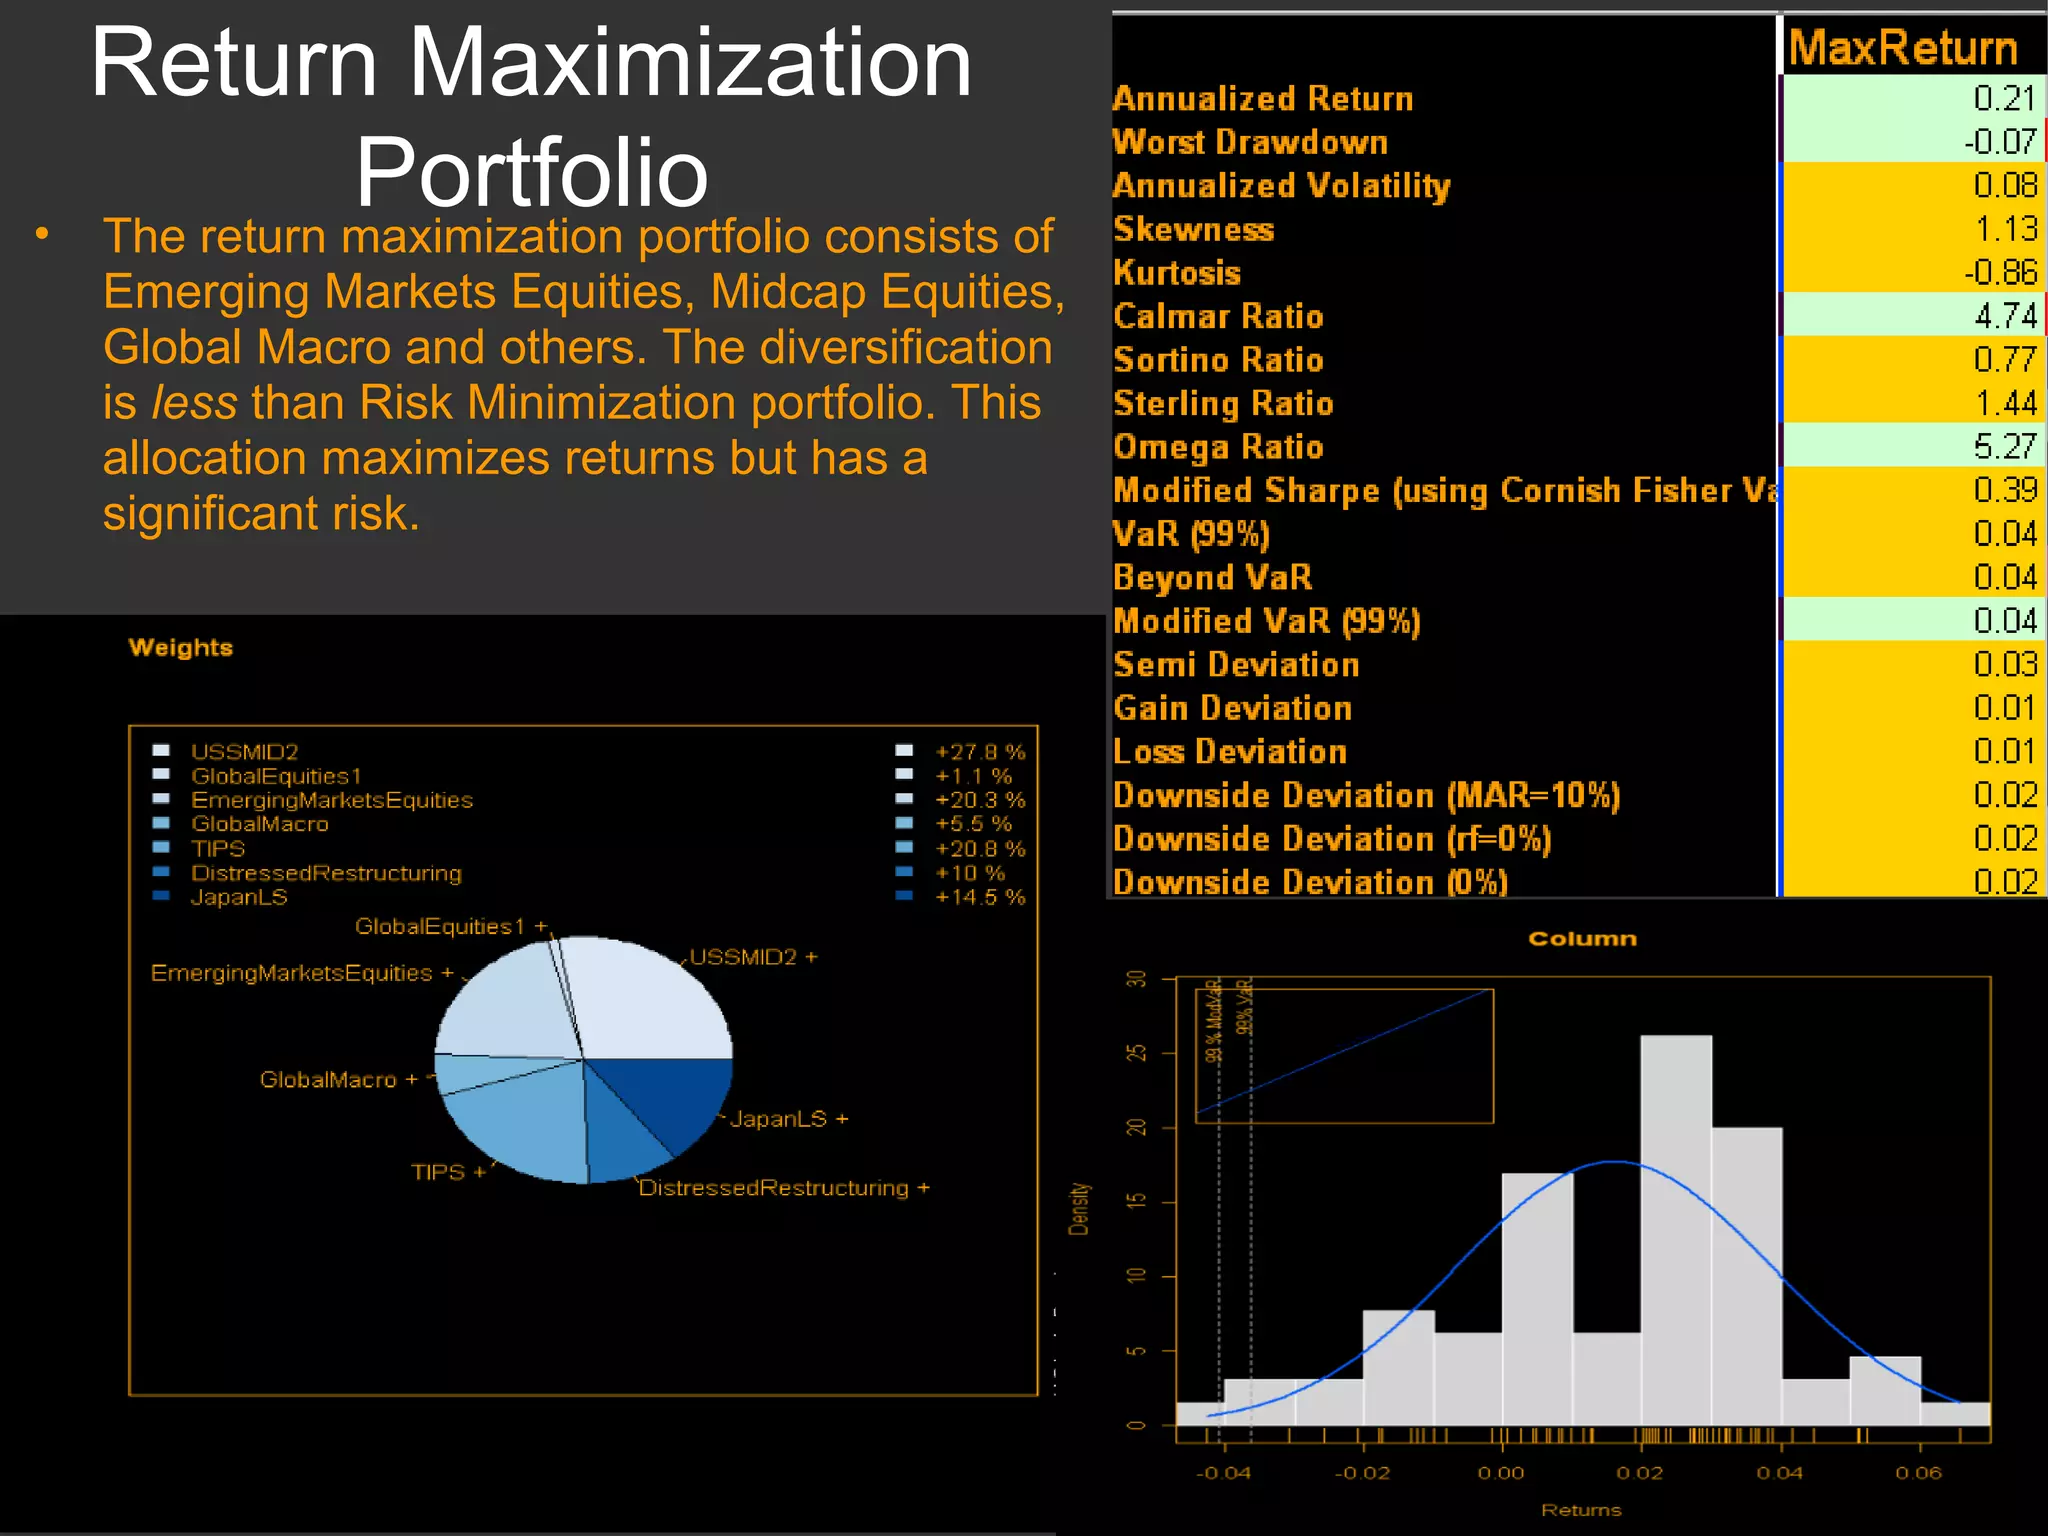
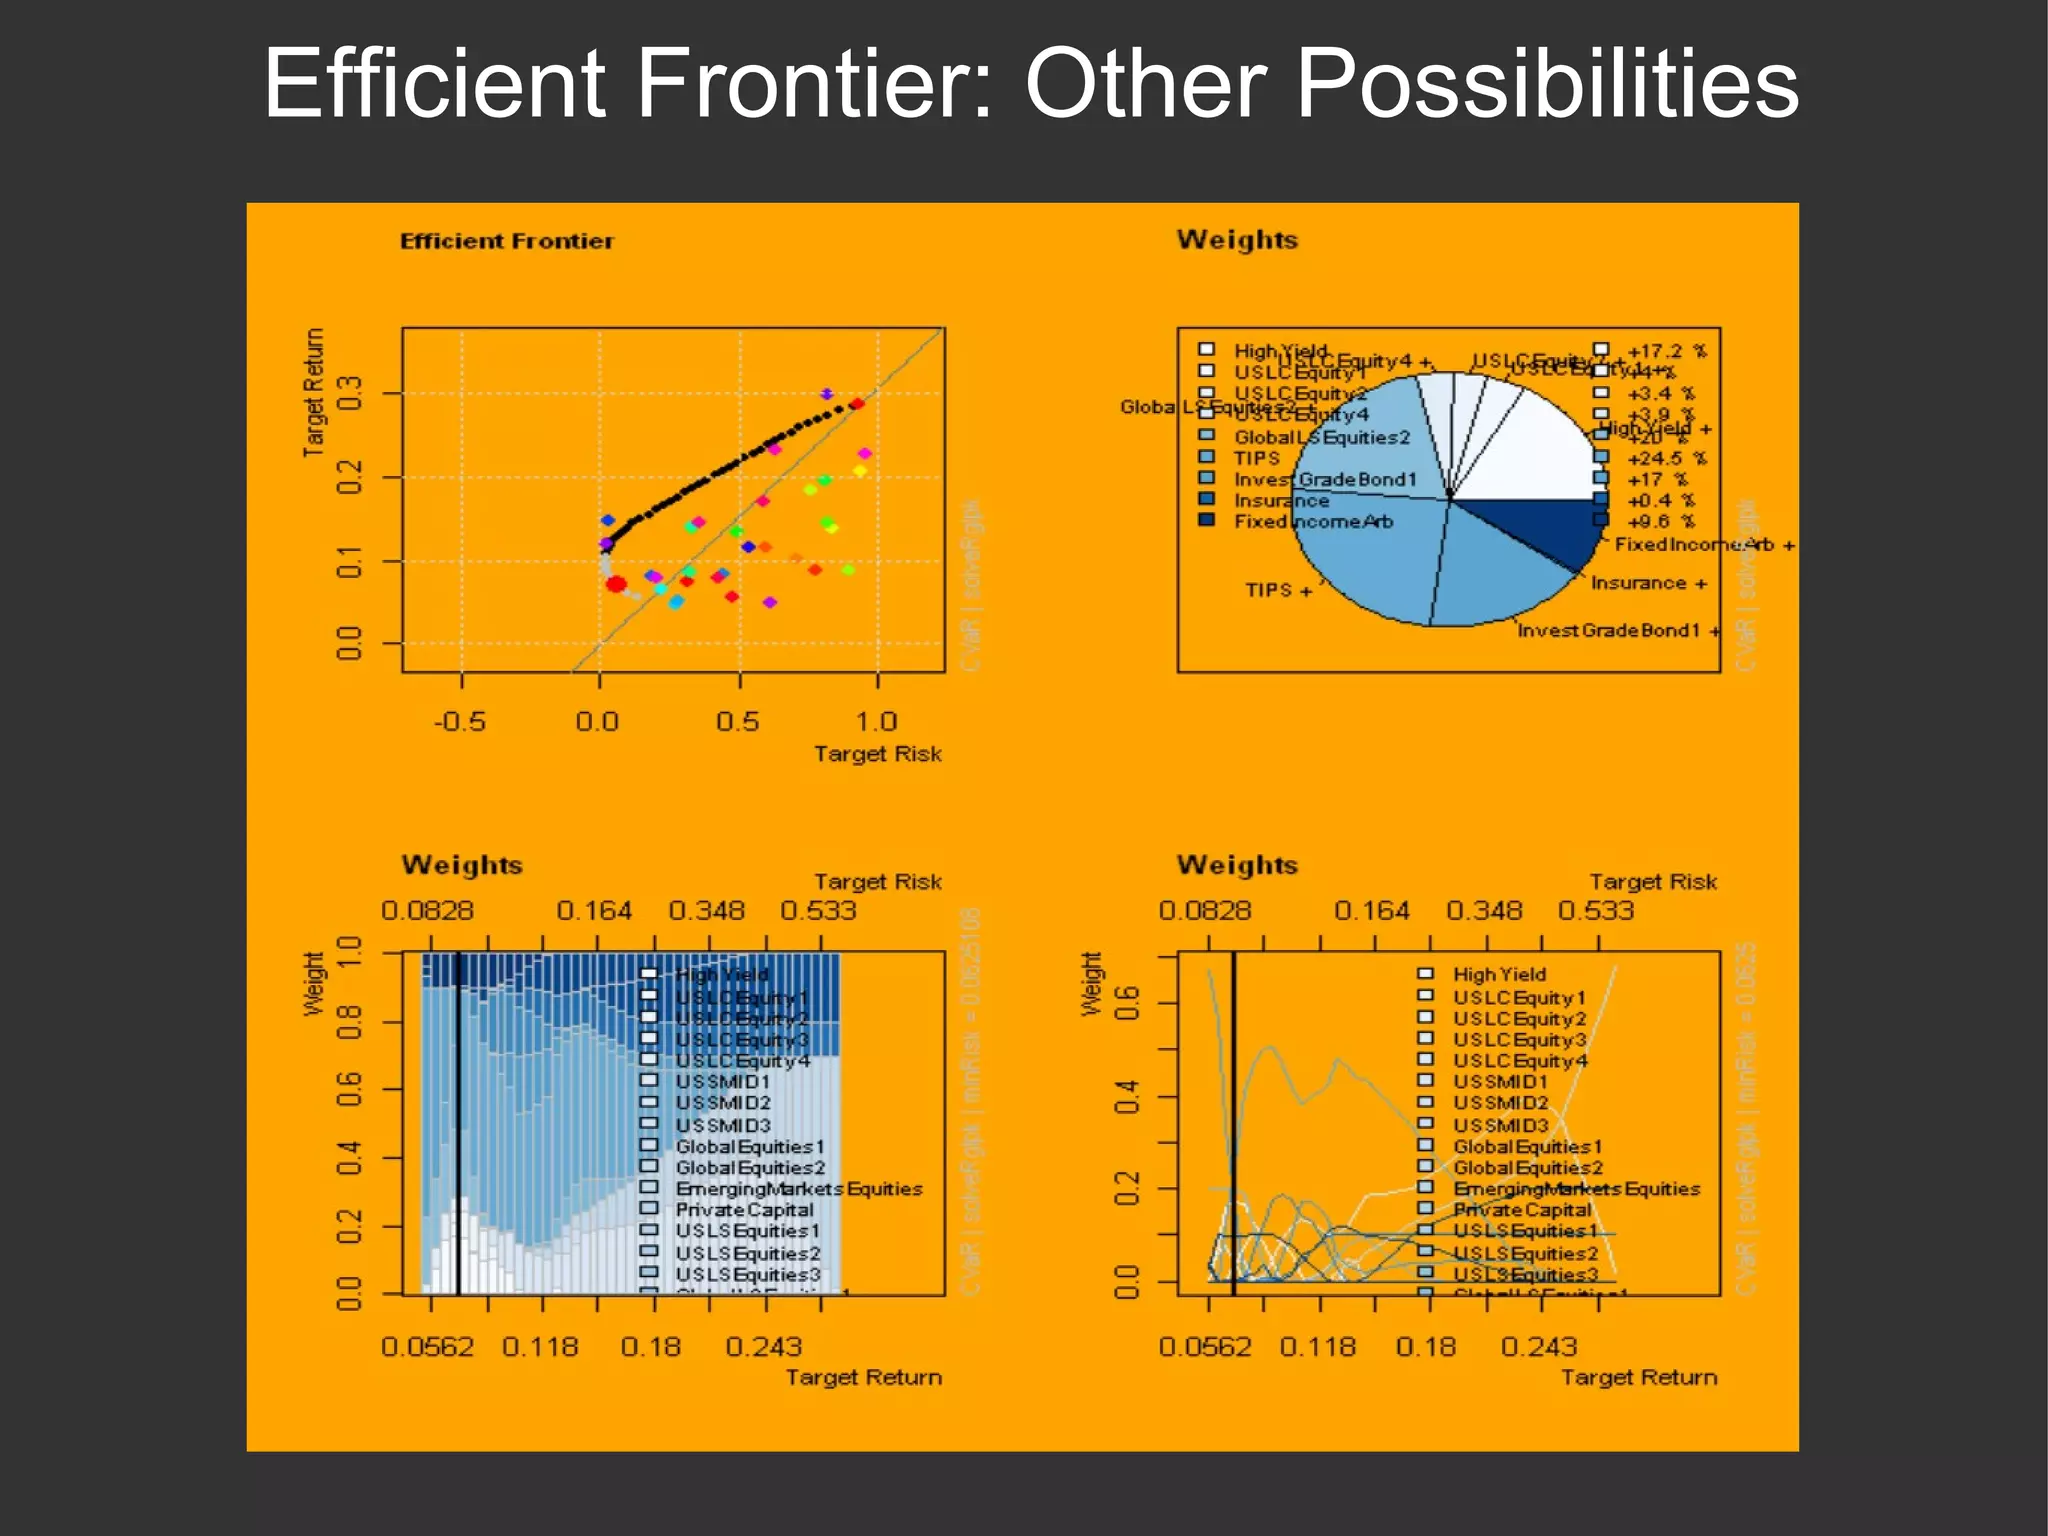
Portfolio Simulation using R and RMetrics Kevin Ashley, Phuong Le, Kara Horvath, Doreen Gasaatura University of Connecticut, MBA
Our approach Calculate risk / return for the current portfolio Bucket assets into traditional, alternative liquid and illiquid classes Define constraints: Long-Only, CVaR Solve the minimization problem: Minimize Risk. What method? MV or CVaR (skewed - quadratic solver). Optimize for “Minimum Risk” or “Maximum Risk” Measure and explain risk metrics Long Only Min CVaR Optimization Problem
Risk Dashboard Our Risk Dashboard summarizes all risk statistics we calculated. We'll be returning to this slide frequently.
Risk Optimization with R: Some Capabilities Diversification (Markowitz, 1952) Covariance Risk Budgeting (finite resource) Tail Risk Budgeting (Copulae, dependence) CVaR optimization (Rockafeller, Uryasev, 1992)
Current Portfolio We compare the Current portfolio, with given weights to the simulated portfolios for Growth and Inflationary environments
Low Risk Portfolio Min. Risk portfolio is reasonably diversified with higher concentration in TIPS, Investment Grade Bond and some alternative strategies (particularly fixed income). The Calmar shows that this may a more sensible risk-adjusted portfolio than Max.Return or Current.
Return Maximization Portfolio The return maximization portfolio consists of Emerging Markets Equities, Midcap Equities, Global Macro and others. The diversification is  less  than Risk Minimization portfolio. This allocation maximizes returns but has a significant risk.
Efficient Frontier: Other Possibilities
Rolling Performance Summary: “Current”,”Inflation” and “Growth” Portfolios ROR Std Sharpe
Omega Plots MAR - minimal acceptable return, 0.1/12 monthly [a,b] interval for which the distribution of the asset return is defined
VaR Sensitivity How different VaR measurements are sensitive to changes in confidence intervals. We can see that the low-risk portfolio is least sensitive to changes in confidence levels.
Rolling Correlation to S&P 500 One of the benefits of our “LowRisk” and “MaxReturn” portfolios is lower correlation to S&P 500, compared to the Current portfolio. The current portfolio has a correlation to S&P which is very close to 1.
Drawdowns for “Current”,”Inflation” and “Growth” Portfolios 1 2 -0.020218 11/30/2005 10/31/2005 2 3 -0.028018 6/30/2004 4/30/2004 4 5 -0.028689 9/30/2006 5/31/2006 2 4 -0.033581 6/30/2005 3/31/2005 1 11 -0.119455 NA 11/30/2007 Recovery Length Depth To From 1 2 -0.002254 4/30/2005 3/31/2005 1 3 -0.005812 6/30/2004 4/30/2004 2 3 -0.011916 9/30/2003 7/31/2003 Recovery Length Depth To From 1 2 -0.025694 11/30/2005 10/31/2005 5 6 -0.030773 10/31/2006 5/31/2006 2 4 -0.038126 6/30/2005 3/31/2005 1 4 -0.039592 NA 6/30/2008 4 7 -0.068138 5/31/2008 11/30/2007 Recovery Length Depth To From In terms of the Drawdown, we’re much better off with both simulated portfolios, the Min Risk being very low drawdown.
Conclusion We solved optimization problem both ways: to create a "Maximum Return" and "Minimum Risk" given the weight constraints and CVaR downside risk measure. Our portfolios are significantly better constructed than the initial one (drawdown, downside risk, ratios).

Hedge Fund Risks Simulation

  • 1.
    Portfolio Simulation usingR and RMetrics Kevin Ashley, Phuong Le, Kara Horvath, Doreen Gasaatura University of Connecticut, MBA
  • 2.
    Our approach Calculaterisk / return for the current portfolio Bucket assets into traditional, alternative liquid and illiquid classes Define constraints: Long-Only, CVaR Solve the minimization problem: Minimize Risk. What method? MV or CVaR (skewed - quadratic solver). Optimize for “Minimum Risk” or “Maximum Risk” Measure and explain risk metrics Long Only Min CVaR Optimization Problem
  • 3.
    Risk Dashboard OurRisk Dashboard summarizes all risk statistics we calculated. We'll be returning to this slide frequently.
  • 4.
    Risk Optimization withR: Some Capabilities Diversification (Markowitz, 1952) Covariance Risk Budgeting (finite resource) Tail Risk Budgeting (Copulae, dependence) CVaR optimization (Rockafeller, Uryasev, 1992)
  • 5.
    Current Portfolio Wecompare the Current portfolio, with given weights to the simulated portfolios for Growth and Inflationary environments
  • 6.
    Low Risk PortfolioMin. Risk portfolio is reasonably diversified with higher concentration in TIPS, Investment Grade Bond and some alternative strategies (particularly fixed income). The Calmar shows that this may a more sensible risk-adjusted portfolio than Max.Return or Current.
  • 7.
    Return Maximization PortfolioThe return maximization portfolio consists of Emerging Markets Equities, Midcap Equities, Global Macro and others. The diversification is less than Risk Minimization portfolio. This allocation maximizes returns but has a significant risk.
  • 8.
  • 9.
    Rolling Performance Summary:“Current”,”Inflation” and “Growth” Portfolios ROR Std Sharpe
  • 10.
    Omega Plots MAR- minimal acceptable return, 0.1/12 monthly [a,b] interval for which the distribution of the asset return is defined
  • 11.
    VaR Sensitivity Howdifferent VaR measurements are sensitive to changes in confidence intervals. We can see that the low-risk portfolio is least sensitive to changes in confidence levels.
  • 12.
    Rolling Correlation toS&P 500 One of the benefits of our “LowRisk” and “MaxReturn” portfolios is lower correlation to S&P 500, compared to the Current portfolio. The current portfolio has a correlation to S&P which is very close to 1.
  • 13.
    Drawdowns for “Current”,”Inflation”and “Growth” Portfolios 1 2 -0.020218 11/30/2005 10/31/2005 2 3 -0.028018 6/30/2004 4/30/2004 4 5 -0.028689 9/30/2006 5/31/2006 2 4 -0.033581 6/30/2005 3/31/2005 1 11 -0.119455 NA 11/30/2007 Recovery Length Depth To From 1 2 -0.002254 4/30/2005 3/31/2005 1 3 -0.005812 6/30/2004 4/30/2004 2 3 -0.011916 9/30/2003 7/31/2003 Recovery Length Depth To From 1 2 -0.025694 11/30/2005 10/31/2005 5 6 -0.030773 10/31/2006 5/31/2006 2 4 -0.038126 6/30/2005 3/31/2005 1 4 -0.039592 NA 6/30/2008 4 7 -0.068138 5/31/2008 11/30/2007 Recovery Length Depth To From In terms of the Drawdown, we’re much better off with both simulated portfolios, the Min Risk being very low drawdown.
  • 14.
    Conclusion We solvedoptimization problem both ways: to create a "Maximum Return" and "Minimum Risk" given the weight constraints and CVaR downside risk measure. Our portfolios are significantly better constructed than the initial one (drawdown, downside risk, ratios).

Editor's Notes

  • #2 Kevin - Hi, let's try to use Google docs and this chat for collaboration